
Recommended
More Related Content
What's hot
Viewers also liked
Viewers also liked (10)
Similar to 2004_organic_growthcc
Similar to 2004_organic_growthcc (20)
More from finance22
More from finance22 (20)
Recently uploaded
Recently uploaded (20)
2004_organic_growthcc
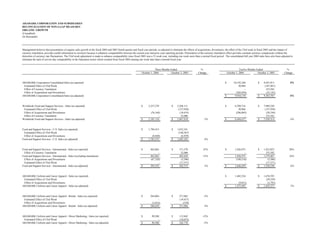
- 1. ARAMARK CORPORATION AND SUBSIDIARIES RECONCILIATION OF NON-GAAP MEASURES ORGANIC GROWTH (Unaudited) (In thousands) Management believes that presentation of organic sales growth in the fiscal 2004 and 2003 fourth quarter and fiscal year periods, as adjusted to eliminate the effects of acquisitions, divestitures, the effect of the 53rd week in fiscal 2003 and the impact of currency translation, provides useful information to investors because it enhances comparability between the current year and prior year reporting periods. Elimination of the currency translation effect provides constant currency comparisons without the distortion of currency rate fluctuations. The 53rd week adjustment is made to enhance comparability since fiscal 2003 was a 53 week year, including one week more than a normal fiscal period. The consolidated full year 2004 sales have also been adjusted to eliminate the lack of service day comparability in the Education sector which resulted from fiscal 2004 starting one week later than a normal fiscal year. Three Months Ended % Twelve Months Ended % October 1, 2004 October 3, 2003 Change October 1, 2004 October 3, 2003 Change 8% ARAMARK Corporation Consolidated Sales (as reported) $ 10,192,240 $ 9,447,815 Estimated Effect of 53rd Week 30,964 (187,467) Effect of Currency Translation - 155,582 Effect of Acquisitions and Divestitures (305,034) (32,143) 6% ARAMARK Corporation Consolidated Sales (as adjusted) $ 9,918,170 $ 9,383,787 Worldwide Food and Support Services - Sales (as reported) $ 2,257,278 $ 2,204,111 $ 8,709,716 $ 7,969,220 Estimated Effect of 53rd Week - (157,938) 30,964 (157,938) Effect of Acquisitions and Divestitures (76,168) (10,435) (296,003) (28,350) Effect of Currency Translation - 32,080 - 155,582 Worldwide Food and Support Services - Sales (as adjusted) $ 2,181,110 $ 2,067,818 5% $ 8,444,677 $ 7,938,514 6% Food and Support Services - U.S. Sales (as reported) $ 1,794,415 $ 1,832,541 Estimated Effect of 53rd Week - (140,367) Effect of Acquisitions and Divestitures (8,840) (6,929) Food and Support Services - U.S. Sales (as adjusted) $ 1,785,575 $ 1,685,245 6% Food and Support Services - International - Sales (as reported) $ 462,863 $ 371,570 25% $ 1,826,975 $ 1,423,825 28% Effect of Currency Translation - 32,080 - 155,582 Food and Support Services - International - Sales (excluding translation) 462,863 403,650 15% 1,826,975 1,579,407 16% Effect of Acquisitions and Divestitures (67,328) (3,506) (180,516) (3,506) Estimated Effect of 53rd Week - (17,571) - (17,571) Food and Support Services - International - Sales (as adjusted) $ 395,535 $ 382,573 3% $ 1,646,459 $ 1,558,330 6% ARAMARK Uniform and Career Apparel - Sales (as reported) $ 1,482,524 $ 1,478,595 Estimated Effect of 53rd Week - (29,529) Effect of Acquisitions and Divestitures (9,031) (3,793) ARAMARK Uniform and Career Apparel - Sales (as adjusted) $ 1,473,493 $ 1,445,273 2% ARAMARK Uniform and Career Apparel - Rental - Sales (as reported) $ 264,064 $ 271,062 -3% Estimated Effect of 53rd Week - (19,457) Effect of Acquisitions and Divestitures (3,414) (539) ARAMARK Uniform and Career Apparel - Rental - Sales (as adjusted) $ 260,650 $ 251,066 4% ARAMARK Uniform and Career Apparel - Direct Marketing - Sales (as reported) $ 99,588 $ 112,842 -12% Estimated Effect of 53rd Week - (10,072) ARAMARK Uniform and Career Apparel - Direct Marketing - Sales (as adjusted) $ 99,588 $ 102,770 -3%