1. ARAMARK CORPORATION AND SUBSIDIARIES
RECONCILIATION OF NON-GAAP MEASURES
ORGANIC GROWTH
(Unaudited)
(In thousands)
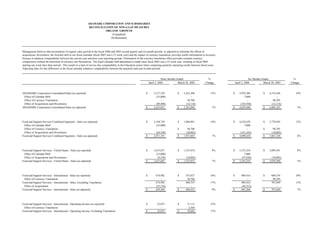
Management believes that presentation of organic sales growth in the fiscal 2004 and 2003 second quarter and six-month periods, as adjusted to eliminate the effects of
acquisitions, divestitures, the forward shift in our fiscal calendar (fiscal 2003 was a 53 week year) and the impact of currency translation, provides useful information to investors
because it enhances comparability between the current year and prior year reporting periods. Elimination of the currency translation effect provides constant currency
comparisons without the distortion of currency rate fluctuations. The fiscal calendar shift adjustment is made since fiscal 2003 was a 53 week year, resulting in fiscal 2004
starting one week later than normal. This results in a lack of service day comparability in the Education sector when comparing quarterly operating results between fiscal years.
Adjusting sales for this difference in the fiscal calendar enhances comparability between the quarterly and year-to-date periods.
Three Months Ended % Six Months Ended %
April 2, 2004 March 28, 2003 Change April 2, 2004 March 28, 2003 Change
ARAMARK Corporation Consolidated Sales (as reported) $ 2,517,529 $ 2,243,306 12% $ 4,976,386 $ 4,519,246 10%
Effect of Calendar Shift (33,000) - 7,000 -
Effect of Currency Translation - 50,706 - 98,295
Effect of Acquisitions and Divestitures (49,498) (12,116) (143,938) (12,116)
ARAMARK Corporation Consolidated Sales (as adjusted) $ 2,435,031 $ 2,281,896 7% $ 4,839,448 $ 4,605,425 5%
Food and Support Services Combined Segments - Sales (as reported) $ 2,148,739 $ 1,886,901 14% $ 4,224,670 $ 3,778,945 12%
Effect of Calendar Shift (33,000) - 7,000 -
Effect of Currency Translation - $ 50,706 - $ 98,295
Effect of Acquisitions and Divestitures (44,548) (10,002) (141,242) (10,002)
Food and Support Services Combined Segments - Sales (as adjusted) $ 2,071,191 $ 1,927,605 7% $ 4,090,428 $ 3,867,238 6%
Food and Support Services - United States - Sales (as reported) $ 1,673,837 $ 1,533,074 9% $ 3,335,254 $ 3,089,391 8%
Effect of Calendar Shift (33,000) - 7,000 -
Effect of Acquisitions and Divestitures (9,230) (10,002) (97,030) (10,002)
Food and Support Services - United States - Sales (as adjusted) $ 1,631,607 $ 1,523,072 7% $ 3,245,224 $ 3,079,389 5%
Food and Support Services - International - Sales (as reported) $ 474,902 $ 353,827 34% $ 889,416 $ 689,554 29%
Effect of Currency Translation - 50,706 - 98,295
Food and Support Services - International - Sales, Excluding Translation 474,902 404,533 17% 889,416 787,849 13%
Effect of Acquisitions (35,318) - (44,212) -
Food and Support Services - International - Sales (as adjusted) $ 439,584 $ 404,533 9% $ 845,204 $ 787,849 7%
Food and Support Services - International - Operating Income (as reported) $ 23,075 $ 17,113 35%
Effect of Currency Translation - 2,569
Food and Support Services - International - Operating Income, Excluding Translation $ 23,075 $ 19,682 17%