anlaysis.docx
•Download as DOCX, PDF•
0 likes•2 views

This document contains statistical information about 384 participants, including their age, marital status, gender, qualifications, and location. It provides frequency tables and descriptive statistics for these variables. It also shows the results of a regression analysis where the variables BPRP, BORP, BERP, and BCRP were used to predict the variable GF. The regression was significant, with the four predictor variables together explaining 61.8% of the variance in GF.

Recommended
Recommended
More Related Content
Recently uploaded
Recently uploaded (20)
Featured
Featured (20)
anlaysis.docx
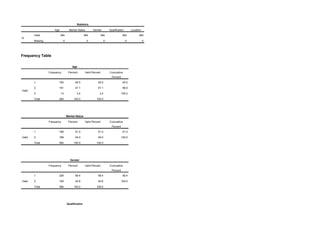
- 1. Statistics Age Martial Status Gender Qualification Location N Valid 384 384 384 384 384 Missing 0 0 0 0 0 Frequency Table Age Frequency Percent Valid Percent Cumulative Percent Valid 1 190 49.5 49.5 49.5 2 181 47.1 47.1 96.6 3 13 3.4 3.4 100.0 Total 384 100.0 100.0 Martial Status Frequency Percent Valid Percent Cumulative Percent Valid 1 196 51.0 51.0 51.0 2 188 49.0 49.0 100.0 Total 384 100.0 100.0 Gender Frequency Percent Valid Percent Cumulative Percent Valid 1 228 59.4 59.4 59.4 2 156 40.6 40.6 100.0 Total 384 100.0 100.0 Qualification
- 2. Frequency Percent Valid Percent Cumulative Percent Valid 1 26 6.8 6.8 6.8 2 223 58.1 58.1 64.8 3 127 33.1 33.1 97.9 4 8 2.1 2.1 100.0 Total 384 100.0 100.0 Location Frequency Percent Valid Percent Cumulative Percent Valid 1 247 64.3 64.3 64.3 2 134 34.9 34.9 99.2 3 2 .5 .5 99.7 5 1 .3 .3 100.0 Total 384 100.0 100.0
- 3. Descriptive Stats Descriptive Statistics N Minimum Maximum Mean Std. Deviation Age 384 1 3 1.54 .563 Martial Status 384 1 2 1.49 .501 Gender 384 1 2 1.41 .492 Qualification 384 1 4 2.30 .624 Location 384 1 5 1.37 .525 Valid N (listwise) 384 Correlationsb BERP1 BERP BORP BCRP BPRP GF BERP1 Pearson Correlation 1 .739** .379** .390** .387** .331** Sig. (2-tailed) .000 .000 .000 .000 .000 BERP Pearson Correlation .739** 1 .569** .583** .579** .570** Sig. (2-tailed) .000 .000 .000 .000 .000 BORP Pearson Correlation .379** .569** 1 .611** .558** .563** Sig. (2-tailed) .000 .000 .000 .000 .000 BCRP Pearson Correlation .390** .583** .611** 1 .742** .694** Sig. (2-tailed) .000 .000 .000 .000 .000 BPRP Pearson Correlation .387** .579** .558** .742** 1 .743** Sig. (2-tailed) .000 .000 .000 .000 .000 GF Pearson Correlation .331** .570** .563** .694** .743** 1 Sig. (2-tailed) .000 .000 .000 .000 .000 **. Correlation is significant at the 0.01 level (2-tailed). b. Listwise N=384
- 4. Regresion Analsysis Variables Entered/Removeda Model Variables Entered Variables Removed Method 1 BPRP, BORP, BERP, BCRPb . Enter a. Dependent Variable: GF b. All requested variables entered. Model Summaryb Model R R Square Adjusted R Square Std. Error of the Estimate Change Statistics Durbin-Watson R Square Change F Change df1 df2 Sig. F Change 1 .786a .618 .614 .51164 .618 153.147 4 379 .000 1.856 a. Predictors: (Constant), BPRP, BORP, BERP, BCRP b. Dependent Variable: GF ANOVAa Model Sum of Squares df Mean Square F Sig. 1 Regression 160.358 4 40.090 153.147 .000b Residual 99.211 379 .262 Total 259.570 383 a. Dependent Variable: GF b. Predictors: (Constant), BPRP, BORP, BERP, BCRP Coefficientsa Model Unstandardized Coefficients Standardized Coefficients t Sig. Collinearity Statistics B Std. Error Beta Tolerance VIF 1 (Constant) -.268 .161 -1.665 .097 BERP .133 .048 .118 2.768 .006 .559 1.788 BORP .114 .046 .107 2.502 .013 .551 1.816
- 5. BCRP .261 .058 .230 4.481 .000 .382 2.621 BPRP .511 .057 .445 8.985 .000 .412 2.430 a. Dependent Variable: GF Collinearity Diagnosticsa Model Dimension Eigenvalue Condition Index Variance Proportions (Constant) BERP BORP BCRP BPRP 1 1 4.935 1.000 .00 .00 .00 .00 .00 2 .021 15.231 .97 .03 .01 .06 .05 3 .018 16.515 .03 .43 .23 .12 .21 4 .017 17.240 .00 .54 .71 .00 .02 5 .009 23.302 .00 .00 .04 .81 .72 a. Dependent Variable: GF Residuals Statisticsa Minimum Maximum Mean Std. Deviation N Predicted Value .7511 4.7935 3.5365 .64706 384 Residual -1.98190 1.17956 .00000 .50896 384 Std. Predicted Value -4.305 1.943 .000 1.000 384 Std. Residual -3.874 2.305 .000 .995 384 a. Dependent Variable: GF