Download to read offline


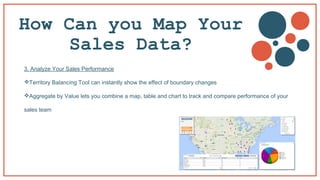


Mapping software enhances sales performance by defining and aligning sales territories, leading to better customer coverage and reduced costs. It allows for instant analysis of sales data, effective resource allocation, and identification of opportunities for realignment. Users can easily map sales data by defining territories, uploading sales data, and analyzing performance through visual data tools.


