Information Capability and Value Creation Strategy
•
2 likes•942 views

Seventeen cases worldwide of the use of smart cards in public transport.

Recommended
Recommended
More Related Content
What's hot
What's hot (17)
Viewers also liked
Viewers also liked (14)
Similar to Information Capability and Value Creation Strategy
Similar to Information Capability and Value Creation Strategy (20)
More from Eric van Heck
More from Eric van Heck (15)
Recently uploaded
Recently uploaded (20)
Information Capability and Value Creation Strategy
- 1. European Journal of Information Systems (2009) 18, 38–51 & 2009 Operational Research Society Ltd. All rights reserved 0960-085X/09 www.palgrave-journals.com/ejis/ Information capability and value creation strategy: advancing revenue management through mobile ticketing technologies Ting Li, Abstract Using the process-oriented view and resource-based theory, we investigate Eric van Heck and how mobile ticketing technologies can successfully enable revenue manage- Peter Vervest ment. We collect data from 17 cases worldwide in which smart cards and mobile devices have been adopted in the public transport industry over the last Department of Decision and Information decade. The use of these technologies allows service providers to capture real- Sciences, RSM Erasmus University, time and complete information of customers’ actual travel. This enables service The Netherlands providers to employ advanced price differentiation and service expansion Correspondence: Ting Li, Department of strategies and achieve new ‘best practice’ in revenue management. The results Decision and Information Sciences, RSM demonstrate that service providers that use more sophisticated mobile Erasmus University, P.O. Box 1738, ticketing technologies are more likely to adopt advanced strategies to create 3000 DR Rotterdam, The Netherlands. value. Further, they are more likely to achieve higher performance gains. Tel: þ 31 0 10 408 1961; European Journal of Information Systems (2009) 18, 38–51. doi:10.1057/ejis.2009.1; Fax: þ 31 0 10 408 9010; published online 17 February 2009 E-mail: tli@rsm.nl Keywords: information capability; mobile ticketing; public transport; revenue manage- ment; smart cards; value creation Introduction The past decade has witnessed an increase in the application of revenue management. Firms use various quantitative analysis techniques such as customer segmentation and pricing optimization to allocate capacity and manage demand. The success of firms such as American Airlines (Smith et al., 1992) and National Car Rental (Geraghty & Johnson, 1997) has encouraged scholars (Talluri & van Ryzin, 2004; Garrow et al., 2007) and practitioners (Riddell, 2006) to explore the possibilities of leveraging detailed customer data for revenue management. This process is further accelerated by the increased implementation of advanced information technologies (IT). For example, using mobile ticketing technologies enabled by smart card and mobile devices, firms can learn about customer behavior with far more precision. This permits them to adjust their services and prices to improve their revenues and operations. Hence, there has been a growing interest in information systems (IS) research to study revenue management supported by mobile ticketing technologies (Elmaghraby & Keskinocak, 2003; Talluri & van Ryzin, 2004). Recently, strategic pricing decisions in the presence of IT has become an Received: 18 February 2008 active area in the IS discipline (Brynjolfsson & Smith, 2000; Clemons et al., Revised: 1 July 2008 2nd Revision: 15 October 2008 2002; Bergen et al., 2005; Oh & Lucas, 2006; Kauffman & Wood, 2007). 3rd Revision: 17 November 2008 Earlier research has provided evidence of the important role that IT plays 4th Revision: 2 January 2009 in supporting pricing-related decisions. On the demand side, IT increases Accepted: 12 January 2009 market transparency by lowering customers’ search costs for product
- 2. Information capability and value creation strategy Ting Li et al 39 and service information (Bakos, 1997). On the supply propositions. Then, we introduce our research methodol- side, IT creates opportunities for firms to adjust their ogy and construct measurement. Subsequently, we pricing decisions (Bergen et al., 2005; Kauffman & Wood, present the analysis and results. Finally, we conclude 2007). IT enables companies to set prices with higher with discussions and directions for future research. precision, segment customers more accurately, track customer behavior, and adjust prices promptly. Pricing Theoretical perspective strategies present a rich opportunity to apply IT and IS to In this section, we present and discuss the process- create and sustain competitive advantage. Earlier research oriented view, resource-based theory, and revenue man- suggests that the increased adoption and development of agement literature. These theoretical perspectives help us dynamic pricing and revenue management can be identify a basis for formulating our conceptual model and attributed to the increased availability of demand data, propositions. the ease of changing prices due to IT, and the availability of decision-support tools that handle large-scale optimi- A process-oriented view of business value of IT zation (Elmaghraby & Keskinocak, 2003). The business value of IT has long been a subject for Though the role of IT in revenue management is often research and intensive debate (Brynjolfsson & Hitt, 1996; acknowledged (Kimes, 2001; Elmaghraby & Keskinocak, Dewan & Kraemer, 2000). Using production theory, 2003; Talluri & van Ryzin, 2004), we have found limited previous research has demonstrated the payoffs of IT systematic research examining the impacts of the use of investment at the firm level (Brynjolfsson & Hitt, 1996; customer demand data on the performance of revenue Gurbaxani et al., 2000; Duliba et al., 2001), the industry management strategies. Our research addresses this void level (Devaraj & Kohli, 2003), and the economy level by empirically studying the business value of IT in (Dewan & Kraemer, 2000). Recent IS studies have revenue management. Specifically, we are motivated by reframed the discussion, from the direct performance the recent adoption of smart cards and mobile technol- impact of IT investment (Brynjolfsson & Hitt, 1996; Hitt ogies (Turban & Brahm, 2000), and by calls from scholars & Brynjolfsson, 1996) to how and why IT shapes the (Shugan, 2004; Talluri & van Ryzin, 2004; van Ryzin, higher-order process capabilities that create performance 2005). We explore the following research questions: What gains for firms (Barua et al., 2004). Using the process- is the business value of mobile ticketing technology? How and oriented view, this stream of literature focuses on the why does the improved IT and customer information advance usage and value creation of IT innovations (Zhu & firms’ revenue management? Consequently, what are the Kraemer, 2005). The process-oriented view suggests that impacts on firm performance? firm level impact of IT can only be measured through its Using the process-oriented view, we argue that firms intermediate process contributions (Barua et al., 2004). that use smart cards and mobile technologies will create a The argument here is that IT is deployed in support of higher-order process capability (i.e., value creation strat- specific activities and purposes, and therefore, the impact egy), which then leads to performance gains for them. In of IT should be assessed at the place where the first-order particular, we suggest that the use of mobile ticketing effects are expected to be realized. technologies enables firms to benefit from revenue This approach is also consistent with a second stream management. We employ a multiple case study approach of research that takes a contingency approach, suggesting (Eisenhardt, 1989) and test our arguments through a that the need is to consider other variables that may study of 17 cases in which mobile ticketing technologies mediate or moderate firm performance. Firms first focus were implemented over the last decade. The results pro- on their business strategies and then allocate IT resources vide evidence that firms using detailed customer beha- to support their core competencies. IT is viewed as an vior information are able to use very advanced price enabler of specific strategies designed to achieve superior differentiation and service expansion strategies. Further, performance (Fairbank et al., 2006). these firms are most likely to achieve higher performance. We chose the public transport industry (including bus, Resource-based theory tram, metro, and railway) as our research setting for two Strongly based on the strategic management literature, reasons. First, the increased adoption of IT, such as smart the resource-based view of the firm posits that firms cards and mobile technologies in the last decade has compete on the basis of unique corporate resources that allowed public transport operators (PTOs) to explore are valuable, rare, difficult to imitate, and non-substitu- opportunities of revenue management that were not table by other resources. In the IS literature, resource- possible earlier. Second, there is a strong need for PTOs to based view has been used to analyze IT capabilities seek for solutions to reduce the concentrations of peak and to explain how IT business value resides more in travel, which causes problems such as over-crowding, the organization’s skills to leverage IT in the key acti- dissatisfied customers, low capacity utilization, and low vities in a firm’s value chain (Bharadwaj, 2000). The revenue. greater the use, the more likely the firm is to deve- The remainder of this paper is organized as follows. lop unique capabilities, and the firm’s core IT infra- First, we introduce our main theoretical perspectives. structure generates higher value (Bharadwaj, 2000; Zhu & Next, we explain our conceptual model and develop the Kraemer, 2005). According to Zhu & Kraemer (2005), European Journal of Information Systems
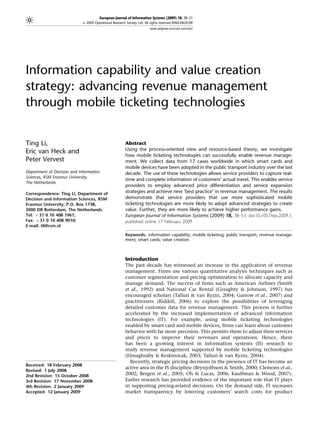
- 3. 40 Information capability and value creation strategy Ting Li et al Information Capability Mobile Ticketing Technology -Smart Card -Mobile Technology Value Creation Strategy P1 -Baseline (access control) P2 Firm Performance -Price differentiation Customer Behavior Information -Service expansion -Who: Customer -What: Ticket type -Where: Origin and destination -When: Departure and arrival time -How: Travel mode Figure 1 Conceptual model. resource-based theory provides a theoretical basis for should have relatively high fixed costs but low marginal linking IT use and value creation. costs of production. Last, a firm should have the capacity to capture abundant customer data via IT. Advanced Revenue management theory infrastructure is needed to collect and store demand data Revenue management deals with selling the right product and automate pricing decisions. to the right customers at the right time for the right price to maximize firm revenue (Kimes, 2001). There are two Conceptual model and propositions main methods in revenue management: quantity-based Using the process-oriented view and resource-based and price-based revenue management (Talluri & van theory, we now develop a conceptual model to explore Ryzin, 2004). Quantity-based revenue management fo- the use and value of mobile ticketing technology in cuses on optimal product allocation. Price-based revenue developing revenue management strategies. We present management mainly deals with the demand side of the our conceptual model (see Figure 1), explain the key supply-demand equation. In the public transport indus- elements of the model, and propose two propositions. try, the price-based method (i.e., price and service differentiation) is more appropriate. This is because by Information capability using mobile ticketing technologies, PTOs can easily set We define information capability as a firm’s ability to and adjust prices at minimal costs while at the same time capture the complete customer behavior information. In receiving customers’ instantaneous feedback. Further, our research context, customer behavior information Talluri & van Ryzin (2004) suggest that the price-based refers to the customer (who), the ticket type (what), the method is the most preferred approach to revenue origin and destination (where), the departure and arrival management. time (when), and the travel mode (how). This is measured Not all firms are able to employ revenue manage- by the ability of the IT to capture the dimensions and ment strategies in their business. The ones where such attributes of customer behavior information that be- strategies are possible have the following characteristics. comes available. First, on the demand side, the higher the customer Mobile ticketing refers to the process whereby customers heterogeneity, the more potential there is to exploit this order, pay for, obtain, and validate tickets using mobile heterogeneity strategically and tactically to improve devices or contactless technologies such as smart cards. In revenues (Talluri & van Ryzin, 2004). Demand should the public transport industry today, four types of exhibit some kinds of variation, such as variations due to technologies are commonly used: paper tickets, magnetic weather, changing patterns on holidays, and time-of-day cards, smart cards, and mobile phones. Paper tickets are or day-of-week. Second, on the supply side, a firm should the most basic form and are used by a large number of operate with a relatively fixed and inflexible capacity and PTOs. Dating back to 1960, magnetic cards, together with production constraints. It may not be able to cope with electronic gates, were introduced to the transportation variations in demand. Further, the products and services systems to provide customer access control. Since 1997, it offers should be perishable and cannot be held in smart cards have become increasingly popular and are inventory. Third, in a cost and pricing structure, firms gradually replacing magnetic cards. When a customer European Journal of Information Systems
- 4. Information capability and value creation strategy Ting Li et al 41 uses a smart card, either to make a trip or to purchase a public transport industry in the past decade. With travel product, the product details are captured and advanced IT, PTOs are able to learn about their customers’ linked to the card. If the customer has registered the card travel behavior in regard to the location to and from under his name, all product and trip details will be added which they travel, what time they travel, how frequently to this individual customer’s record. Mobile technology they travel, and what ticket they purchase, in (nearly) is being adopted at an accelerated rate. For example, real-time. This permits the PTOs to explore the possibi- Tokyo’s ‘Mobile SUICA,’ which includes a RFID chip is lities of developing revenue management strategies that embedded into i-mode FeliCa’s mobile handsets. The were not possible earlier. device was introduced in January 2006 in Tokyo and gained more than 20,000 subscribers within a week (SUICA, 2008). Value creation strategy Rather than IT itself, information has been argued to be According to Porter (1996), a firm’s value creation strategy the source of competitive advantage for firms. Despite a is defined as a set of value creation activities it carries out considerable number of theoretical and empirical works in order to create and deliver value. We distinguish three on the role of IT in creating competitive advantage, the value creation strategies that PTOs use: baseline strategy, literature has identified a consistent lack of success by price differentiation strategy, and service expansion firms in achieving business value through their IT strategy. This distinction is consistent with the two broad investments, and in particular the difficulties in obtain- strategy categories that are discussed in the strategy ing a sustained competitive advantage (Earl, 1989, 1992; literature (Porter, 1980): low cost leadership, which is our Clemons & Row, 1991; Powell & Dent-Micallef, 1997). baseline strategy, and differentiation, which is price The notion that IT per se does not generate sustainable differentiation or service expansion strategy. performance advantage has received increasing support Baseline strategy refers to basic value creation, which in the IS literature (Earl, 1989, 1992; Clemons et al., is the reason why PTOs implement mobile ticketing 1993). The ‘strategic necessity hypothesis’ (Clemons systems in the first place. Fare fraud is very costly for et al., 1993) argues that firms cannot expect IT to produce PTOs, for example, it has been estimated to cost sustainable advantage because most IT are readily avail- Metropolitan Atlanta Rapid Transit Authority an esti- able to all firms – competitors, buyers, suppliers, and mated $10 million per year (Donsky, 2006). The primary potential new entrants – in competitive markets. IT, reason for most PTOs to adopt mobile ticketing is to hence, becomes a ‘strategic necessity’ but not a source of control customer access, prevent fare evasion, and reduce competitive advantage. The exception is when firms use fraud. Of course, mobile ticketing also provides ease of IT to leverage or exploit firm specific intangibles (Powell use for customers, improves passenger flows, reduces & Dent-Micallef, 1997) to obtain sustained profits. ticket-purchasing queues, and reduces PTOs’ operating Yet, despite the success in industries such as airlines costs through accelerating ticket purchase and reducing and car rentals, the public transport industry faces clerical work. difficulties in fully taking advantage of revenue manage- Differentiation strategy includes price differentiation ment. The reasons are twofold. First, PTOs have limited and product/service differentiation. Porter (1980) argues information about their customers’ actual travel beha- that differentiation strategy is an effective approach to vior. Operations of the public transport are largely based create and sustain a firm’s competitive advantage. Service on an open-access system that limits PTOs’ ability to providers that use differentiation strategy are able to obtain customers’ information. In this situation, PTOs provide products and services that customers perceive to mainly depend on in-vehicle counting and periodic be unique (Soh et al., 2006). An example familiar to most survey to obtain customer behavior information. How- is airline ticketing. Airlines dynamically vary ticket prices ever, these methods are usually expensive, labor-inten- and associated conditions based on real-time demand sive, and time-consuming, and hence, customer travel and available capacity at any given departure time. information largely remains outdated, inaccurate or even Service expansion strategy is also rooted in the strategy unknown. Second, partially due to the limited informa- literature. It resembles the concept of virtual value chain tion, PTOs have limited ability to predict the variable orchestration as discussed by Hinterhuber (2002). Service demand. As opposed to airlines, PTOs do not have expansion strategy is a way to create and capture value reservation systems that allow them to predict customer by structuring, coordinating, and integrating the activ- arrivals. Thus, they are challenged in estimating the ities of previously separate markets. By relating these demand variations of their heterogeneous customers. activities effectively to in-house operations, firms are A senior manager, whom we interviewed stated that ‘it is able to develop a network of activities that create new difficult to implement a profitable operating environ- markets. Service expansion is useful in this context ment where our entire business strategy is based on an because electronic ticketing systems can provide micro- ‘open access’ system for flexible traveling, and revenue payment infrastructures that permit other service provi- management is nearly impossible for us.’ ders to adopt them. As a result of this, service providers This situation has started to change with the increased can increase their transactional efficiencies and expand implementation of mobile ticketing technologies in the their services quickly into other industry sectors. European Journal of Information Systems
- 5. 42 Information capability and value creation strategy Ting Li et al Firm performance with a higher information capability are Using mobile ticketing for value creation leads to changes more likely to use an advanced value in PTOs’ cost structure, revenue, and customer volume. creation strategy (i.e. price differentiation What is even more important is the reputation that PTOs or service expansion) than firms with a create. Given PTOs’ social responsibility and public lower information capability. pressure through governmental regulation, PTOs who fail to justify the impacts of pricing strategies will receive heavy criticism from the public and politicians (Li & Value creation strategy and firm performance Wong, 1994; Link, 2004). Customers may express objec- Quantifiable results from revenue management are found tions to crowding, unfairness, and fare complexity. in both management practice (Cross, 1997) and business Consequently, this will lead to changes in customers’ solutions (McCartney, 2000). Bill Brunger, Continental willingness-to-pay. Customers may even shift to other Airlines’ pricing guru (McCartney, 2000), pointed out transport modes. For example, in December 2002, that ‘revenue management is all of our profit, and more.’ Deutsche Bahn (DB), using revenue management strat- Revenue management success stories are encouraging. egy, launched a program to reform its fare structure, American Airlines had an estimated benefit of $1.4 focusing on the long-distance passenger market (Link, billion over a period of 3 years and an annual revenue 2004). Within half a year after the introduction the contribution of over $500 million (Smith et al., 1992). program failed. This failure, in part, was caused by low National Car Rental improved revenue by $56 million in acceptance and widespread criticism of the new pricing the first year after a successful implementation of a structure. In the words of DB customers: ‘the price change revenue management system (Geraghty & Johnson, is opaque and unfriendly,’ ‘the new price scheme is 1997). confusing,’ and ‘the whole fare structure is in need of Grounded in the economics literature, price differen- simplification to make it readily comprehensible and tiation is the most important revenue management usable by staff and passengers.’ technique. It can date back to the concept of price discrimination (Pigou, 1932). Price differentiation refers Information capability and value creation strategy to any pricing policy under which a seller sets different Information processing in organizations is generally prices on various units of the same or a similar product. It defined as the gathering of data, the transformation of extracts a higher price from existing customers while data into information, and the communication and extending sales to new customers who would otherwise storage of information in the organization (Egelhoff, not be served with uniform pricing. Economic theory 1982). The conceptual underpinning of information indicates that price differentiation is inherently good for processing theory is to enhance the capability to handle the profitability of the firm, because it allows the firm to information flow and thereby reduce uncertainty. capture a larger share of the consumer surplus. The Previous research suggests that the most effective orga- economics of revenue management suggests that the nizational strategies are those that recognize an appro- more prices are differentiated by a firm the more revenue priate fit between an organization’s ability to handle will be generated (Talluri & van Ryzin, 2004). Thus, we information and the amount and type of information present our second proposition as follows (P2): that is available or required (Tushman & Nadler, 1978; Egelhoff, 1982). Mobile ticketing technology provides Proposition 2: (The Value Creation Strategy and Firm PTOs with detailed customer behavior information that Performance Proposition): Firms that was only partially attainable through traditional travel use a more advanced value creation strategy surveys. Using this information, PTOs can derive the cost (i.e. price differentiation and service expan- that customers are willing to pay in different market sion) will outperform firms that use a segments. In contrast to time-consuming surveys, mobile baseline strategy. ticketing technology gives almost instantaneous consu- mer feedback. The improvement in information quantity and information quality significantly reduces demand Research method uncertainty. The information-processing notion of the We employ a multiple case study method (Benbasat et al., firms allows us to hypothesize a relationship between a 1987; Yin, 2002) to study large scale mobile ticketing firm’s information capability and its choice of appro- systems that use smart cards in the public transport priate value creation strategy. PTOs, who recognize the industry. Our study is focused on the time period opportunities that the improved information capability between 1997 and 2006. This research design has several provides, will align their activities to create value. Thus, advantages. First, the utilization of multiple cases allows we present our first proposition as follows (P1): for cross-case analysis, which significantly improves the investigation of the proposed research model (Benbasat et al., 1987). Second, we control for industry variations Proposition 1: (The Information Capability and Value related to performance by focusing on smart card Creation Strategy Proposition): Firms adoption in the public transport industry. Smart card European Journal of Information Systems
- 6. Information capability and value creation strategy Ting Li et al 43 adoption in other industries exhibits different perfor- introduction. Fourth, we are interested in the large-scale mance levels, hence controlling for industry is necessary. smart card implementation in public transport, however Third, studying the population in an industrial sector is technology adoption is an ongoing process and it is useful, given the relatively small numbers of selected difficult to obtain the total number of cards that are sold PTOs of this type. Using this research design we do not and in use. Thus, we used the population of the location sample, but study all comparable PTOs in the industry. as a proxy for the size of a given smart card implementa- As such, we study the entire population. tion. The argument here is that in large metropolitan cities public transport is more important than in smaller cities, where daily ridership is not so high. Fifth, for some Case selection cases, where more than one smart card is used, we Contactless smart cards used to transfer electronic eliminated the secondary card of the two. Although the payments have gained widespread implementation in directory listed 139 smart card cases worldwide, only 17 the public transport industry in the last decade and will cases met our criteria: four cases in the United States, 10 become increasingly important for banks and retailers cases in Asia, and three cases in Europe (see Table 1 for a alike (Olsen, 2007). We used the ‘List of Smart Card’ list of the selected cases). directory in Wikipedia (2008) to identify relevant cases. We believe this list to be comprehensive and accurate for two reasons. First, we have followed smart card develop- Data collection ment over the past few years, and all the major initiatives Data were collected from various data sources using that we are aware of are included. Second, we used different data collection methods with the objective of alternative search methods (e.g., Google searches, and triangulation (Eisenhardt, 1989). Data collection was industry magazine listings) to identify possible missing conducted in two phases. In the first phase, we selected cases and no additional cases were added. three representative cases and collected data through We used five criteria to select our cases. First, we only unstructured and semi-structured interviews, firm archi- included cases from North America, Asia, and Europe, val data, public reports, and email exchanges. We did this which cover more than 90% of the world-wide smart card at the beginning in order to establish a good under- implementation. Second, the list we adopted is compre- standing of smart card adoption related to revenue hensive and includes various types of smart card management and pricing decisions. We chose the implementations. We only included cases where a smart Octopus card in Hong Kong, the Oyster card in London, card is used for public transport (usually through and the OV-chipkaart in the Netherlands for three different modes of transport) and excluded cases where reasons. First, these three cases employ different value smart card is only used for retail or identification creation strategies. Octopus uses a service expansion purposes. Third, we chose cases where the smart card strategy, Oyster uses price differentiation strategy, and was introduced between 1997 and 2006. The year 1997 OV-chipkaart uses the baseline strategy. Second, this was when the first smart card – the Octopus card in sample represents different stages of smart card adoption. Hong Kong – was introduced. We thus excluded cases Octopus was the first and most successful adoption in the where we did not have information on the time of world so far (Chau & Poon, 2003). Oyster reached a high Table 1 Worldwide large-scale smart card technology adoption (selected cases) Introduction Place Transportation service provider/issuing authority Name of smart card 1997 Hong Kong Octopus Cards Limited Octopus 1999 Washington DC Washington Metropolitan Area Transit Authority SmarTrip 1999 Shanghai Shanghai Public Transportation Card Co. Shanghai Public Transportation Card 2001 Singapore EZ-Link Private Ltd. EZ-Link 2001 Tokyo JR East and other 5 operators Suica 2001 Guangzhou Yang Cheng Tong Corporation Yang Cheng Tong 2001 Moscow Moscow Metro Transport Card 2002 Taipei Taipei Smart Card Corporation EasyCard 2002 Chicago Chicago Transit Authority Chicago Card 2004 Bangkok Bangkok Metro Bangkok Metro Smart Card 2004 London Transport for London Oyster Card 2004 Seoul Korea Smart Card Co. Ltd. T-money 2004 Shenzhen Shenzhen TransCard Corporation Shenzhen TransCard 2005 Atlanta Metropolitan Atlanta Rapid Transit Authority Breeze Card 2006 Beijing Beijing Municipal Administration and Communications Card Co. Yikatong 2006 Boston Massachusetts Bay Transportation Authority Charlie Card 2006 The Netherlands Trans Link Systems OV-chipkaart European Journal of Information Systems
- 7. 44 Information capability and value creation strategy Ting Li et al Table 2 Overview of interviewees ticketing technologies in terms of product characteristics, process characteristics, and usability. Second, on the Cases Number of Business unit/functions spectrum of customer behavior information, we analyzed respondents the data attributes that could be obtained from each Octopus 6 General Manager mobile ticketing technology. Depending on the unique Marketing Department (department characteristics of the type of technology and the number manager) of data attributes that it captures, we distinguished Operations Department (department between high and low levels of information capability. manager) Ten PTOs had high information capability whereas seven Strategy Development Department PTOs had relatively low information capability. (department manager) Value creation strategy PTOs or issuing authorities of Oyster 3 Pricing Department (researcher) smart cards pursue either a baseline strategy (access Transport Research (consultants) control/fare collection) or a differentiation strategy (i.e., OV-chipkaart 7 Business Development Department revenue management strategy and service expansion). (department manager) We examined the purpose of smart card implementation Tariff and Pricing (project manager) for each case and determined the construct of value Marketing Research and Advice creation strategy. (senior project leader) We identified a case as a baseline case if the PTOs or Revenue Management (department issuing authorities use smart cards primarily for access manager) control, providing convenience to customers, and redu- Independent Research Firms cing operational costs, but not for pricing-related strate- (independent consultants) gies. We identified the degree of use of price differentiation strategy using the total number of pricing schemes that PTOs employ as a proxy. Price differentia- tion is very challenging to measure because nearly all penetration rate within a relatively short period of time. PTOs use some form of differentiated pricing. Thus, it is OV-chipkaart is the first nation-wide implementation, difficult to determine to what extent a PTO uses price though it is still in its early phases of development. differentiation. Based on the price discrimination litera- Further, these three cases also had large societal impacts ture (Pigou, 1932; Png, 1999), we developed a taxonomy and received widespread media attention. In total, we to characterize the pricing practices in the public conducted 16 interviews for these three cases (see Table 2). transport industry (Li et al., 2007). According to this The interviewees are managers in strategy, pricing taxonomy, we coded each pricing scheme that each and revenue management, and business development PTO uses, and then computed a differentiation score by in three geographically different locations. Each step of summing the value of each pricing scheme that we the research process is well documented, which enhances evaluated. If a PTO actively uses more than four types of the reliability of our approach (Yin, 2002). pricing, we coded the case as actively exercising price In the second phase of the data collection process, we differentiation. We identified service expansion strategy collected archival data for the remaining cases from through the use of smart cards for multiple purposes, company websites, corporate brochures, newspapers, and such as retail, library, and identification, rather than only magazine reports. We reviewed relevant web pages from for transportation purposes (including highway toll gates, press releases that made reference to any of the 17 cases. parking, and ferries). We found that six PTOs use a We also reviewed news articles relating to the service baseline strategy, six PTOs use price differentiation, and providers from LexisNexis Academic and some local news five PTOs use service expansion. sources, such as Boston Globe. Capturing data both from the firm as well as from external reports increases validity Firm performance We developed three qualitative indi- and reliability in our data collection process. cators of firm performance based on the revenue manage- ment and transportation literature (Talluri & van Ryzin, Constructs and measurements 2004). These indicators are growth in revenue and In this section, we define the constructs and measure- customer volume (Weatherford & Bodily, 1992), reputa- ments used to operationalize our conceptual model. tion (Soh et al., 2006), and longevity (Soh et al., 2006). We Table 3 summarizes the description of and coding for calculated ordinal measures for each performance con- each construct. struct between 1997 and 2006, and we constructed a performance index from the sum of these measures. Information capability As discussed earlier, the four Growth in revenue and passenger volume measures how types of technology commonly used in public transport much new revenue and how many new customers have are paper tickets, magnetic cards, smart cards, and mobile been attracted. Reputation is computed based on the technology. First, we analyzed these four types of mobile positive or negative information stated in the press European Journal of Information Systems
- 8. Information capability and value creation strategy Ting Li et al 45 Table 3 Construct, definition, and measurement Construct Definition Measurement Information A firm’s ability to capture the 0 – Low: If less sophisticated information technology is being used and limited capability complete behavior information in customer behavior information is captured regard to what, where, when, how, 1 – High: If more sophisticated information technology is being used and and whom of their customers (nearly) complete customer behavior information of actual travel is captured in real-time Mobile ticketing The sophistication of the mobile Product technology ticketing technologies that are being Usage mechanism (1 – Contactless; 0 – Contact) used, which is measured as the Memory (1 – High; 0 – Low) unique characteristics of each Durability (1 – Durable; 0 – Low, easily damaged) technology Data security (1 – High; 0 – Low) Process Obtainment (1 – Internet; 0 – Ticket office) Transaction (1 – Can be viewed; 0 – Cannot be viewed) Replenishment (1 – Can be reloaded; 0 – Cannot be reloaded) Usability Convenience (1 – High; 0 – Low) Speed (1 – Fast; 0 – Slow) Personalization (1 – Yes; 0 – No) Customer behavior The completeness of the customer Number of data attributes that are captured by each mobile ticketing information information of actual travel technology: for example, the location to and from which the customer travel, frequency of travel, etc. Value creation Value creation strategy that is used by 0 – Baseline: Smart card is primarily used for access control, fare collection, and strategy the service provider providing speedy and convenient services 1 – Price differentiation: If there are more than four types of pricing schemes used 2 – Service expansion: Besides public transport (including highway toll gates, parking, and ferry), smart card is also widely used for retail, library, identification, and other purposes Price differentiation Price differentiation that the service Number of pricing schemes offered to the customers, minimum 0 and provider uses maximum 8. Uniform pricing Profile-based pricing Usage-based pricing Distance-based pricing Time-based pricing Route-based pricing OD-based pricing Mode-based pricing Firm performance The performance impact of the Sum of coded values for revenue growth/operational excellence, reputation, service provider, in terms of revenue/ and longevity: customer volume growth, reputation, Minimum of 0 and longevity Maximum of 6 Revenue/customer The increase in revenue and/or 0 – reduced volume customer volume of the service 1 – no change provider 2 – improved Reputation The reputation among customers, 0 – negative politicians, and general public 1 – neutral 2 – positive Longevity Number of years since the adoption 0 – 0–2 years of smart card of the service provider 1 – 3–5 years 2 – 6 years or above European Journal of Information Systems
- 9. 46 Information capability and value creation strategy Ting Li et al Table 4 Frequency cross-tabulation Information capability Performance Value creation strategy Baseline Price differentiation Service expansion Total High High 0 4 5 9 Low 1 0 0 1 Low High 0 0 0 0 Low 5 2 0 7 Total 6 6 5 17 Table 5 Mobile ticketing technology comparison Paper ticket Magnetic card Smart card Mobile Product view Usage mechanism Purchase ticket Contact: card has to be Contactless: card can be Contactless: card is before/while traveling inserted into slot read in proximity embedded into mobile Memory None Limited High, allow innovative Very high, allow interaction pricing policy with other technology Durability Low Easily damaged Low Durable (plastic) Durable Data security Low (lost, stolen) (information lost through Medium (encryption, value High (mature security demagnetization) could be retrieved if card is technology from telecom) lost) Process view Obtainment Ticket office Ticket office Ticket office Internet Ticket vending Ticket vending machine Ticket vending machine machine Internet Internet Transaction None Transactions can not be Transactions can be viewed Transactions can be viewed viewed online on the mobile or online Payment can be incorporated into one single mobile bill Replenishment None Card can not be reloaded Card can be reloaded online Automatic replenishment Options are also available for automatic replenishment Usability Convenience Low (cumbersome Medium High (avoid ticket Very high (no additional card cash handling, purchasing) needed) requires exact change) Speed (boarding Slow Slow Fast, speed up journey Fast, speed up journey time) Personalization No No Yes Yes possibility articles of the PTOs that we studied. Because PTOs have variables of the three dimensions. The indices show a strong public roles, they cannot simply focus on revenue fair degree of variance from 0 to 6. Eight PTOs have a maximization. They need to satisfy customers and score between 0 and 3, and seven PTOs have a score politicians. Given the same increase in revenue and between 4 and 6. customer volume, a firm with a better reputation may be Table 4 summarizes the frequency distribution of the considered to be more successful than those with worse 17 PTOs by information capability, value creation reputations. Longevity is computed from the number strategy, and performance. of years since the introduction of the smart card, as stated on the service providers’ website. This measure is Analysis and results consistent with Soh et al. (2006). We computed an overall As suggested by the literature, we employed nonpara- performance index for each PTO by summing the metric statistics rather than inferential statistics to validate European Journal of Information Systems
- 10. Information capability and value creation strategy Ting Li et al 47 the propositions (Soh et al., 2006). Nonparametric Table 7 Validation of proposition 1 methods are preferable for three reasons. First, although Value creation strategy Information capability the number of selected cases is relatively small, we study the whole population of the large-scale smart card High Low adoptions in the public transport industry and thus do Mean rank 11.65 5.21 not need to make assumptions relating to the population Sum of ranks 116.50 36.50 distribution. Therefore, the distribution-free nature of the Count 10 7 nonparametric method is more appropriate for the Mann-Whitney U 8.50 analysis of the whole population than the small sample Wilcoxon W 36.50 size. Second, the ordinal scale of our construct measure- Test P-value** 0.006* ment calls for the use of a nonparametric method, which * Po0.01 (Higher rank indicates higher levels of value creation strategy). yields higher power than the corresponding parametric ** Significant level. tests. Third, rank-based nonparametric statistical tests are not affected by outliers (Hollander Wolfe, 1999), and hence are more suitable for the analysis of PTOs, where Table 8 Firm performance and value creation strategy outliers are common. For example, Octopus is a clear crosstabs outlier based on adoption rates and transaction volumes. Value creation strategy Total Baseline Price differentiation Service expansion Information capability Firm performance To operationalize the conceptual model, we first looked Low 6 2 0 8 at different types of mobile ticketing technologies used High 0 4 5 9 by PTOs. We then analyzed different data attributes of customer behavior information that could be obtained Total 6 6 5 17 through mobile ticketing systems. We summarized the differences among paper tickets, magnetic cards, smart cards, and mobile technologies based on the unique characteristics of product, process, and usability (see Information capability and value creation strategy Table 5). Next, we examined the different data attributes Our validation of proposition 1 suggests that IT that obtained by each mobile ticketing technology. We provides effective customer information allows PTOs to categorized them into different information dimensions develop advanced value creation strategies (i.e., price including service, purchasing, personal, temporal, and differentiation and service expansion). Table 6 shows spatial. We found that paper tickets include the most that nine out of 10 PTOs that have high information basic information on buying dimension (i.e., travel capability implemented revenue management strategy product purchase time/date, location, and price) and with price differentiation or service expansion. By service dimension (i.e., travel mode and vehicle type). contrast, five out of seven PTOs that have low informa- Additionally, magnetic cards can capture temporal di- tion capability used a baseline strategy. We used the mension information (i.e., time and date of departure). Mann-Whitney U test to examine the differences in value Furthermore, smart cards add a detailed personal dimen- creation strategy between high and low information sion (i.e., name, age, gender, address, and profession), capability. We tested against the null hypothesis of equal whereas mobile technology includes full spatial dimen- value creation strategy for both high and low informa- sional information (i.e., route and origin/destination) tion capability. We concluded that value creation strategy and permits PTOs to easily and precisely capture the full is significantly different across the information capability route and complete information of customer travel in the (P ¼ 0.006). Table 7 summarizes the results of our entire transportation networks. nonparametric tests. Table 6 Value creation strategy and information Value creation strategy and firm performance capability crosstabs Our validation of proposition 2 suggests that service providers are more likely to succeed with a value creation Information capability Total strategy of price differentiation or service expansion. Low High Table 8 shows that all high performance PTOs implement either price differentiation or service expansion. The fact Value creation strategy that two PTOs that use price differentiation are also low Access control 5 1 6 performers is not inconsistent with our argument. A good Price differentiation 2 4 6 strategy does not guarantee success – many other factors Service expansion 0 5 5 influence success. In contrast, none of the baseline PTOs Total 7 10 17 exhibited high performance. We validated proposition 2 using the same procedure used to validate proposition 1. European Journal of Information Systems
- 11. 48 Information capability and value creation strategy Ting Li et al Table 9 Validation of proposition 2 Firm performance Value creation strategy Value creation strategy Value creation strategy Baseline Price differentiation Baseline Service expansion Price differentiation Service expansion Mean rank 4.50 8.50 3.50 9.00 5.17 7.00 Sum of ranks 27.00 51.00 21.00 45.00 31.00 35.00 Count 6 6 6 5 6 6 Mann-Whitney U 6.00 0.00 10.00 Wilcoxon W 27.00 21.00 31.00 Test P-value 0.019* 0.002* 1.174 The main difference here is that we tested firm perfor- differentiation and/or service expansion strategies are mance across the three value creation strategies. We more likely to have higher performance gains compared concluded that PTOs that use price differentiation and to the ones that use only the baseline strategy. service expansion outperform those with baseline strate- As theorized in the revenue management literature gies (P ¼ 0.019 and 0.002). Table 9 summarizes the results (Talluri van Ryzin, 2004), the service providers that use of the pair-wise comparison using Mann-Whitney tests. price differentiation tend to achieve higher performance. Although ticketing systems are often seen as expensive Findings and discussion investments in infrastructure, they can improve PTOs’ access control and enhance their operational efficiency. Major findings and interpretations Further, the systems also provide improved information The empirical validation of our propositions leads to two on customer behavior, which creates an opportunity to major findings. optimize and individualize their service offerings. Im- Finding 1: Service providers that use more sophisti- proved products and service offerings can justify the cated mobile ticketing technologies (such as smart card investment premium. Our results suggest that the service and mobile technology) and have real-time and complete providers that use price differentiation and service information on customers’ actual travel, are more likely expansion strategy have a greater chance to be successful. to adopt price differentiation and service expansion strategy. Implications From a product, process, and usability viewpoint, we The findings of our study have several implications for examined the unique characteristics of three commonly- researchers and managers. For researchers, our study used mobile ticketing technologies and compared them proposed and empirically tested a model that encom- to paper tickets. Combined with the analysis of the data passes information capability, value creation strategy, and attributes captured by each technology, we observed firm performance. Past research has suggested that actual different levels of information capability among the usage may be an important link to IT value (Devaraj selected cases. When a ticketing system is implemented Kohli, 2003). However, this link has been missing in the by a PTO, the first goal is to reduce fare evasion and literature and much of the work has typically focused on achieve operational efficiency. When PTOs start using ‘adoption vs non-adoption’ (Zhu Kraemer, 2005; Zhu more advanced mobile ticketing technologies such as et al., 2006). Our model moves beyond the adoption smart cards or mobile devices, they are soon able to phase and accounts for the actual usage as a critical stage obtain more detailed individual customer behavior of value creation. As a result, we are able to better information. This information allows them to employ understand the post-adoption variations of mobile tick- price differentiation strategies. Further, because smart eting technology. cards and mobile devices move customers quickly through Further, in contrast to prior studies that have largely the payment process, they are particularly attractive to focused on revenue management practice in the airline retail segments where speed and convenience of payment industry, our study sheds light on the less understood are essential. The technology adoption in the public possibilities of revenue management in the public transport industry creates a large customer installed base; transport industry. Previously, PTOs had limited informa- this makes it easier for the service providers to expand into tion about their customers’ actual travel behavior and other markets. The empirical results provide strong limited ability to predict variable demand. As a result, support for proposition 1. It suggests that service providers revenue management was considered ‘nearly impossible’ that have a higher information capability are more likely for them. Our study examined the usage of mobile to use price differentiation and service expansion strate- ticketing technologies and explained how PTOs can gies, compared to the ones that have a lower information leverage these technologies to enable and advance their capability. revenue management practices. Finding 2: Service providers that adopt advanced For managers of firms in the public transport industry, mobile ticketing technologies and employ price the results underline the value of understanding how European Journal of Information Systems
- 12. Information capability and value creation strategy Ting Li et al 49 PTOs create value through the use of customer behavioral and service profile, among other considerations. These information. PTOs who seek and actively engage in limitations suggest avenues for further research: we offer exploring their information capability and employing some specific suggestions. The measures of key variables price differentiation and service expansion strategies are such as firm performance supplemented by objective more likely to succeed compared to the ones who only performance data could be much refined in the future use the baseline strategy. This difference in performance research by controlling for the characteristics and has important implications for revenue models, pricing commercial objectives of the service providers. Future structure, and the overall service operation strategies for research can conduct more in-depth interviews to find PTOs. More importantly, PTOs who can make better use out the evolution of smart card usage and value. of customers’ travel behavior information can adjust This study was motivated by the process-oriented view their products and services quickly and effectively, and of the business value of IT. It is grounded in the revenue improve their revenue and service operations. management literature and resource-based theory. It has Further, it is important for PTOs to recognize the theoretically developed and empirically evaluated a important role that customers play in their service research model that examines the use and impact of operations. The public transport industry is (partially) mobile ticketing technology and improved customer subsidized by government and has very strong social behavior information at the firm level. Using multiple responsibilities. The primary reasons for government to cases, this study investigates the value creation process of pay subsidies are to provide transport services to the mobile ticketing technologies and their enablement to public, alleviate congestion, reduce pollution, and pro- revenue management strategies. mote economic growth. Thus, there is a limit to how far This study shows that mobile ticketing technologies PTOs can practise revenue management. Instead of using have unique product, process, and usability character- a profit-maximization approach as many other industries istics compared with the traditional ticketing channel. do, PTOs are more likely to benefit from using a These technologies increase firms’ information capability customer-focused approach. On the one hand, they need in terms of both information quantity and information to pay special attention to the effects of price increase quality. It finds evidence that firms create value through and tariff structure adjustments, and the impacts of seat the use of mobile ticketing technologies in three ways. availability and service punctuality, which might lead to First, benefiting from the installed electronic gating crowding and discomfort. On the other hand, PTOs can infrastructure, mobile ticketing technologies reduce fare benefit from engaging in activities that improve custo- evasion, offer customer convenience, and reduce opera- mer satisfaction, for example designing and delivering tional costs. Second, the technologies enable firms to value added services to meet customer needs, such as real- collect more detailed customer information, which time travel information. increases firms’ abilities to design price and service differentiation strategies to create value. Third, mobile ticketing systems provide micro-payment infrastructures Future research and conclusion that permit other service providers to adopt them. As a This study makes several contributions to the IS literature result of this, service providers can increase their by examining the use of modern IT in the development transactional efficiencies and expand their services of revenue management. Nevertheless, the findings quickly into other industry sectors. should be evaluated in light of the limitations. First, the This study finds that service providers using more measures of revenue and customer volume as well as sophisticated mobile ticketing technologies and have reputation for performance impacts were subjective in real-time and complete information on customers’ actual the sense that we relied on the available data from press travel will also use price differentiation and service releases and news articles that were read by the authors. expansion strategy. Moreover, these providers have While we have been careful in assessing the potential relatively higher performance gains. Although we used biases inherently associated with such data, it would have the public transport industry as our research context, we been desirable to have more objective measures of perfor- acknowledge that in an exploratory sense, this study mance. Second, this study does not distinguish between indicates a potential model applicable across domains the operating environments of the service providers. It and which can be applied to companies that are could be that some service providers have more com- examining modern technologies to develop revenue mercial freedom compared to others, and this would lead management strategies. to a different (non)-profit-maximization agenda and operational boundaries. Further, we find that some performance effects cannot be explained by the choice Acknowledgements of value creation strategy. Some choices of value creation The authors thank the anonymous reviewers and associate strategy cannot be explained by the change in informa- editor of this journal and the conference participants of the tion capability. They may be driven by other competitive Academy of Management Meeting 2008 for their helpful considerations, including organizational capabilities, comments. The authors gratefully acknowledge support sophistication of competition, a firm’s chosen price, from Erasmus Research Institute of Management. European Journal of Information Systems
- 13. 50 Information capability and value creation strategy Ting Li et al About the authors Ting Li is an assistant professor of Decision and Management (ERIM) in Rotterdam. He conducts research Information Sciences at Rotterdam School of Manage- and teaches on the strategic and operational use ment Erasmus University, where she also received of information technologies for companies and markets. her Ph.D. Her main research interests include the E-mail: evanheck@rsm.nl strategic use of information technology, competitive Peter Vervest is a professor of business networks at the strategy and economics of information systems, pricing Rotterdam School of Management, Erasmus University, and revenue management, and business networks. and partner of D-Age, corporate counsellors and invest- E-mail: tli@rsm.nl ment managers for digital age companies (London – Eric van Heck is a professor of information management Amersfoort – Sunnyvale). His specific field of research and markets at the Department of Decision and Informa- concerns the development and application of enabling tion Sciences of RSM Erasmus University and director of technologies for smart business networks. E-mail: pvervest doctoral education at Erasmus Research Institute of @rsm.nl References BAKOS JY (1997) Reducing buyer search costs: implications for electronic EISENHARDT KM (1989) Building theories from case-study research. marketplaces. Management Science 43(12), 1676–1692. Academy of Management Review 14(4), 532–550. BARUA A, KONANA P, WHINSTON AB and YIN F (2004) An empirical investigation ELMAGHRABY W and KESKINOCAK P (2003) Dynamic pricing in the presence of net-enabled business value. MIS Quarterly 28(4), 585–620. of inventory considerations: research overview, current practices, and BENBASAT I, GOLDSTEIN D and MEAD M (1987) The case research future directions. Management Science 49(10), 1287–1309. strategy in studies of information systems. MIS Quarterly 11(3), FAIRBANK JF, LABIANCA GJ, STEENSMA HK and METTERS R (2006) Information 369–386. processing design choices, strategy, and risk management perfor- BERGEN ME, KAUFFMAN RJ and LEE D (2005) Beyond the hype of frictionless mance. Journal of Management Information Systems 23(1), 293–319. markets: evidence of heterogeneity in price rigidity on the Internet. GARROW LA, JONES SP and PARKER RA (2007) How much airline customers Journal of Management Information Systems 22(2), 57–89. are willing to pay: an analysis of price sensitivity in online distribution BHARADWAJ AS (2000) A resource-based perspective on information channels. Journal of Revenue and Pricing Management 5(4), 271–290. technology capability and firm performance: an empirical investiga- GERAGHTY MK and JOHNSON E (1997) Revenue management saves tion. MIS Quarterly 24(1), 169–196. national car rental. Interfaces 27(1), 107–127. BRYNJOLFSSON E and HITT L (1996) Paradox lost? Firm-level evidence on GURBAXANI V, MELVILLE N and KRAEMER K (2000) The production of the returns to information systems spending. Management Science information services: a firm-level analysis of information systems 42(4), 541–558. budgets. Information Systems Research 11(2), 159–176. BRYNJOLFSSON E and SMITH MD (2000) Frictionless commerce? HINTERHUBER A (2002) Value chain orchestration in action and the case A comparison of Internet and conventional retailers. Management of the global agrochemical industry. Long Range Planning 35(6), Science 46(4), 563–585. 615–635. CHAU PYK and POON S (2003) Octopus: an e-cash payment system HITT LM and BRYNJOLFSSON E (1996) Productivity, business profitability, success story. Communications of the ACM 46(9), 129–133. and consumer surplus: three different measures of information CLEMONS EK, HANN IH and HITT LM (2002) Price dispersion and technology value. MIS Quarterly 20(2), 121–142. differentiation in online travel: an empirical investigation. Management HOLLANDER M and WOLFE DA (1999) Nonparametric Statistical Methods. Science 48(4), 534–549. 2nd edn, Wiley-Interscience, New York. CLEMONS EK, REDDI SP and ROW MC (1993) The impact of information KAUFFMAN RJ and WOOD CA (2007) Follow the leader: price change technology on the organization of economic activity: the ‘move to the timing in Internet-based selling. Managerial and Decision Economics middle’ hypothesis. Journal of Management Information Systems 10(2), 28(7), 679–700. 9–35. KIMES SE (2001) A strategic approach to yield management. In Yield CLEMONS EK and ROW MC (1991) Sustaining IT advantage: the role of Management: Strategies for the Service Industries (INGOLD A, YEOMAN I and structural differences. MIS Quarterly 15(3), 275–292. MCMAHON U, Eds), International Thomson Business Press, London, UK. CROSS R (1997) Revenue Management: Hard-Core Tactics for Market LI SM and WONG FCL (1994) The effectiveness of differential pricing on Domination. Broadway Books, New York. route choice – the case of the mass-transit railway of Hong-Kong. DEVARAJ S and KOHLI R (2003) Performance impacts of information Transportation 21(3), 307–324. technology: is actual usage the missing link? Management Science LI T, VAN HECK E and FLEISCHMANN M (2007) Understanding Dynamic 49(3), 273–289. Pricing in Public Transport: The Role of Smart Card Technology DEWAN S and KRAEMER KL (2000) Information technology and productiv- Adoption. Academy of Management, Philadelphia, PA. ity: evidence from country-level data. Management Science 46(4), LINK H (2004) PEP – a yield-management scheme for rail passenger fares 548–562. in Germany. Japan Railway Transport Review 38, 50–55. DONSKY P (2006) MARTA plugs gap in new station gates. Atlanta Journal MCCARTNEY S (2000) Bag of high-tech tricks helps to keep airlines Constitution, February 2006, 4B. financially afloat. Wall Street Journal, January 20, A1. DULIBA KA, KAUFFMAN RJ and LUCAS HC (2001) Appropriating value from OH W and LUCAS HC (2006) Information technology and pricing computerized reservation system ownership in the airline industry. decisions: price adjustments in online computer markets. MIS Quarterly Organization Science 12(6), 702–728. 30(3), 755–775. EARL MJ (1989) Management Strategies for Information Technology. OLSEN C (2007) Getting the most out of EMV with contactless cards. Card Prentice Hall, New York. Technology Today 19(4), 10–11. EARL MJ (1992) Putting IT in its place: a polemic for the nineties. Journal of PIGOU AC (1932) The Economics of Welfare. Macmillan, London, UK. Information Technology 7, 100–108. PNG I (1999) Managerial Economics. Blackwell Publishers Inc., Oxford, UK. EGELHOFF WG (1982) Strategy and structure in multinational corpora- PORTER M (1980) Competitive Advantage. The Free Press, New York. tions: an information-processing approach. Administrative Science PORTER ME (1996) What is strategy. Harvard Business Review 74(6), Quarterly 27(3), 435–458. 61–78. European Journal of Information Systems
- 14. Information capability and value creation strategy Ting Li et al 51 POWELL TC and DENT-MICALLEF A (1997) Information technology as TUSHMAN ML and NADLER DA (1978) Information processing as an competitive advantage: the role of human, business, and technology integrating concept in organizational design. Academy of Management resources. Strategic Management Journal 18(5), 375–405. Review 3(3), 613–624. RIDDELL JM (2006) Adopting a customer view: moving from yielding to VAN RYZIN G (2005) Models of demand. Journal of Revenue and Pricing pricing. Journal of Revenue and Pricing Management 5(2), 167–169. Management 4(2), 204–210. SHUGAN SM (2004) The impact of advancing technology on marketing WEATHERFORD LR and BODILY SE (1992) A taxonomy and research overview and academic research. Marketing Science 23(4), 469–475. of perishable asset revenue management – yield management, SMITH BC, LEIMKUHLER JF and DARROW RM (1992) Yield management at overbooking, and pricing. Operations Research 40(5), 831–844. American-airlines. Interfaces 22(1), 8–31. WIKIPEDIA (2008) List of Smart Card. [WWW document] http://en. SOH C, MARKUS ML and GOH K (2006) Electronic marketplaces and price wikipedia.org/wiki/List_of_smart_cards (accessed 1 December 2008). transparency: strategy, information technology, and success. MIS YIN RK (2002) Case Study Research, Design and Methods. 3rd edn, Sage Quarterly 30(3), 705–723. Publications, Newbury Park, CA. SUICA (2008) Company website. [WWW document] http://www.jreast. ZHU K, DONG S, XU SX and KRAEMER KL (2006) Innovation diffusion in co.jp/suica/ (accessed 1 December 2008). global contexts: determinants of post-adoption digital transformation TALLURI K and VAN RYZIN GJ (2004) The Theory and Practice of Revenue of European companies. European Journal of Information Systems 15(6), Management. Kluwer Academic Publishers, Boston, MA. 601–616. TURBAN E and BRAHM J (2000) Smart card-based electronic card payment ZHU K and KRAEMER KL (2005) Post-adoption variations in usage and value systems in the transportation industry. Journal of Organizational of e-business by organizations: cross-country evidence from the retail Computing and Electronic Commerce 10(4), 281–293. industry. Information Systems Research 16(1), 61–84. European Journal of Information Systems