SlideShare a Scribd company logo
1 of 8
Download to read offline
Conjoint Analysis with Markov Chain Monte Carlo (MCMC) simulations
Esteban Ribero
The following report describes the results of a Discrete Choice Experiment (a type of conjoint
analysis) performed on behalf of Start Technologies (STC – a disguised electronics manufacturer) to
explore the potential configuration of a tablet computer to enter the highly coveted market established
originally by Pear computers and now covered by strong competitors such as Somesong, Gaggle and
Pear. Star Technologies commissioned a quantitative study that included a choice-based conjoint task
fulfilled by 424 respondents where they each evaluated 36 sets of 3 tablet configurations and selected
their preferred configuration among the three. A total of 108 configuration (36x3) were selected from a
potential set of 324 by combining levels of the following product attributes:
Table 1. Attributes and level for potential tablet configurations
Screen Size RAM Processor Price Brand
Levels
5 inches 8 Gigabytes 1.5 Gigahertz USD$199 STC
7 inches 16 Gigabytes 2.0 Gigahertz USD$299 Somesong
10 inches 32 Gigabytes 2.5 Gigahertz USD$399 Pear
Gaggle
Data preparation and modeling approach
To address strategic questions regarding the best possible configuration and potential
interaction between price and brand, as well as the potential effect of prior STC product ownership in
the preference for the tablet configurations, the data was prepared as a set of dummy variables for each
level of the product attributes. The data was coded using ‘Effect coding’ were the baseline configuration
is represented by (-1,-1) and the second and third level by (1,0) and (0,1) respectively for Screen Size,
RAM, Processor, and Price attributes; and as (-1,-1,-1) for STC, (1,0,0) for Somesong, (0,1,0) for Pear, and
(0,0,1) for Gaggle. This creates a Matrix of 108 rows x 11 columns, rows representing potential
configurations and columns the specific combination of attribute levels.
To explore the potential interaction effect between price and brand, three additional columns
were created by multiplying the brand columns with a continuous variable for the price centered on its
mean. The final X.matrix is then of dimensions 108 x 14. The respondents’ choice is coded as 1 for the
selected configuration and 0 otherwise. This mean that for each respondent there is a corresponding
X.matrix and a Y vector. Table 2 shows an example for the first 2 sets of three choices for 1 particular
respondent.
Table2. X.matrix with Corresponding Y vector for a sampled respondent.
We used a Hierarchical Multinomial Logistic Regression model and we fitted it using a Bayesian
approach with Markov Chain Monte Carlo (MCMC) simulations to simulate the posterior probabilities of
the part-worth utility of each attribute-level for each respondent in the sample. That is, we estimated
one model per individual hence the hierarchical nature of the model. We did this by running 100,000
simulations for each respondent and keeping the results of every 5 simulation to avoid autocorrelation.
This process ended up creating 20,000 draws of the posterior distribution for every of the 14 parameters
for each of the 424 respondents. Since the MCMC method used uses a Metropolis-Hasting algorithm (a
kind of random walk) the first set of simulations are of less quality before they converge around a stable
level. Figure 1 in the appendix, shows the scree plots for three respondents picked at random. To
identify the burn-in period and discard those first simulation, we took the most conservative estimate of
4,000 simulations. That is of the 20,000 draws for every parameter for every respondent we discarded
the first 4,000 and used the remaining 16,000 draws for analysis and interpretation.
The above process was repeated with a covariate, representing prior ownership of an STC
product, to identify the effects of STC ownership on the tablet configuration preferences. The covariate
was represented by a vector for each respondent with a 1 noting prior ownership and 0 otherwise. This
vector was then centered around its mean prior to being used in the simulation process. This would
allow us to compare the model with the covariate with the one without and without highlighting
differences when relevant.
This modeling approach described above is very powerful since we have one model per
respondent (two for those with prior STC ownership) and estimated posterior probabilities for every
parameter allowing us to drill down and extract useful insights. But it does not come without its
limitations. The most important being that we can simulate the probability of preference for any tablet
configuration as long as it is within the levels used in this study. That is, interpolation is perfectly valid
but extrapolation using new levels, say a new lower price of USD$99 or a new a screen size of 11 inches,
is not possible. Another important clarification is that the method used estimates the share of
preference for a configuration not the market share. That is, the method is only useful to estimate the
probability that a respondent would prefer a particular configuration vs. other probable configurations
among those possible from the 324 potential combinations, or vs not having a preference at all. Any
other external factor, such as distribution, advertising, other competitors in the market, etc. is not taken
into account and therefore the interpretation of the preferences is constrained to the context of the
study and should be used only as a guide to assist in the choice of configuration. Including
manufacturing cost and expected profits (not considered in this analysis) for each configuration should
also be considered to decide on the final tablet configuration to produce and introduce to the market.
Model validation
The overall accuracy of the model is good. Comparing the actual choices of the 424 respondents
with the predicted choices based on each individual model we get an overall accuracy of 88%.
The distribution of the accuracies for all respondents
can be seen in Figure 1. For more than 82% of
respondents the model performed above 80% accuracy
and for more than 55% of respondents the model
performed above 90% accuracy. The multi-class area
under the ROC curve (another accuracy metric) is 0.90.
The model including the STC product ownership
covariate only increases the overall accuracy by 0.1
percentage points. In fact, only 2 additional
respondents got an accuracy higher than 90% with the
covariate model. So, in tern of accuracy prior STC
product ownership does not seem to make a difference.
Model results and interpretation
Table 3 shows the average coefficients (part-worths) and odds of preference vs not preference (odds
ratio) across respondents for the model without product ownership covariate and the one with the
covariate. Figure 2 plots the part-worths for each model.
Table 3. Full model parameters (average across respondents) Figure 2. Part-worths
From these average models, it is clear that consumers respond negatively to a price of USD$399
and to a low processor speed of 1.5Gz. On the flip side a tablet with a price of USD$199 is quite
appealing. A high processing speed of 2.5Gz will also make the tablet very appealing, although the
difference between 2Gz and 2.5Gz is not as strong as the difference between 1.5Gz and 2Gz. A tablet
with a RAM 32G increases its appeal significantly, specially against one of only 8G. In terms of screen
size both 5” and 7” screens will detract appeal while one with 10” will increase its appeal. Brand don’t
seem to make much difference, although Gaggle and Somesong are less preferred than Pear and
surprisingly STC brand increases the appeal, more so than Pear. This is quite surprising and encouraging.
I will discuss price interaction and STC product ownership effects in more detail later. For now, let’s just
average
log(odds ratio)
average
odds ratio
average
log(odds ratio)
average
odds ratio
5" screen -0.2766 0.7584 -0.3011 0.7400
7" sceeen -0.1836 0.8323 -0.1712 0.8426
10" sceeen 0.4602 1.5843 0.4723 1.6037
RAM 8G -0.7051 0.4941 -0.7441 0.4752
RAM 16G 0.0853 1.0890 0.0782 1.0814
RAM 32G 0.6198 1.8586 0.6658 1.9461
Processor 1.5 Gz -2.2708 0.1032 -2.2747 0.1028
Processor 2 Gz 0.9837 2.6742 0.9800 2.6644
Processor 2.5 Gz 1.2871 3.6222 1.2948 3.6501
USD$199 2.3563 10.5514 2.5809 13.2086
USD$299 0.2789 1.3217 0.3124 1.3667
USD$399 -2.6352 0.0717 -2.8933 0.0554
STC 0.1480 1.1595 0.0935 1.0980
Somesong -0.2071 0.8129 -0.2602 0.7709
Pear 0.0591 1.0609 0.1667 1.1814
Gaggle -0.3171 0.7283 -0.2433 0.7841
STC*price -0.0699 0.9325 -0.1264 0.8812
Somesong*price 0.0280 1.0284 0.0734 1.0762
Pear*price 0.0420 1.0428 0.0530 1.0545
Gaggle*price 0.0270 1.0274 0.0429 1.0438
Without Covariate With Ownership Covariate
Figure 1. Histogram of model accuracies
say that price and brands don’t seem to interact very strongly and focus instead on the main effects of
the different attributes’ levels.
We don’t not need to do a study like this to know that consumers would prefer a tablet with the
most RAM possible, the highest processing speed available and at the lowest price available. But, off
course, there are tradeoffs in production and understanding the magnitude of the effect of the
attributes level in the preferences would better guide decision-making. One could arguably say that
before doing the study we would not have known that screen size would follow the same patterns as
RAM, processor speed, and price since different screen sizes may be valuable for different uses cases.
Someone concerned about the portability may in fact prefer a smaller screen size than a big one. For
another consumer legibility may be more important than portability and so a larger screen would be
preferable. However, as we described above, on average screen size does follow the same pattern than
RAM and processor speed where the larger the better. Yet again the magnitude of the effect would be
important to quantify.
Attribute importance
One way to start answering questions about magnitude of effects is by estimating the overall
importance of the different attribute relative to one another. To do this, one needs to estimate the
range of variation in part-worths between levels of each attribute and then divide that range by the sum
of all the ranges from all attributes. This would give us a percentage of importance by attribute. For
instance, for the lowest part-worth for price is -2.6352 (USD$399) and the highest is 2.3563 (USD$199).
The range for price is therefore 4.9915 part-worths. If we divide this by the sum of ranges across all
attributes (11.078) we end up with an attribute importance of 45%. That is quite high! Table 4 shows the
importance of each attribute for the model without covariate ranked by importance.
As can be seen, price is by far the most important attribute
accounting for almost half of the total utility space (part-worth
ranges). Processor speed follows with 32%, then RAM with 12%
Screen size with 7% and brand with 3%. This confirms what we
found from a visual inspection of figure 2 but provides a clear and
accurate way to compare attributes. The implications for product
development are high.
Try to avoid a price of USD$399 at all cost if enough preference is
desired for an introductory product from a new entrant to the category. Ideally try to keep price at
USD$199 for maximum appeal and play with other dimensions to control cost and maximize profit. For
instance, reducing the RAM or screen size may not have as big of an impact on utility as increasing price
or processor speed would. In fact, the importance of RAM is less than half of that of processor speed,
and screen size less than half RAM. The importance of the brand is quite small 3% and when including
the interaction with price 4%. This is somewhat surprising given the importance of brand reputation for
technologies like this one. However, all brands evaluated here are quite reputable and the difference
between them may not be strong enough to make this attribute more important. This is unfortunate
given that we found that the STC brand in fact increases the appeal of the tablet relative to the other
brands, even Pear (when STC product ownership is not considered).
parth-worths
range
Attribute
importance
Price 4.9915 45%
Processor Speed 3.5578 32%
RAM 1.3249 12%
Sceen size 0.7367 7%
Brand 0.3551 3%
Brand*Price 0.1119 1%
11.0780 100%
Table 4. Attribute importance.
Attribute sensitivity
To get a sense of the magnitude of the effects of changing the levels of attributes we can use
the part-worths utilities (log odds ratio) to evaluate the probability of preference between two levels of
an attribute. For instance, a tablet with the STC brand would be preferred 1.59 times more than one
from Gaggle. 0.1480-(-0.3171) = 0.4651. Exp(0.4651) = 1.5921. In other words, a tablet from STC is 60%
more likely to be preferred than one from Gaggle, all things being equal. This effect does not sound that
small now. Does it? However, when we compare the preference between a tablet of USD$199 and one
of USD$299, the cheaper one is 7.98 times more preferred. Now, compared to one at USD$399 the one
at USD$199 would be preferred 147 times more! That is massive! This clearly points at the sensitivity of
consumers to the price of the tablet. An increase of 50% in price from USD$199 to USD$299 would
reduce the probability of preference by 87.5%! 0.2789-2.3563 = -2.0773. Exp(-2.0773) = 0.1253.
Figure 3 shows the price sensitivity of respondents by
comparing the probability of preference of each price
level vs. the baseline of USD1$199. Notice that an
increase of ~100% in price from USD$199 to USD$399
would reduce the probability of preference to almost 0.
As stated before, there appears to be no strong
interaction between price and brand except for a
decrease in preference for STC when price goes up.
Similar sensitivity analysis can be done for each attribute
using simulation. Figure 4 shows the simulated
probability of preference of a tablet with the different
attribute levels vs. the best-case scenario for each attribute. In this case we are comparing each level of
an attribute vs. the level with the highest utility. This way all changes in preference are on a scale from 1
to 0. Think of it as the penalty we would incur by lowering down the specifications of the tablet from the
most ideal configuration.
Figure 4. Preference sensitivity per attribute.
Again, the sensitivity to price is the most evident one. Processor speed follows as the second
most sensitive attribute but notice the shape of the curve. The drop in preference from 2.5Gz to 2Gz is
only 25% vs. the one to 1.5 which brings the probability of preference to only 3%, a rapid and sharp
decline. This means than as long as we keep the Price to USD$199 we could still find an appealing
Figure 3. Price Sensitivity.
configuration with a Processor of 2Gz. RAM is the next most sensitive attribute with a more linear
decline per each level of RAM. However, the decline between RAM 32G and RAM16G is sharper than
the decline between Processor 2.5Gz and 2.Gz making us cautious about the downgrade from the ideal
configuration. The sensitivity to Screen size is not as strong between Screen 7’’ and screen 5’’ relative to
a 10’’ screen but be aware that there is a sharp decline in preference between 10” and its next 7” screen
version. This means that once you move away form a 10” screen it does not matter much if you go all
the way down to a 5” screen than to a 7” screen. Per my comment before, there might be different uses
cases for a tablet with a small screen for portability and one with a big screen for best experience and
legibility. So this could be a good opportunity to carve a space in the tablet market with a small but
powerful tablet optimized for portability and at an affordable price. This potential configuration might
be profitable enough (assuming significantly lower costs for a smaller screen) to be a good start in the
market.
Lastly the brand attribute is the least sensitive. The ranking of the brand has been done from the
most desirable one (STC) to the least (Gaggle). Again, this is very encouraging, but we would have to dig
deeper and research a bit more about this since there might be certain reasons why this is happening.
Assuming there are already models from Pear, Somesong and Gaggle in the market yet not one from
STC, consumers may not be making a fair comparison here and may be overly enthusiastic about a
Tablet from STC anticipating some type of feature associated with the brand. In fact, when looking at
the price and brand interactions we see some interesting albeit small effects. As the price increase the
preference for STC decreases. The reverse occurs for Pear. This suggest that consumers’ enthusiasm for
an STC tablet might be the expectation of a reliable and good quality product at an affordable price. The
moment affordability is out of the picture, consumers may be more inclined for a more premium and
stablished brand in the computer electronics market such as Pear. This only reinforces the
recommendation to keep the price of the first STC tablet to USD$199. Additionally, notice that the
model with the prior STC ownership covariate increases the sensitivity to price. The odds ratio for a
tablet at USD$199 is now 13.2 and for one at USD$399 is 0.05 vs 10.6 and 0.07 respectively for the
model without the covariate. This again might be due to prior owners’ expectations of products from
STC. However, it could also be that STC owners may be themselves more price sensitive overall (not just
about tablets) and so these respondents’ characteristic, not the fact that they have experience with STC
products, might be the one driving these effects.
Prior STC product ownership effects
One way to look at the effect of the covariate is to look at the
correlations between having prior ownership and the coefficients. Table
5 shows those correlations. Notice that the correlations are only strong
for price and brand. Prior STC ownership does reduce even further the
appeal of a highly pricey tablet while increases the appeal of a tablet
form Pear. This may be contradictory, assuming that Pear is the leading
and more premium brand, but it may signal a shift in brand expectations
for a tablet computer from those owing already a STC product. One
would have expected that prior STC ownership would increase the
appeal of a STC branded tablet given prior experience, but it may be the
opposite in fact: Consumers familiar with the STC brand may not easily
imagine a tablet from the same provider as their TV and audio remote
Correlation
7" sceeen 0.019
10" sceeen -0.094
RAM 16G 0.041
RAM 32G -0.042
Processor 2 Gz 0.120
Processor 2.5 Gz 0.289
USD$299 -0.017
USD$399 -0.824
Somesong -0.291
Pear 1.048
Gaggle -0.132
Somesong*price -0.186
Pear*price 0.083
Gaggle*price 0.171
STC product ownership and
part-worths utilities
Table 5. covariate effects.
controllers. More research would be needed in this area to fully understand these small but nuanced
effects.
Predicting preference shares
As can be seen from the analysis above, the average model is useful to get a better
understanding of the tradeoffs and main effects of the different attributes and their levels. However,
the true power of the approach uses is that we can go down at the respondent level models to get more
accurate predictions about the preference shared between a set of options. STC wanted to evaluate the
preference shares for the first two scenarios (two sets of three choices) shown in table 6. Three extra
scenarios were also evaluated. For completeness purposes, the estimated share for preference using the
average model is added but we should use the preference shares derived from the counts coming from
the individual models as if each respondent would have voted with their choice among the three
possible in each scenario. In the first set the 10’’ screen with RAM 16G and Processor 2Gz from Pear gets
40% of the preferences making it the winner. This is somewhat surprising since we saw a higher
sensitivity for RAM than for brands and a slight preference for STC than Pear in the average model.
However, what we are getting is a lower RAM
configuration with the Pear brand winning. This
leads us to believe that the average model obscures
some of the true effect of the brand and they may
carry a much higher importance than expected.
Scenario 2 confirms this intuition since the winner is
the most expensive of all the models with only a
small advantage in screen size, but it carries the Pear
brand. This is possible assuming that Pear is indeed
the leading brand and may carry a much higher
brand equity than shown by the average model.
Regardless, since we can only produce tablets under
the STC brand we can use scenarios 3, 4 and 5 to
narrow down our potential choices of configuration.
Recommended configuration
The entire analysis done so far and scenarios 3,4 and 5 in table 6 indicates that a 5”-screen with
RAM-16G and Processor-2.5 Gz at USD$199 can be a winning combination with a potentially
differentiated, highly powerful and portable tablet at an affordable price. Since production costs are not
taken into account here it would still be up for discussion if the difference in profits between a 5”-screen
RAM-32G Processor 2Gz-$199 and the recommended configuration is worth the loss of 3% points of
preference share (see scenario 4). Similarly, if the difference in profits between a 5”-screen RAM-32G
and a 7”-screen RAM-16 both with Processor 2Gz is substantial to lean towards one vs. the other given
that they both command a very similar preference share with only 1% point of difference. In short, the
above analysis gives us enough confidence to know that there is a winning configuration for an STC
tablet with a powerful processor (and/or RAM) at an affordable price. Smaller screen size may not only
be a practical way to reduce cost and increase profit but a strategic opportunity for a new entrant in the
market.
Table 6. Share of preference for extra
scenarios.
Average
model
scenario Screen RAM Processor Price Brand Counts % %
1 10" 8 2 $199 Gaggle 86 20% 7%
1 10" 32 2 $199 STC 158 37% 69%
1 10" 16 2 $199 Pear 180 42% 23%
2 5'' 8 1.5 $199 STC 103 24% 53%
2 5'' 16 1.5 $199 Gaggle 153 36% 47%
2 7'' 16 1.5 $399 Pear 168 40% 1%
3 10" 8 2 $199 STC 94 22% 36%
3 7'' 16 2 $199 STC 153 36% 12%
3 5'' 16 2.5 $199 STC 177 42% 52%
4 10" 8 2 $199 STC 110 26% 24%
4 5'' 32 2 $199 STC 148 35% 43%
4 5'' 16 2.5 $199 STC 162 38% 34%
5 7'' 8 2.5 $199 STC 88 21% 19%
5 7'' 16 2 $199 STC 172 41% 32%
5 5'' 32 2 $199 STC 168 40% 49%
Respondent
models
Tablet Configurations
preference share
Appendix
Exhibit A. Scree plots and burn-in period for respondents 1,10 and 100.

More Related Content

Similar to Conjoint analysis with mcmc

1100163YifanGuo
1100163YifanGuo1100163YifanGuo
1100163YifanGuoYifan Guo
 
Open06
Open06Open06
Open06butest
 
NON-STATIONARY BANDIT CHANGE DETECTION-BASED THOMPSON SAMPLING ALGORITHM
NON-STATIONARY BANDIT CHANGE DETECTION-BASED THOMPSON SAMPLING ALGORITHMNON-STATIONARY BANDIT CHANGE DETECTION-BASED THOMPSON SAMPLING ALGORITHM
NON-STATIONARY BANDIT CHANGE DETECTION-BASED THOMPSON SAMPLING ALGORITHMIRJET Journal
 
A02610104
A02610104A02610104
A02610104theijes
 
UcyQNFG8C16k.docx - Preparation of Ceria Fibers Via ...
UcyQNFG8C16k.docx - Preparation of Ceria Fibers Via ...UcyQNFG8C16k.docx - Preparation of Ceria Fibers Via ...
UcyQNFG8C16k.docx - Preparation of Ceria Fibers Via ...butest
 
SIMULATION-BASED OPTIMIZATION USING SIMULATED ANNEALING FOR OPTIMAL EQUIPMENT...
SIMULATION-BASED OPTIMIZATION USING SIMULATED ANNEALING FOR OPTIMAL EQUIPMENT...SIMULATION-BASED OPTIMIZATION USING SIMULATED ANNEALING FOR OPTIMAL EQUIPMENT...
SIMULATION-BASED OPTIMIZATION USING SIMULATED ANNEALING FOR OPTIMAL EQUIPMENT...Sudhendu Rai
 
L3 1b
L3 1bL3 1b
L3 1bNBER
 
Body in White - SAE
Body in White - SAEBody in White - SAE
Body in White - SAEJason Weber
 
laptop price prediction presentation
laptop price prediction presentationlaptop price prediction presentation
laptop price prediction presentationNeerajNishad4
 
Lecture 1: NBERMetrics
Lecture 1: NBERMetricsLecture 1: NBERMetrics
Lecture 1: NBERMetricsNBER
 
Statistics project2
Statistics project2Statistics project2
Statistics project2shri1984
 
Analysis of Common Supervised Learning Algorithms Through Application
Analysis of Common Supervised Learning Algorithms Through ApplicationAnalysis of Common Supervised Learning Algorithms Through Application
Analysis of Common Supervised Learning Algorithms Through Applicationaciijournal
 
ANALYSIS OF COMMON SUPERVISED LEARNING ALGORITHMS THROUGH APPLICATION
ANALYSIS OF COMMON SUPERVISED LEARNING ALGORITHMS THROUGH APPLICATIONANALYSIS OF COMMON SUPERVISED LEARNING ALGORITHMS THROUGH APPLICATION
ANALYSIS OF COMMON SUPERVISED LEARNING ALGORITHMS THROUGH APPLICATIONaciijournal
 
Enabling Value added Product (UTR) Rolling using Artificial Intelligence base...
Enabling Value added Product (UTR) Rolling using Artificial Intelligence base...Enabling Value added Product (UTR) Rolling using Artificial Intelligence base...
Enabling Value added Product (UTR) Rolling using Artificial Intelligence base...IRJET Journal
 
Data Science - Part V - Decision Trees & Random Forests
Data Science - Part V - Decision Trees & Random Forests Data Science - Part V - Decision Trees & Random Forests
Data Science - Part V - Decision Trees & Random Forests Derek Kane
 
Estimating Consumer Inertia in Repeated Choices of Smartphones (Lukasz Grzybo...
Estimating Consumer Inertia in Repeated Choices of Smartphones (Lukasz Grzybo...Estimating Consumer Inertia in Repeated Choices of Smartphones (Lukasz Grzybo...
Estimating Consumer Inertia in Repeated Choices of Smartphones (Lukasz Grzybo...FSR Communications and Media
 
Lect24-Efficient test suite mgt - IV.pptx
Lect24-Efficient test suite mgt - IV.pptxLect24-Efficient test suite mgt - IV.pptx
Lect24-Efficient test suite mgt - IV.pptxvijay518229
 

Similar to Conjoint analysis with mcmc (20)

1100163YifanGuo
1100163YifanGuo1100163YifanGuo
1100163YifanGuo
 
Open06
Open06Open06
Open06
 
NON-STATIONARY BANDIT CHANGE DETECTION-BASED THOMPSON SAMPLING ALGORITHM
NON-STATIONARY BANDIT CHANGE DETECTION-BASED THOMPSON SAMPLING ALGORITHMNON-STATIONARY BANDIT CHANGE DETECTION-BASED THOMPSON SAMPLING ALGORITHM
NON-STATIONARY BANDIT CHANGE DETECTION-BASED THOMPSON SAMPLING ALGORITHM
 
A02610104
A02610104A02610104
A02610104
 
DeMastryZ-SURE-SP14
DeMastryZ-SURE-SP14DeMastryZ-SURE-SP14
DeMastryZ-SURE-SP14
 
Mr6 pt10
Mr6 pt10Mr6 pt10
Mr6 pt10
 
UcyQNFG8C16k.docx - Preparation of Ceria Fibers Via ...
UcyQNFG8C16k.docx - Preparation of Ceria Fibers Via ...UcyQNFG8C16k.docx - Preparation of Ceria Fibers Via ...
UcyQNFG8C16k.docx - Preparation of Ceria Fibers Via ...
 
report
reportreport
report
 
SIMULATION-BASED OPTIMIZATION USING SIMULATED ANNEALING FOR OPTIMAL EQUIPMENT...
SIMULATION-BASED OPTIMIZATION USING SIMULATED ANNEALING FOR OPTIMAL EQUIPMENT...SIMULATION-BASED OPTIMIZATION USING SIMULATED ANNEALING FOR OPTIMAL EQUIPMENT...
SIMULATION-BASED OPTIMIZATION USING SIMULATED ANNEALING FOR OPTIMAL EQUIPMENT...
 
L3 1b
L3 1bL3 1b
L3 1b
 
Body in White - SAE
Body in White - SAEBody in White - SAE
Body in White - SAE
 
laptop price prediction presentation
laptop price prediction presentationlaptop price prediction presentation
laptop price prediction presentation
 
Lecture 1: NBERMetrics
Lecture 1: NBERMetricsLecture 1: NBERMetrics
Lecture 1: NBERMetrics
 
Statistics project2
Statistics project2Statistics project2
Statistics project2
 
Analysis of Common Supervised Learning Algorithms Through Application
Analysis of Common Supervised Learning Algorithms Through ApplicationAnalysis of Common Supervised Learning Algorithms Through Application
Analysis of Common Supervised Learning Algorithms Through Application
 
ANALYSIS OF COMMON SUPERVISED LEARNING ALGORITHMS THROUGH APPLICATION
ANALYSIS OF COMMON SUPERVISED LEARNING ALGORITHMS THROUGH APPLICATIONANALYSIS OF COMMON SUPERVISED LEARNING ALGORITHMS THROUGH APPLICATION
ANALYSIS OF COMMON SUPERVISED LEARNING ALGORITHMS THROUGH APPLICATION
 
Enabling Value added Product (UTR) Rolling using Artificial Intelligence base...
Enabling Value added Product (UTR) Rolling using Artificial Intelligence base...Enabling Value added Product (UTR) Rolling using Artificial Intelligence base...
Enabling Value added Product (UTR) Rolling using Artificial Intelligence base...
 
Data Science - Part V - Decision Trees & Random Forests
Data Science - Part V - Decision Trees & Random Forests Data Science - Part V - Decision Trees & Random Forests
Data Science - Part V - Decision Trees & Random Forests
 
Estimating Consumer Inertia in Repeated Choices of Smartphones (Lukasz Grzybo...
Estimating Consumer Inertia in Repeated Choices of Smartphones (Lukasz Grzybo...Estimating Consumer Inertia in Repeated Choices of Smartphones (Lukasz Grzybo...
Estimating Consumer Inertia in Repeated Choices of Smartphones (Lukasz Grzybo...
 
Lect24-Efficient test suite mgt - IV.pptx
Lect24-Efficient test suite mgt - IV.pptxLect24-Efficient test suite mgt - IV.pptx
Lect24-Efficient test suite mgt - IV.pptx
 

More from Esteban Ribero

Binary search query classifier
Binary search query classifierBinary search query classifier
Binary search query classifierEsteban Ribero
 
Campaign response modeling
Campaign response modelingCampaign response modeling
Campaign response modelingEsteban Ribero
 
Consumer Segmentation with Bayesian Statistics
Consumer Segmentation with Bayesian StatisticsConsumer Segmentation with Bayesian Statistics
Consumer Segmentation with Bayesian StatisticsEsteban Ribero
 
Modeling Sexual Selection with Agent-Based Models
Modeling Sexual Selection with Agent-Based ModelsModeling Sexual Selection with Agent-Based Models
Modeling Sexual Selection with Agent-Based ModelsEsteban Ribero
 
Brand Communications Modeling: Developing and Using Econometric Models in Adv...
Brand Communications Modeling: Developing and Using Econometric Models in Adv...Brand Communications Modeling: Developing and Using Econometric Models in Adv...
Brand Communications Modeling: Developing and Using Econometric Models in Adv...Esteban Ribero
 
ARF RE:THINK 2005. The Extension of The Concept of Brand to Cultural Event Ma...
ARF RE:THINK 2005. The Extension of The Concept of Brand to Cultural Event Ma...ARF RE:THINK 2005. The Extension of The Concept of Brand to Cultural Event Ma...
ARF RE:THINK 2005. The Extension of The Concept of Brand to Cultural Event Ma...Esteban Ribero
 
Is looking at consumers' brain the ultimate solution?
Is looking at consumers' brain the ultimate solution?Is looking at consumers' brain the ultimate solution?
Is looking at consumers' brain the ultimate solution?Esteban Ribero
 

More from Esteban Ribero (8)

Binary search query classifier
Binary search query classifierBinary search query classifier
Binary search query classifier
 
Campaign response modeling
Campaign response modelingCampaign response modeling
Campaign response modeling
 
Consumer Segmentation with Bayesian Statistics
Consumer Segmentation with Bayesian StatisticsConsumer Segmentation with Bayesian Statistics
Consumer Segmentation with Bayesian Statistics
 
Modeling Sexual Selection with Agent-Based Models
Modeling Sexual Selection with Agent-Based ModelsModeling Sexual Selection with Agent-Based Models
Modeling Sexual Selection with Agent-Based Models
 
The Learning Lab
The Learning LabThe Learning Lab
The Learning Lab
 
Brand Communications Modeling: Developing and Using Econometric Models in Adv...
Brand Communications Modeling: Developing and Using Econometric Models in Adv...Brand Communications Modeling: Developing and Using Econometric Models in Adv...
Brand Communications Modeling: Developing and Using Econometric Models in Adv...
 
ARF RE:THINK 2005. The Extension of The Concept of Brand to Cultural Event Ma...
ARF RE:THINK 2005. The Extension of The Concept of Brand to Cultural Event Ma...ARF RE:THINK 2005. The Extension of The Concept of Brand to Cultural Event Ma...
ARF RE:THINK 2005. The Extension of The Concept of Brand to Cultural Event Ma...
 
Is looking at consumers' brain the ultimate solution?
Is looking at consumers' brain the ultimate solution?Is looking at consumers' brain the ultimate solution?
Is looking at consumers' brain the ultimate solution?
 

Recently uploaded

VIP High Profile Call Girls Amravati Aarushi 8250192130 Independent Escort Se...
VIP High Profile Call Girls Amravati Aarushi 8250192130 Independent Escort Se...VIP High Profile Call Girls Amravati Aarushi 8250192130 Independent Escort Se...
VIP High Profile Call Girls Amravati Aarushi 8250192130 Independent Escort Se...Suhani Kapoor
 
Saket, (-DELHI )+91-9654467111-(=)CHEAP Call Girls in Escorts Service Saket C...
Saket, (-DELHI )+91-9654467111-(=)CHEAP Call Girls in Escorts Service Saket C...Saket, (-DELHI )+91-9654467111-(=)CHEAP Call Girls in Escorts Service Saket C...
Saket, (-DELHI )+91-9654467111-(=)CHEAP Call Girls in Escorts Service Saket C...Sapana Sha
 
Indian Call Girls in Abu Dhabi O5286O24O8 Call Girls in Abu Dhabi By Independ...
Indian Call Girls in Abu Dhabi O5286O24O8 Call Girls in Abu Dhabi By Independ...Indian Call Girls in Abu Dhabi O5286O24O8 Call Girls in Abu Dhabi By Independ...
Indian Call Girls in Abu Dhabi O5286O24O8 Call Girls in Abu Dhabi By Independ...dajasot375
 
High Class Call Girls Noida Sector 39 Aarushi 🔝8264348440🔝 Independent Escort...
High Class Call Girls Noida Sector 39 Aarushi 🔝8264348440🔝 Independent Escort...High Class Call Girls Noida Sector 39 Aarushi 🔝8264348440🔝 Independent Escort...
High Class Call Girls Noida Sector 39 Aarushi 🔝8264348440🔝 Independent Escort...soniya singh
 
Low Rate Call Girls Bhilai Anika 8250192130 Independent Escort Service Bhilai
Low Rate Call Girls Bhilai Anika 8250192130 Independent Escort Service BhilaiLow Rate Call Girls Bhilai Anika 8250192130 Independent Escort Service Bhilai
Low Rate Call Girls Bhilai Anika 8250192130 Independent Escort Service BhilaiSuhani Kapoor
 
From idea to production in a day – Leveraging Azure ML and Streamlit to build...
From idea to production in a day – Leveraging Azure ML and Streamlit to build...From idea to production in a day – Leveraging Azure ML and Streamlit to build...
From idea to production in a day – Leveraging Azure ML and Streamlit to build...Florian Roscheck
 
100-Concepts-of-AI by Anupama Kate .pptx
100-Concepts-of-AI by Anupama Kate .pptx100-Concepts-of-AI by Anupama Kate .pptx
100-Concepts-of-AI by Anupama Kate .pptxAnupama Kate
 
Industrialised data - the key to AI success.pdf
Industrialised data - the key to AI success.pdfIndustrialised data - the key to AI success.pdf
Industrialised data - the key to AI success.pdfLars Albertsson
 
VIP Call Girls in Amravati Aarohi 8250192130 Independent Escort Service Amravati
VIP Call Girls in Amravati Aarohi 8250192130 Independent Escort Service AmravatiVIP Call Girls in Amravati Aarohi 8250192130 Independent Escort Service Amravati
VIP Call Girls in Amravati Aarohi 8250192130 Independent Escort Service AmravatiSuhani Kapoor
 
Dubai Call Girls Wifey O52&786472 Call Girls Dubai
Dubai Call Girls Wifey O52&786472 Call Girls DubaiDubai Call Girls Wifey O52&786472 Call Girls Dubai
Dubai Call Girls Wifey O52&786472 Call Girls Dubaihf8803863
 
EMERCE - 2024 - AMSTERDAM - CROSS-PLATFORM TRACKING WITH GOOGLE ANALYTICS.pptx
EMERCE - 2024 - AMSTERDAM - CROSS-PLATFORM  TRACKING WITH GOOGLE ANALYTICS.pptxEMERCE - 2024 - AMSTERDAM - CROSS-PLATFORM  TRACKING WITH GOOGLE ANALYTICS.pptx
EMERCE - 2024 - AMSTERDAM - CROSS-PLATFORM TRACKING WITH GOOGLE ANALYTICS.pptxthyngster
 
VIP Call Girls Service Miyapur Hyderabad Call +91-8250192130
VIP Call Girls Service Miyapur Hyderabad Call +91-8250192130VIP Call Girls Service Miyapur Hyderabad Call +91-8250192130
VIP Call Girls Service Miyapur Hyderabad Call +91-8250192130Suhani Kapoor
 
Building on a FAIRly Strong Foundation to Connect Academic Research to Transl...
Building on a FAIRly Strong Foundation to Connect Academic Research to Transl...Building on a FAIRly Strong Foundation to Connect Academic Research to Transl...
Building on a FAIRly Strong Foundation to Connect Academic Research to Transl...Jack DiGiovanna
 
Customer Service Analytics - Make Sense of All Your Data.pptx
Customer Service Analytics - Make Sense of All Your Data.pptxCustomer Service Analytics - Make Sense of All Your Data.pptx
Customer Service Analytics - Make Sense of All Your Data.pptxEmmanuel Dauda
 
B2 Creative Industry Response Evaluation.docx
B2 Creative Industry Response Evaluation.docxB2 Creative Industry Response Evaluation.docx
B2 Creative Industry Response Evaluation.docxStephen266013
 

Recently uploaded (20)

꧁❤ Aerocity Call Girls Service Aerocity Delhi ❤꧂ 9999965857 ☎️ Hard And Sexy ...
꧁❤ Aerocity Call Girls Service Aerocity Delhi ❤꧂ 9999965857 ☎️ Hard And Sexy ...꧁❤ Aerocity Call Girls Service Aerocity Delhi ❤꧂ 9999965857 ☎️ Hard And Sexy ...
꧁❤ Aerocity Call Girls Service Aerocity Delhi ❤꧂ 9999965857 ☎️ Hard And Sexy ...
 
VIP High Profile Call Girls Amravati Aarushi 8250192130 Independent Escort Se...
VIP High Profile Call Girls Amravati Aarushi 8250192130 Independent Escort Se...VIP High Profile Call Girls Amravati Aarushi 8250192130 Independent Escort Se...
VIP High Profile Call Girls Amravati Aarushi 8250192130 Independent Escort Se...
 
Saket, (-DELHI )+91-9654467111-(=)CHEAP Call Girls in Escorts Service Saket C...
Saket, (-DELHI )+91-9654467111-(=)CHEAP Call Girls in Escorts Service Saket C...Saket, (-DELHI )+91-9654467111-(=)CHEAP Call Girls in Escorts Service Saket C...
Saket, (-DELHI )+91-9654467111-(=)CHEAP Call Girls in Escorts Service Saket C...
 
E-Commerce Order PredictionShraddha Kamble.pptx
E-Commerce Order PredictionShraddha Kamble.pptxE-Commerce Order PredictionShraddha Kamble.pptx
E-Commerce Order PredictionShraddha Kamble.pptx
 
Indian Call Girls in Abu Dhabi O5286O24O8 Call Girls in Abu Dhabi By Independ...
Indian Call Girls in Abu Dhabi O5286O24O8 Call Girls in Abu Dhabi By Independ...Indian Call Girls in Abu Dhabi O5286O24O8 Call Girls in Abu Dhabi By Independ...
Indian Call Girls in Abu Dhabi O5286O24O8 Call Girls in Abu Dhabi By Independ...
 
High Class Call Girls Noida Sector 39 Aarushi 🔝8264348440🔝 Independent Escort...
High Class Call Girls Noida Sector 39 Aarushi 🔝8264348440🔝 Independent Escort...High Class Call Girls Noida Sector 39 Aarushi 🔝8264348440🔝 Independent Escort...
High Class Call Girls Noida Sector 39 Aarushi 🔝8264348440🔝 Independent Escort...
 
Low Rate Call Girls Bhilai Anika 8250192130 Independent Escort Service Bhilai
Low Rate Call Girls Bhilai Anika 8250192130 Independent Escort Service BhilaiLow Rate Call Girls Bhilai Anika 8250192130 Independent Escort Service Bhilai
Low Rate Call Girls Bhilai Anika 8250192130 Independent Escort Service Bhilai
 
From idea to production in a day – Leveraging Azure ML and Streamlit to build...
From idea to production in a day – Leveraging Azure ML and Streamlit to build...From idea to production in a day – Leveraging Azure ML and Streamlit to build...
From idea to production in a day – Leveraging Azure ML and Streamlit to build...
 
100-Concepts-of-AI by Anupama Kate .pptx
100-Concepts-of-AI by Anupama Kate .pptx100-Concepts-of-AI by Anupama Kate .pptx
100-Concepts-of-AI by Anupama Kate .pptx
 
Delhi 99530 vip 56974 Genuine Escort Service Call Girls in Kishangarh
Delhi 99530 vip 56974 Genuine Escort Service Call Girls in  KishangarhDelhi 99530 vip 56974 Genuine Escort Service Call Girls in  Kishangarh
Delhi 99530 vip 56974 Genuine Escort Service Call Girls in Kishangarh
 
Industrialised data - the key to AI success.pdf
Industrialised data - the key to AI success.pdfIndustrialised data - the key to AI success.pdf
Industrialised data - the key to AI success.pdf
 
VIP Call Girls in Amravati Aarohi 8250192130 Independent Escort Service Amravati
VIP Call Girls in Amravati Aarohi 8250192130 Independent Escort Service AmravatiVIP Call Girls in Amravati Aarohi 8250192130 Independent Escort Service Amravati
VIP Call Girls in Amravati Aarohi 8250192130 Independent Escort Service Amravati
 
Dubai Call Girls Wifey O52&786472 Call Girls Dubai
Dubai Call Girls Wifey O52&786472 Call Girls DubaiDubai Call Girls Wifey O52&786472 Call Girls Dubai
Dubai Call Girls Wifey O52&786472 Call Girls Dubai
 
EMERCE - 2024 - AMSTERDAM - CROSS-PLATFORM TRACKING WITH GOOGLE ANALYTICS.pptx
EMERCE - 2024 - AMSTERDAM - CROSS-PLATFORM  TRACKING WITH GOOGLE ANALYTICS.pptxEMERCE - 2024 - AMSTERDAM - CROSS-PLATFORM  TRACKING WITH GOOGLE ANALYTICS.pptx
EMERCE - 2024 - AMSTERDAM - CROSS-PLATFORM TRACKING WITH GOOGLE ANALYTICS.pptx
 
VIP Call Girls Service Miyapur Hyderabad Call +91-8250192130
VIP Call Girls Service Miyapur Hyderabad Call +91-8250192130VIP Call Girls Service Miyapur Hyderabad Call +91-8250192130
VIP Call Girls Service Miyapur Hyderabad Call +91-8250192130
 
Building on a FAIRly Strong Foundation to Connect Academic Research to Transl...
Building on a FAIRly Strong Foundation to Connect Academic Research to Transl...Building on a FAIRly Strong Foundation to Connect Academic Research to Transl...
Building on a FAIRly Strong Foundation to Connect Academic Research to Transl...
 
Customer Service Analytics - Make Sense of All Your Data.pptx
Customer Service Analytics - Make Sense of All Your Data.pptxCustomer Service Analytics - Make Sense of All Your Data.pptx
Customer Service Analytics - Make Sense of All Your Data.pptx
 
B2 Creative Industry Response Evaluation.docx
B2 Creative Industry Response Evaluation.docxB2 Creative Industry Response Evaluation.docx
B2 Creative Industry Response Evaluation.docx
 
VIP Call Girls Service Charbagh { Lucknow Call Girls Service 9548273370 } Boo...
VIP Call Girls Service Charbagh { Lucknow Call Girls Service 9548273370 } Boo...VIP Call Girls Service Charbagh { Lucknow Call Girls Service 9548273370 } Boo...
VIP Call Girls Service Charbagh { Lucknow Call Girls Service 9548273370 } Boo...
 
Deep Generative Learning for All - The Gen AI Hype (Spring 2024)
Deep Generative Learning for All - The Gen AI Hype (Spring 2024)Deep Generative Learning for All - The Gen AI Hype (Spring 2024)
Deep Generative Learning for All - The Gen AI Hype (Spring 2024)
 

Conjoint analysis with mcmc

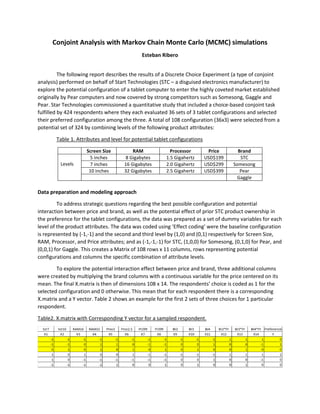
  • 1. Conjoint Analysis with Markov Chain Monte Carlo (MCMC) simulations Esteban Ribero The following report describes the results of a Discrete Choice Experiment (a type of conjoint analysis) performed on behalf of Start Technologies (STC – a disguised electronics manufacturer) to explore the potential configuration of a tablet computer to enter the highly coveted market established originally by Pear computers and now covered by strong competitors such as Somesong, Gaggle and Pear. Star Technologies commissioned a quantitative study that included a choice-based conjoint task fulfilled by 424 respondents where they each evaluated 36 sets of 3 tablet configurations and selected their preferred configuration among the three. A total of 108 configuration (36x3) were selected from a potential set of 324 by combining levels of the following product attributes: Table 1. Attributes and level for potential tablet configurations Screen Size RAM Processor Price Brand Levels 5 inches 8 Gigabytes 1.5 Gigahertz USD$199 STC 7 inches 16 Gigabytes 2.0 Gigahertz USD$299 Somesong 10 inches 32 Gigabytes 2.5 Gigahertz USD$399 Pear Gaggle Data preparation and modeling approach To address strategic questions regarding the best possible configuration and potential interaction between price and brand, as well as the potential effect of prior STC product ownership in the preference for the tablet configurations, the data was prepared as a set of dummy variables for each level of the product attributes. The data was coded using ‘Effect coding’ were the baseline configuration is represented by (-1,-1) and the second and third level by (1,0) and (0,1) respectively for Screen Size, RAM, Processor, and Price attributes; and as (-1,-1,-1) for STC, (1,0,0) for Somesong, (0,1,0) for Pear, and (0,0,1) for Gaggle. This creates a Matrix of 108 rows x 11 columns, rows representing potential configurations and columns the specific combination of attribute levels. To explore the potential interaction effect between price and brand, three additional columns were created by multiplying the brand columns with a continuous variable for the price centered on its mean. The final X.matrix is then of dimensions 108 x 14. The respondents’ choice is coded as 1 for the selected configuration and 0 otherwise. This mean that for each respondent there is a corresponding X.matrix and a Y vector. Table 2 shows an example for the first 2 sets of three choices for 1 particular respondent. Table2. X.matrix with Corresponding Y vector for a sampled respondent.
  • 2. We used a Hierarchical Multinomial Logistic Regression model and we fitted it using a Bayesian approach with Markov Chain Monte Carlo (MCMC) simulations to simulate the posterior probabilities of the part-worth utility of each attribute-level for each respondent in the sample. That is, we estimated one model per individual hence the hierarchical nature of the model. We did this by running 100,000 simulations for each respondent and keeping the results of every 5 simulation to avoid autocorrelation. This process ended up creating 20,000 draws of the posterior distribution for every of the 14 parameters for each of the 424 respondents. Since the MCMC method used uses a Metropolis-Hasting algorithm (a kind of random walk) the first set of simulations are of less quality before they converge around a stable level. Figure 1 in the appendix, shows the scree plots for three respondents picked at random. To identify the burn-in period and discard those first simulation, we took the most conservative estimate of 4,000 simulations. That is of the 20,000 draws for every parameter for every respondent we discarded the first 4,000 and used the remaining 16,000 draws for analysis and interpretation. The above process was repeated with a covariate, representing prior ownership of an STC product, to identify the effects of STC ownership on the tablet configuration preferences. The covariate was represented by a vector for each respondent with a 1 noting prior ownership and 0 otherwise. This vector was then centered around its mean prior to being used in the simulation process. This would allow us to compare the model with the covariate with the one without and without highlighting differences when relevant. This modeling approach described above is very powerful since we have one model per respondent (two for those with prior STC ownership) and estimated posterior probabilities for every parameter allowing us to drill down and extract useful insights. But it does not come without its limitations. The most important being that we can simulate the probability of preference for any tablet configuration as long as it is within the levels used in this study. That is, interpolation is perfectly valid but extrapolation using new levels, say a new lower price of USD$99 or a new a screen size of 11 inches, is not possible. Another important clarification is that the method used estimates the share of preference for a configuration not the market share. That is, the method is only useful to estimate the probability that a respondent would prefer a particular configuration vs. other probable configurations among those possible from the 324 potential combinations, or vs not having a preference at all. Any other external factor, such as distribution, advertising, other competitors in the market, etc. is not taken into account and therefore the interpretation of the preferences is constrained to the context of the study and should be used only as a guide to assist in the choice of configuration. Including manufacturing cost and expected profits (not considered in this analysis) for each configuration should also be considered to decide on the final tablet configuration to produce and introduce to the market. Model validation The overall accuracy of the model is good. Comparing the actual choices of the 424 respondents with the predicted choices based on each individual model we get an overall accuracy of 88%.
  • 3. The distribution of the accuracies for all respondents can be seen in Figure 1. For more than 82% of respondents the model performed above 80% accuracy and for more than 55% of respondents the model performed above 90% accuracy. The multi-class area under the ROC curve (another accuracy metric) is 0.90. The model including the STC product ownership covariate only increases the overall accuracy by 0.1 percentage points. In fact, only 2 additional respondents got an accuracy higher than 90% with the covariate model. So, in tern of accuracy prior STC product ownership does not seem to make a difference. Model results and interpretation Table 3 shows the average coefficients (part-worths) and odds of preference vs not preference (odds ratio) across respondents for the model without product ownership covariate and the one with the covariate. Figure 2 plots the part-worths for each model. Table 3. Full model parameters (average across respondents) Figure 2. Part-worths From these average models, it is clear that consumers respond negatively to a price of USD$399 and to a low processor speed of 1.5Gz. On the flip side a tablet with a price of USD$199 is quite appealing. A high processing speed of 2.5Gz will also make the tablet very appealing, although the difference between 2Gz and 2.5Gz is not as strong as the difference between 1.5Gz and 2Gz. A tablet with a RAM 32G increases its appeal significantly, specially against one of only 8G. In terms of screen size both 5” and 7” screens will detract appeal while one with 10” will increase its appeal. Brand don’t seem to make much difference, although Gaggle and Somesong are less preferred than Pear and surprisingly STC brand increases the appeal, more so than Pear. This is quite surprising and encouraging. I will discuss price interaction and STC product ownership effects in more detail later. For now, let’s just average log(odds ratio) average odds ratio average log(odds ratio) average odds ratio 5" screen -0.2766 0.7584 -0.3011 0.7400 7" sceeen -0.1836 0.8323 -0.1712 0.8426 10" sceeen 0.4602 1.5843 0.4723 1.6037 RAM 8G -0.7051 0.4941 -0.7441 0.4752 RAM 16G 0.0853 1.0890 0.0782 1.0814 RAM 32G 0.6198 1.8586 0.6658 1.9461 Processor 1.5 Gz -2.2708 0.1032 -2.2747 0.1028 Processor 2 Gz 0.9837 2.6742 0.9800 2.6644 Processor 2.5 Gz 1.2871 3.6222 1.2948 3.6501 USD$199 2.3563 10.5514 2.5809 13.2086 USD$299 0.2789 1.3217 0.3124 1.3667 USD$399 -2.6352 0.0717 -2.8933 0.0554 STC 0.1480 1.1595 0.0935 1.0980 Somesong -0.2071 0.8129 -0.2602 0.7709 Pear 0.0591 1.0609 0.1667 1.1814 Gaggle -0.3171 0.7283 -0.2433 0.7841 STC*price -0.0699 0.9325 -0.1264 0.8812 Somesong*price 0.0280 1.0284 0.0734 1.0762 Pear*price 0.0420 1.0428 0.0530 1.0545 Gaggle*price 0.0270 1.0274 0.0429 1.0438 Without Covariate With Ownership Covariate Figure 1. Histogram of model accuracies
  • 4. say that price and brands don’t seem to interact very strongly and focus instead on the main effects of the different attributes’ levels. We don’t not need to do a study like this to know that consumers would prefer a tablet with the most RAM possible, the highest processing speed available and at the lowest price available. But, off course, there are tradeoffs in production and understanding the magnitude of the effect of the attributes level in the preferences would better guide decision-making. One could arguably say that before doing the study we would not have known that screen size would follow the same patterns as RAM, processor speed, and price since different screen sizes may be valuable for different uses cases. Someone concerned about the portability may in fact prefer a smaller screen size than a big one. For another consumer legibility may be more important than portability and so a larger screen would be preferable. However, as we described above, on average screen size does follow the same pattern than RAM and processor speed where the larger the better. Yet again the magnitude of the effect would be important to quantify. Attribute importance One way to start answering questions about magnitude of effects is by estimating the overall importance of the different attribute relative to one another. To do this, one needs to estimate the range of variation in part-worths between levels of each attribute and then divide that range by the sum of all the ranges from all attributes. This would give us a percentage of importance by attribute. For instance, for the lowest part-worth for price is -2.6352 (USD$399) and the highest is 2.3563 (USD$199). The range for price is therefore 4.9915 part-worths. If we divide this by the sum of ranges across all attributes (11.078) we end up with an attribute importance of 45%. That is quite high! Table 4 shows the importance of each attribute for the model without covariate ranked by importance. As can be seen, price is by far the most important attribute accounting for almost half of the total utility space (part-worth ranges). Processor speed follows with 32%, then RAM with 12% Screen size with 7% and brand with 3%. This confirms what we found from a visual inspection of figure 2 but provides a clear and accurate way to compare attributes. The implications for product development are high. Try to avoid a price of USD$399 at all cost if enough preference is desired for an introductory product from a new entrant to the category. Ideally try to keep price at USD$199 for maximum appeal and play with other dimensions to control cost and maximize profit. For instance, reducing the RAM or screen size may not have as big of an impact on utility as increasing price or processor speed would. In fact, the importance of RAM is less than half of that of processor speed, and screen size less than half RAM. The importance of the brand is quite small 3% and when including the interaction with price 4%. This is somewhat surprising given the importance of brand reputation for technologies like this one. However, all brands evaluated here are quite reputable and the difference between them may not be strong enough to make this attribute more important. This is unfortunate given that we found that the STC brand in fact increases the appeal of the tablet relative to the other brands, even Pear (when STC product ownership is not considered). parth-worths range Attribute importance Price 4.9915 45% Processor Speed 3.5578 32% RAM 1.3249 12% Sceen size 0.7367 7% Brand 0.3551 3% Brand*Price 0.1119 1% 11.0780 100% Table 4. Attribute importance.
  • 5. Attribute sensitivity To get a sense of the magnitude of the effects of changing the levels of attributes we can use the part-worths utilities (log odds ratio) to evaluate the probability of preference between two levels of an attribute. For instance, a tablet with the STC brand would be preferred 1.59 times more than one from Gaggle. 0.1480-(-0.3171) = 0.4651. Exp(0.4651) = 1.5921. In other words, a tablet from STC is 60% more likely to be preferred than one from Gaggle, all things being equal. This effect does not sound that small now. Does it? However, when we compare the preference between a tablet of USD$199 and one of USD$299, the cheaper one is 7.98 times more preferred. Now, compared to one at USD$399 the one at USD$199 would be preferred 147 times more! That is massive! This clearly points at the sensitivity of consumers to the price of the tablet. An increase of 50% in price from USD$199 to USD$299 would reduce the probability of preference by 87.5%! 0.2789-2.3563 = -2.0773. Exp(-2.0773) = 0.1253. Figure 3 shows the price sensitivity of respondents by comparing the probability of preference of each price level vs. the baseline of USD1$199. Notice that an increase of ~100% in price from USD$199 to USD$399 would reduce the probability of preference to almost 0. As stated before, there appears to be no strong interaction between price and brand except for a decrease in preference for STC when price goes up. Similar sensitivity analysis can be done for each attribute using simulation. Figure 4 shows the simulated probability of preference of a tablet with the different attribute levels vs. the best-case scenario for each attribute. In this case we are comparing each level of an attribute vs. the level with the highest utility. This way all changes in preference are on a scale from 1 to 0. Think of it as the penalty we would incur by lowering down the specifications of the tablet from the most ideal configuration. Figure 4. Preference sensitivity per attribute. Again, the sensitivity to price is the most evident one. Processor speed follows as the second most sensitive attribute but notice the shape of the curve. The drop in preference from 2.5Gz to 2Gz is only 25% vs. the one to 1.5 which brings the probability of preference to only 3%, a rapid and sharp decline. This means than as long as we keep the Price to USD$199 we could still find an appealing Figure 3. Price Sensitivity.
  • 6. configuration with a Processor of 2Gz. RAM is the next most sensitive attribute with a more linear decline per each level of RAM. However, the decline between RAM 32G and RAM16G is sharper than the decline between Processor 2.5Gz and 2.Gz making us cautious about the downgrade from the ideal configuration. The sensitivity to Screen size is not as strong between Screen 7’’ and screen 5’’ relative to a 10’’ screen but be aware that there is a sharp decline in preference between 10” and its next 7” screen version. This means that once you move away form a 10” screen it does not matter much if you go all the way down to a 5” screen than to a 7” screen. Per my comment before, there might be different uses cases for a tablet with a small screen for portability and one with a big screen for best experience and legibility. So this could be a good opportunity to carve a space in the tablet market with a small but powerful tablet optimized for portability and at an affordable price. This potential configuration might be profitable enough (assuming significantly lower costs for a smaller screen) to be a good start in the market. Lastly the brand attribute is the least sensitive. The ranking of the brand has been done from the most desirable one (STC) to the least (Gaggle). Again, this is very encouraging, but we would have to dig deeper and research a bit more about this since there might be certain reasons why this is happening. Assuming there are already models from Pear, Somesong and Gaggle in the market yet not one from STC, consumers may not be making a fair comparison here and may be overly enthusiastic about a Tablet from STC anticipating some type of feature associated with the brand. In fact, when looking at the price and brand interactions we see some interesting albeit small effects. As the price increase the preference for STC decreases. The reverse occurs for Pear. This suggest that consumers’ enthusiasm for an STC tablet might be the expectation of a reliable and good quality product at an affordable price. The moment affordability is out of the picture, consumers may be more inclined for a more premium and stablished brand in the computer electronics market such as Pear. This only reinforces the recommendation to keep the price of the first STC tablet to USD$199. Additionally, notice that the model with the prior STC ownership covariate increases the sensitivity to price. The odds ratio for a tablet at USD$199 is now 13.2 and for one at USD$399 is 0.05 vs 10.6 and 0.07 respectively for the model without the covariate. This again might be due to prior owners’ expectations of products from STC. However, it could also be that STC owners may be themselves more price sensitive overall (not just about tablets) and so these respondents’ characteristic, not the fact that they have experience with STC products, might be the one driving these effects. Prior STC product ownership effects One way to look at the effect of the covariate is to look at the correlations between having prior ownership and the coefficients. Table 5 shows those correlations. Notice that the correlations are only strong for price and brand. Prior STC ownership does reduce even further the appeal of a highly pricey tablet while increases the appeal of a tablet form Pear. This may be contradictory, assuming that Pear is the leading and more premium brand, but it may signal a shift in brand expectations for a tablet computer from those owing already a STC product. One would have expected that prior STC ownership would increase the appeal of a STC branded tablet given prior experience, but it may be the opposite in fact: Consumers familiar with the STC brand may not easily imagine a tablet from the same provider as their TV and audio remote Correlation 7" sceeen 0.019 10" sceeen -0.094 RAM 16G 0.041 RAM 32G -0.042 Processor 2 Gz 0.120 Processor 2.5 Gz 0.289 USD$299 -0.017 USD$399 -0.824 Somesong -0.291 Pear 1.048 Gaggle -0.132 Somesong*price -0.186 Pear*price 0.083 Gaggle*price 0.171 STC product ownership and part-worths utilities Table 5. covariate effects.
  • 7. controllers. More research would be needed in this area to fully understand these small but nuanced effects. Predicting preference shares As can be seen from the analysis above, the average model is useful to get a better understanding of the tradeoffs and main effects of the different attributes and their levels. However, the true power of the approach uses is that we can go down at the respondent level models to get more accurate predictions about the preference shared between a set of options. STC wanted to evaluate the preference shares for the first two scenarios (two sets of three choices) shown in table 6. Three extra scenarios were also evaluated. For completeness purposes, the estimated share for preference using the average model is added but we should use the preference shares derived from the counts coming from the individual models as if each respondent would have voted with their choice among the three possible in each scenario. In the first set the 10’’ screen with RAM 16G and Processor 2Gz from Pear gets 40% of the preferences making it the winner. This is somewhat surprising since we saw a higher sensitivity for RAM than for brands and a slight preference for STC than Pear in the average model. However, what we are getting is a lower RAM configuration with the Pear brand winning. This leads us to believe that the average model obscures some of the true effect of the brand and they may carry a much higher importance than expected. Scenario 2 confirms this intuition since the winner is the most expensive of all the models with only a small advantage in screen size, but it carries the Pear brand. This is possible assuming that Pear is indeed the leading brand and may carry a much higher brand equity than shown by the average model. Regardless, since we can only produce tablets under the STC brand we can use scenarios 3, 4 and 5 to narrow down our potential choices of configuration. Recommended configuration The entire analysis done so far and scenarios 3,4 and 5 in table 6 indicates that a 5”-screen with RAM-16G and Processor-2.5 Gz at USD$199 can be a winning combination with a potentially differentiated, highly powerful and portable tablet at an affordable price. Since production costs are not taken into account here it would still be up for discussion if the difference in profits between a 5”-screen RAM-32G Processor 2Gz-$199 and the recommended configuration is worth the loss of 3% points of preference share (see scenario 4). Similarly, if the difference in profits between a 5”-screen RAM-32G and a 7”-screen RAM-16 both with Processor 2Gz is substantial to lean towards one vs. the other given that they both command a very similar preference share with only 1% point of difference. In short, the above analysis gives us enough confidence to know that there is a winning configuration for an STC tablet with a powerful processor (and/or RAM) at an affordable price. Smaller screen size may not only be a practical way to reduce cost and increase profit but a strategic opportunity for a new entrant in the market. Table 6. Share of preference for extra scenarios. Average model scenario Screen RAM Processor Price Brand Counts % % 1 10" 8 2 $199 Gaggle 86 20% 7% 1 10" 32 2 $199 STC 158 37% 69% 1 10" 16 2 $199 Pear 180 42% 23% 2 5'' 8 1.5 $199 STC 103 24% 53% 2 5'' 16 1.5 $199 Gaggle 153 36% 47% 2 7'' 16 1.5 $399 Pear 168 40% 1% 3 10" 8 2 $199 STC 94 22% 36% 3 7'' 16 2 $199 STC 153 36% 12% 3 5'' 16 2.5 $199 STC 177 42% 52% 4 10" 8 2 $199 STC 110 26% 24% 4 5'' 32 2 $199 STC 148 35% 43% 4 5'' 16 2.5 $199 STC 162 38% 34% 5 7'' 8 2.5 $199 STC 88 21% 19% 5 7'' 16 2 $199 STC 172 41% 32% 5 5'' 32 2 $199 STC 168 40% 49% Respondent models Tablet Configurations preference share
  • 8. Appendix Exhibit A. Scree plots and burn-in period for respondents 1,10 and 100.