SlideShare a Scribd company logo
1 of 13
Download to read offline
Slavery, education, and inequality
Graziella Bertocchi a,n
, Arcangelo Dimico b,1
a
University of Modena and Reggio Emilia, CEPR, CHILD and IZA, Dipartimento di Economia Marco Biagi, Viale Berengario, 51, I-41121
Modena, Italy
b
Queen's University Belfast, Management School, Riddel Hall 185, Sranmillis Rd, BT9 5EE Belfast, UK
a r t i c l e i n f o
Article history:
Received 28 September 2012
Accepted 4 April 2014
Available online 9 May 2014
JEL classification:
E02
D02
H52
J15
O11
Keywords:
Slavery
Inequality
Education
Institutions
a b s t r a c t
We investigate the effect of slavery on the current level of income inequality across US
counties. We find that a larger proportion of slaves over population in 1860 persistently
increases inequality, and in particular inequality across races. We also show that a crucial
channel of transmission from slavery to racial inequality is human capital accumulation,
i.e., current inequality is primarily influenced by slavery through the unequal educational
attainment of blacks and whites. Finally, we provide suggestive evidence that the
underlying links run through the political exclusion of former slaves and the resulting
negative influence on the local provision of education.
& 2014 Elsevier B.V. All rights reserved.
1. Introduction
Recent advances in growth theory have debated the long-run determinants of current comparative economic
performances. In this paper we address the same issue by investigating the legacy of slavery in the US. Our goal is to
assess if, nearly a century and a half after its abolition, this peculiar institution still exerts an influence on the American
economy and society. We are especially interested on its potential effect on current inequality. To concentrate on a single
country facilitates the empirical investigation on several grounds, since it reduces the risk of omitted variable bias that
typically plagues cross-country investigations. At the same time, because of their size and history, the US still presents
sufficient variations along both the geographic and the institutional dimensions to make such investigation worthwhile.
Slavery was introduced in North America as early as in the sixteenth century and its diffusion escalated throughout the
next centuries. Overall, the Middle Passage brought an estimated 645,000 slaves, mostly from Africa, to the territories that
today represent the US. Initially most of the slaves were forcibly settled in the coastal Southern colonies, where they were
employed primarily in agriculture. Later, between the American Revolution and the Civil War, with the Second Middle
Passage around a million slaves were relocated toward the inland regions where the plantation economy was developing
(Berlin, 2003). By the 1860 Census the US slave population had grown to four million, to represent about 13% of the entire
Contents lists available at ScienceDirect
journal homepage: www.elsevier.com/locate/eer
European Economic Review
http://dx.doi.org/10.1016/j.euroecorev.2014.04.007
0014-2921/& 2014 Elsevier B.V. All rights reserved.
n
Corresponding author. Tel.: þ39 059 2056856.
E-mail addresses: graziella.bertocchi@unimore.it (G. Bertocchi), arcangelo_dimico@hotmail.it (A. Dimico).
URL: http://www.economia.unimore.it/bertocchi_graziella (G. Bertocchi).
1
Tel.:þ44 2890974167.
European Economic Review 70 (2014) 197–209
population, distributed within 15 slave states, mostly in the South. In the same year, almost 90% of the blacks living in the US
were slaves. The American Civil War led to the abolition of slavery in 1865.
We measure the historical legacy of slavery with the share of slaves over population in 1860 and we find that the current
level of income inequality is indeed shaped by it, since the distribution of per capita income is more unequal today in
counties associated in the past with a larger proportion of slaves in the population. Moreover, we show that past slavery
affects the racial component of inequality, while it is not associated with higher inequality within each race.
To investigate the mechanism through which slavery determines current racial inequality, we compare two alternative
channels: human capital transmission and racial discrimination. To be noticed is that, at least in principle, these two
channels are not mutually exclusive since, as suggested by Sokoloff and Engerman (2000) and Acemoglu et al. (2008a,b),
institutional and economic development paths may be interlinked and jointly determined by various factors. For instance,
the institution of public schooling, which has been a major vehicle of capital accumulation, may have been more rapid and
more effective in the same counties which were less exposed to de facto and de jure discrimination.
In evaluating the human capital transmission mechanism, we test the hypothesis that the long-term influence of slavery
may run through its negative impact on the educational attainment of blacks relative to those of whites. According to this
hypothesis, which is closely associated with Smith (1984) and the literature on race and human capital, the counties more
affected by slavery should be associated with worse educational attainment for the black population. For a cross section of
counties, our empirical investigation does support this hypothesis.
The second channel of transmission we test is motivated by those racial discrimination theories which have emphasized
racial differences in the value of skills. Racial discrimination can manifest itself on the schooling dimension, through worse
quantity and quality of the education publicly provided, or directly on the labor market, by denying blacks access to certain
jobs (see Smith, 1984). We find that the evidence supporting the relevance of this second potential channel of transmission
is much weaker than that collected for the first channel.
Our empirical findings are confirmed after robustness checks involving other potential confounding factors such as factor
endowments, IV estimation, and quasi-experimental evidence.
We complete our investigation with a series of reduced forms illustrated by scatter plots which further explore the
underlying mechanisms linking slavery to local politics, and in turn to education policies and the resulting racial gap in
education. The resulting evidence, together with our previous results, supports the following theory. Slave counties have
been persistently characterized by restricted political participation achieved both through de jure and de facto methods. The
political exclusion of former slaves resulted in a limited supply of education since, being education locally administered and
financed, political exclusion implied undertaxation and reduced funding.
Our empirical implementation of the concept of slavery involves the fraction of slaves over population in 1860, which
reflects the intensity of the diffusion of this specific form of work organization together with its influence on local
institutions. The long-term legacy of slavery can also run through institutional differences, such as national or state-level
institutions aimed at protecting property rights in human labor and the associated balance of political power, which may be
influential even in the presence of small fractions of slaves even though it should be eliminated by state fixed effects.
Despite controlling for de-jure institutional differences using state dummies, we do find the same effect on racial inequality
even when we control for the slave share measured in 1800, at a time when small fractions of slaves were still present in
some Northern states. We interpret these results as supportive of our empirical strategy.
The rest of the paper is organized as follows. In Section 2 we discuss the relevant literature. In Section 3 we examine the
effect of slavery on inequality. In Section 4 we explore the channels through which this effect materializes. Section 5 is
devoted to a quasi experiment and Section 6 to the reduced-form evidence. In Section 7 we derive our conclusions.
2. Related literature
The historiography of slavery in North America is huge. Economic historians have focused on the profitability and the
efficiency of slavery. In their provocative and controversial empirical work on the antebellum South, Fogel and Engerman
(1974) suggested that slavery was both productive and economically efficient, a conclusion which was criticized, among
others, by David and Stampp (1976) and Ransom and Sutch (2001). Lagerlöf (2009) and Acemoglu and Wolitzky (2011)
model the economics of labor coercion from a related perspective.
Since our goal is to establish whether slavery can be viewed as a deep determinant of long-run development, we contribute to
the research line, initiated by Hall and Jones (1999), which has searched for fundamental, rather than proximate, growth factors.
Other authors have already focused on the long-term legacy of slavery, in a number of dimensions. While Nunn (2008a) has
examined the implications of slave trades in Africa, Engerman and Sokoloff (2005a) and Nunn (2008b) have looked at the impact
of slavery in the receiving countries. In particular, on the basis of historical evidence, the former formulate the hypothesis that
factor endowments, through large-plantation slavery and other inequality-perpetuating institutions, may have hampered
subsequent economic growth. The latter estimates the influence of slavery on the current performances of the US economy at the
county level, to find that slave use is negatively correlated with subsequent economic development, but that this relationship is
not driven by large-scale plantation slavery, i.e., a more precise measure of factor endowments. He also finds a positive impact of
slavery on 1860 land inequality, which is in turn correlated with current income inequality, but no impact of 1860 land inequality
on current income, which suggests that inequality may not be the channel of influence running from factor endowments to the
current level of development. Mitchener and McLean (2003) find that the legacy of slavery has a strong and persistent effect on
G. Bertocchi, A. Dimico / European Economic Review 70 (2014) 197–209198
productivity levels, measured as income per worker, across US states in the 1880–1980 period. Lagerlöf (2005) explores the link
between geography and slavery and also documents a negative relationship between slavery and current income at the county
level for a sample of former slave states. A common conclusion for this stream of the literature is a negative relationship between
past slavery and current income per capita across the US states and counties, even though Bertocchi and Dimico (2010) find that
this relationship is not robust after controlling for structural differences among the US states and regions. More generally,
economic historians have documented how, despite a decline in the immediate aftermath of the Civil War,2
from the mid‐1870s
per capita income in the South started to converge to that of the rest of the country, with an acceleration after WW2. The
abolition of the Jim Crow Laws in 1964–1965 may have contributed to the process by improving blacks' schooling, skills,
occupations, employment rate, and therefore possibly productivity (see Margo, 1990). Indeed Donohue and Heckman (1991) find
that governmental anti-discrimination efforts, starting with the 1964 Civil Rights Act, had a substantial impact on the economic
status of blacks.3
A separate research line, which is more relevant to our goal, has focused on the impact of race on inequality. This work has
documented that, since emancipation and especially since 1940, the average income of black Americans has increased greatly, both
in absolute and relative terms. The determinants of the relative improvement of the economic status of blacks after WWII, however,
have been the subject of debate. Both the civil rights movement, with its impact on the labor market through affirmative action
laws, and long-term changes in human capital have been advanced as possible explanations of the observed trend (Heckman, 1990;
Margo, 1990). The main contributions to the line of research on race and human capital are Smith (1984) and Smith and Welch
(1989), followed by Margo (1990) and Collins and Margo (2006).4
The evidence collected by these authors documents the evolution
of racial differences both in the quality and the quantity of education. After the Civil War, African-Americans had essentially no
exposure to formal schooling, as a legacy of the extremely high rates of illiteracy that existed under slavery. The first generations of
former slaves were able to complete far fewer years of schooling, on average, than whites and they had access to racially segregated
public schools, mostly in the South, where they received a qualitatively inferior education, even if compared to that received by
Southern whites.5
Initially the combination of low educational attainment and inferior educational quality determined the
persistence of large wage and income gaps. Subsequently, however, the racial schooling gap declined, as successive generations of
black children received more and better schooling, with an eventual impact on earnings. Overall, despite the initial conditions and
the persistence of discrimination, the reported evidence on the evolution of educational differences, in a wide number of
dimensions (such as literacy rates, years of educational attainment, spending per pupil, and returns to literacy), overwhelmingly
points to long-term convergence.6
3. Slavery and inequality
According to the Engerman and Sokoloff hypothesis, the initial presence of specific factor endowments explains the
development of agricultural production techniques based on slave labor, which in turn resulted in extreme economic
inequality and in a set of political (Engerman and Sokoloff, 2005b), redistributive (Sokoloff and Zolt, 2007), and educational
(Mariscal and Sokoloff, 2000) institutions that reflected this inequality. The link between factor endowments and inequality
is also empirically documented. Galor et al. (2009) find evidence that land inequality – which can proxy for factor
endowments – adversely affected the emergence of human capital promoting institutions, as measured by educational
expenditure across US states in the 1900–1940 period. Vollrath (2013) documents a negative effect of inequality on property
tax revenues in 1890. Ramcharan (2010) tests the relationship between land inequality and redistribution and uncovers a
significant effect of land inequality on redistributive policies in the 1890–1930 period. Over a cross section of slave counties,
Lagerlöf (2005) finds that counties which in 1850 had a larger slave population display higher racial inequality today.
However, the link between slavery and current economic and racial inequality still remains unclear. The channel through
which this link may have worked is also poorly understood.
Given this state of the art, we investigate the long-run effects of slavery on inequality using a sample of US counties (at
1860 boundaries) distributed across 42 states, including 15 slave states. The share of slaves over population in 1860 varies
considerably, both across and within states.7
It is highest in South Carolina and Louisiana (at about 55 percent, respectively)
and lowest in Delaware and Missouri (at about 2 and 8 percent, respectively).
In order to measure inequality, we use a Theil decomposition to decompose the level of income inequality at a county
level into two components: inequality across races (between inequality, or racial inequality) and inequality within races
2
See for example Fogel and Engerman (1974) and Ransom and Sutch (2001). Irwin (1994) shows that the decline in labor productivity in the South was
positively correlated with the extent of slavery before the Civil War. Evidence of a catch-up between North and South is also presented by Caselli and
Coleman (2001).
3
Acemoglu and Robinson (2008) suggest that, at least initially, the impact of the abolition of slavery on the Southern economy was limited by the fact
that, after the Civil War, the landed elites managed to maintain economic institutions based on low-skilled, repressed labor through the exercise of de facto
political power.
4
See also Goldin and Margo (1992), Goldin (1998), and Goldin and Katz (1999).
5
Naidu (2010) estimates the effect of the nineteenth century disenfranchisement laws for blacks in the South and finds that they are associated with a
fall in black educational inputs and thus with low-quality Southern schooling. Bertocchi and Dimico (2012b) find that black disenfranchisement negatively
affects black education over a sample of Mississippi counties.
6
A related stream of the literature has measured the long-term influence of family background. See for example Cameron and Heckman (2001) and
Sacerdote (2005).
7
See Table A1 in Table Appendix and the Data Appendix for data sources.
G. Bertocchi, A. Dimico / European Economic Review 70 (2014) 197–209 199
(within inequality).8
Theoretically one should expect a positive effect of slavery on overall inequality, running through
inequality across races, since blacks are likely to be confined at the bottom of the income distribution. On the other hand the
effect of slavery on within inequality is a priori less clear-cut. While it is likely that there is no effect on income distribution
among blacks (for the same reason as above), the effect of slavery on inequality among whites is likely to be more complex.
One can expect a positive effect if slavery has contributed to establish a small white elite (former slaveholders) who has
preserved its wealth and power over time. On the other hand the effect is likely to be insignificant if political and economic
structural changes have washed out such privileges. As a result the overall effect is potentially ambiguous.9
Following Acemoglu et al. (2002) and Nunn (2008b) we also control for population density in 1860 as a proxy for initial
prosperity. To be noticed, however, is that our goal is to investigate whether slavery can be viewed as a fundamental, deep
determinant of inequality over the long run. Thus, we employ the most parsimonious possible specification, where
proximate factors, such as migration, etc. are omitted (see Hall and Jones, 1999).10
In Table 1 we test the relationship between slavery and the current level of overall, between and within income
inequality. All specifications include a full set of state dummies. In Model 1 we find that slavery has a positive and significant
effect on overall inequality. The effect is economically significant, with an increase in inequality of 0.045 per a 1 percent
increase in the share of slaves. In Model 2 we look at inequality between races: the coefficient on slavery is almost
unchanged and significant at a 1 percent level. Finally in the Model 3 we look at the effect of slavery on inequality within
races and we find it is not significant.11
The long-term influence of slavery can also run through institutional differences such as de jure institutions aimed at protecting
property rights in humans.12
The influence of these factors may be powerful even in the presence of small fractions of slaves even
though it should be eliminated by state fixed effects. In turn the intensity of slavery, as a form of work organization shaping social
and institutional relations, is more likely to reflect the effect of de facto institutions which, according to Key (1964), should be more
binding in counties with a larger share of slaves.13
To gain further insight into the relevance of our empirical implementation of the
concept of slavery, in the specifications shown in Table 1 we substitute the slave share in 1860 with the slave share in 1800, i.e.,
measured at a time when several Northern states still had small fractions of slaves. The results from this specification (which we do
not report for brevity) still show a significant effect of the slave share on racial inequality, while the effect on within inequality
becomes significantly negative and makes the effect on overall inequality insignificant.14
Engerman and Sokoloff (1997, 2005a) have influentially argued that the diffusion of agricultural crops best suited for the
employment of slave labor is determined by factor endowments, such as soils, climate, etc., best suited to large-scale plantations.
The resulting unequal structure of society has in turn contributed to the evolution of a set of legal, political, and educational
institutions meant to preserve the privileges of the elites, which have exerted a persistent impact on economic outcomes long after
the abolition of slavery, by determining paths of development characterized by marked inequalities. If this theory is verified, the
influence of the legal institution of slavery would come from its association with factor endowments.15
In our context, the latter
could be proxied by land inequality, which should in turn reflect the diffusion of those crops that were typical of large-scale
plantations and thus of the use of slave labor. To control for this potential historical confound, we construct an index of land
inequality similar to the one employed by Lagerlöf (2005), Nunn (2008b), and Galor et al. (2009).16
It is reasonable to expect that,
within counties with a prevalence of large-scale plantations and therefore large land inequality, income inequality in mid-
nineteenth century was higher, because of the presence of a small white elite and a large share of poor blacks. This in turn implied,
in those days, a larger degree of inequality between blacks and whites (Nunn, 2008b). This initial racial inequality may have
persisted until the present day and contributed to the higher overall economic inequality, as suggested by our previous results.
In Table 2 we insert controls for factor endowments. In Models 1–3 we add the index of land inequality in 1860 to the
specifications of Table 1. In Model 1 we find a marginal effect of land inequality on the overall level of inequality in 2000.
However, this hardly impacts on the coefficient of the slave share variable. In addition, as Model 3 shows, the marginal effect
8
The decomposition is obtained using the Stata plug in program INEQDECO by Jenkins (1999).
9
Note that the sample represents existing counties in 1860. In these counties whites and blacks together still represent more than 95% of the total
population. As a result inequality between races largely captures the difference between whites and blacks.
10
The cross-county correlation between the fraction of slaves in 1860 and the fraction of blacks in 2000 is 0.80. Therefore, despite the massive
relocation of blacks from the rural South to the urban North, race and past slavery still appear closely related. In the 1970s there was actually a reversal of
black migration flows due to employment and integration opportunities in the South (Ashenfelter and Heckman, 1976).
11
We also experiment with a quadratic form on the share of slaves in 1860. Its effect on racial inequality, which is our main focus, is only marginally
significant and still positive. Therefore we retain a linear form in the following models.
12
Einhorn (2002) discusses the links between the US property law and slave property law.
13
Wright (2006) draws a similar distinction between slavery as a form of work organization and slavery as a set of property rights.
14
To verify whether the effect of the slave share on inequality vanishes after accounting for a proxy of current racism, we also add a control for the
share of black population in 2000 (as in Lagerlöf, 2005). Despite the fact that the new variable exhibits a positive coefficient on racial inequality, the effect
of slavery is confirmed, suggesting that the legacy of slavery may persist through other channels other than racism. See Morgan (1975) for a discussion on
the development of slavery and the emergence of racism in colonial Virginia.
15
The direct link between endowments and slavery, where the former are measured by temperature, elevation, and precipitation, has been examined
for the US by Lagerlöf (2005).
16
Consistently with the literature the index reflects the size, rather than the value, of land holdings and is calculated using information about the size
of each farm (1860 Census). Sizes of farms fall in the following ranges: (1) 9 acres or less, (2) 10–19 acres, (3) 20–49 acres, (4) 50–99 acres, (5) 100–499
acres, (6) 500–999 acres, and (7) 1000 acres or more. We assume that farms are uniformly distributed within each category and for the category of 1000
acres or more we use 1000 acres.
G. Bertocchi, A. Dimico / European Economic Review 70 (2014) 197–209200
of land inequality on overall inequality is likely to be related to the effect on inequality within races, since there is no effect
of land inequality on inequality between races (Model 2). Therefore, although land inequality and slavery are statistically
associated their effects on current overall inequality run through different channels.17
Similar results (in regressions which
we do not report for brevity) are obtained using alternative measures of inequality in 1860 which are constructed using data
on household wealth and the value of real estate holdings from IPUMS. Both controls exert a significant effect on current
racial inequality but they hardly affect the coefficient on the share of slaves in 1860.
In Models 4–6 of Table 2 we also control for latitude and longitude, which largely explain climatic differences within the
US, and for a proxy of soil neutrality (pH) collected from the Harmonized World Soil Database (FAO GeoNetwork). Climate
and soil quality should largely determine the crops produced in an area providing a deeper control for crops suitability. The
impact of the share of slaves is hardly affected despite a significant effect of latitude on all measures of inequality and a
marginal effect of soil neutrality on overall and within inequality. Therefore, the effect of slavery persists even after
controlling for the diffusion of large-scale plantations as determined by factor endowments. Identical results obtain in a
variant excluding land inequality (which we omit for brevity).
Table 1
Slavery and inequality.
Estimation method: OLS Model 1 Model 2 Model 3
Dependent variables Overall inequality Racial inequality Within inequality
Slaves/population 1860
0.0452nnn
(5.96)
0.0492nnn
(10.67)
À0.00393
(À0.73)
Population density 1860 0.00597nnn
(5.50)
0.00308nnn
(18.23)
0.00289nnn
(3.10)
Constant 0.251nnn
(22.07)
0.00623nnn
(4.70)
0.245nnn
(19.28)
State dummies Yes Yes Yes
Observations 1980 1980 1980
R2 0.427 0.334 0.353
Sample All counties All counties All counties
Robust t statistics in parentheses.
nnn
po0.01.
nn
po0.05.
n
po0.1.
Table 2
Slavery and inequality – controlling for factor endowments.
Estimation method: OLS Model 1 Model 2 Model 3 Model 4 Model 5 Model 6
Dependent variables Overall ineq. Racial ineq. Within ineq. Overall ineq. Racial ineq. Within ineq.
Slaves/population 1860 0.0468nnn
(6.11)
0.0494nnn
(10.70)
À0.0026
(À0.48)
0.0403nnn
(5.37)
0.0477nnn
(10.50)
À0.00746
(À1.37)
Population density 1860 0.00588nnn
(5.63)
0.00308nnn
(18.30)
0.00280nnn
(3.15)
0.00553nnn
(5.45)
0.00553nnn
(19.77)
0.00297nnn
(2.91)
Land inequality 1860 0.0214n
(1.79)
0.00170
(0.24)
0.0197nn
(2.23)
0.00884
(0.74)
0.00884
(À0.35)
À0.00250
(1.28)
Soil PH 0.00206n
(1.79)
0.000564
(1.28)
0.00150n
(1.70)
Longitude 0.000794
(1.42)
0.000450
(1.49)
0.000344
(0.78)
Latitude À0.00574nnn
(À8.08)
À0.00139nnn
(À4.49)
À0.00435nnn
(À7.27)
Constant 0.243nnn
(24.61)
0.00263
(0.88)
0.240nnn
(25.62)
0.608nnn
(8.31)
0.608nnn
(3.38)
0.117nnn
(7.98)
State dummies Yes Yes Yes Yes Yes Yes
Observations 1875 1875 1875 1836 1836 1836
R-squared 0.418 0.327 0.343 0.440 0.332 0.369
Sample All counties All counties All counties All counties All counties All counties
Robust t statistics in parentheses.
nnn
po0.01.
nn
po0.05.
n
po0.1.
17
According to Wright (2006) this distinction can be the result of different property rights emerging from slave and free labor production systems.
G. Bertocchi, A. Dimico / European Economic Review 70 (2014) 197–209 201
Our results so far indicate a strong and persistent effect of slavery on current inequality and in particular on current racial
inequality. The relationship between slavery, land inequality, and racial inequality may also be biased by omitted variables
and measurement error. As a final robustness check we test the effect of slavery in 1860 on the latter using an IV model in
order to provide some source of exogenous variation, first to the share of slaves in 1860 and then also to land inequality in
1860, using distinct instruments.
Mann (2011) argues that the reason why slavery developed in the US is because of the resistance of African slaves to
tropical diseases, and in particular to malaria. Using data on the force and stability of malaria transmission and on malaria
endemicity, Esposito (2013) documents a strong cross-sectional correlation between geographic suitability to malaria and
the diffusion of slavery across the US counties. Based on these findings, we use a similar instrument for the share of slaves in
1860 based on a proxy of environmental suitability for transmission of malaria falciparum. In order to construct our proxy
we use disaggregated GIS data at a 1 km level from the Malaria Atlas Project, which then is aggregated at a county level
(1860 boundaries). The resulting index of suitability is a relative measure of the effect of environmental conditions on
vectorial capacity and reproductive number which is proxied using a biological model incorporating the impact of climate
on vector lifespan and the duration of Plasmodium falciparum sporogeny (Gething et al., 2011). Given that the index is
constructed using exogenous variations in climate the environmental hazard is likely to remain constant before and after the
introduction of slavery. In addition, unlike Africa, in the US malaria has been eradicated since the 1940s, so that the malaria
ecology is unlikely to have a direct impact on current economic outcomes.
In principle, as argued by Wright (2006), land inequality could be endogenous to slavery, as slave owners could easily
acquire the best lands. Moreover, the relationship between slavery, land inequality, and racial inequality may also be biased
by omitted variables and measurement error. Therefore, to gain further insights we use FAO GAEZ data to construct indexes
of soil suitability to cotton and tobacco – which normally are associated with scale economies – to construct instruments for
land inequality in 1860. Cotton and tobacco have also been associated with the use of slavery. Therefore, in Table 3 we report
the pairwise correlation between the presumed endogenous variables and their proposed instruments. Our measure of
environmental suitability for malaria falciparum is strongly correlated with the share of slaves in 1860 (0.57) and much less
correlated with land inequality in 1860 (0.27). The index of soil suitability to tobacco is correlated strongly with land
inequality and only weakly correlated with the share of slaves. The cross-correlation between malaria's and tobacco's
suitability is also rather low (0.29). The facts that each of these two candidate instruments is highly correlated with one of
the endogenous variables only and that the cross-correlation between instruments is quite low are important in order to
disentangle the orthogonal part of the instrument correlated with endogenous variables (Shea, 1997). Cotton suitability on
the other hand is quite significantly correlated with both slavery and land inequality, which confirms the evidence that land
inequality and slavery were more frequent along the Cotton Belt.
In Table 4 we re-estimate Model 2 in Table 2 using an IV estimator where the dependent variable is racial inequality. In
Model 1 we only use an instrument for the share of slaves in 1860 and the coefficient on slavery is now much larger and still
highly significant. In Model 2 we also instrument for land inequality using soil suitability to tobacco and the coefficient on
the share of slaves in 1860 is almost unchanged. In Model 3 we also enter the index of soil suitability to cotton as an
additional instrument and the null that the model is not over-identified (Hansen Test) cannot be rejected. Beside diagnostic
tests, the suitability of the instruments is also confirmed by the fact that the coefficients on the share of slaves and land
inequality are extremely stable across models, which is unlikely to happen if the instruments are endogenous (Wooldridge,
2002) given that it is difficult to have a bias which is systematically the same across specifications.18
Table A2 in the Appendix reports first stage statistics. We find that the effect of the index of malaria suitability on the
share of slaves in 1860 is highly significant, while the index of tobacco suitability exerts almost no effect on slavery. The
opposite pattern of significance occurs for land inequality. Malaria suitability does not exert any effect on land inequality
while tobacco suitability is highly significant. Therefore each instrument has an independent effect on the two endogenous
variables providing enough orthogonality between predicted values, as confirmed by the Cragg-Donald F-statistic which is
much larger than the critical values in Stock and Yogo (2005). As a result, the instruments are both relevant.19
Table 3
Slavery and factor endowments – pairwise correlations.
Slaves Land ineq. Malaria Cotton Tobacco
Slaves/population 1860 1.0000
Land inequality 1860 0.1297 1.0000
Climate suitability to malaria F. 0.5744 0.2758 1.0000
Soil suitability to cotton 0.4160 0.3842 0.6910 1.0000
Soil suitability to tobacco 0.1294 0.4591 0.2956 0.0994 1.0000
18
As a falsification exercise we also regress malaria suitability against our best proxy of agricultural conditions (soil neutrality) and we find an
insignificant effect of soil pH on malaria, consistent with the idea that the slave share is independent of particular agricultural conditions.
19
IV estimates of Model 5 of Table 2, which involves a longer list of controls for factor endowments, yield identical results. Therefore we refer to Model
2 of Table 2 as a benchmark for the rest of the paper.
G. Bertocchi, A. Dimico / European Economic Review 70 (2014) 197–209202
4. Channels of transmission
So far we have shown that there is a robust and persistent relationship between slavery and current inequality,
particularly on its racial component. In this section we try to understand which is the channel through which this influence
manifests itself. While the legacy of slavery for contemporary economic outcomes may have run through multiple channels,
ranging from social capital20
and wealth inequality to law enforcement and criminalization, here we focus on two specific
mechanisms: racial discrimination and human capital transmission.
According to the racial discrimination mechanism, one of the legacies of slavery was a gap in the earnings of blacks which can
be attributed to discrimination.21
To test this hypothesis we proceed as follows. We start by creating a measure of racial
discrimination. To this end, we estimate returns on education at the county level for blacks and whites through a model akin to a
macro-Mincerian equation.22
The estimates are reported in Table A3 in Table Appendix.23
Beside educational attainment, we also
control for experience, as proxied by the employment rate and median age for each group, for the proportion of whites and blacks
in the labor force, to capture clusters or network effects, and for fixed geographical effects (namely, for counties within North
Eastern and South Atlantic states).24
In Table A4 we summarize the descriptive statistics resulting from our estimates. As expected
income per capita tends to increase with the level of education. On average, for educated whites income per capita is 71.3 percent
higher than for whites who did not complete high school, while for educated blacks income per capita is only 36.5 percent higher.
We use predicted returns to construct a proxy of discrimination between blacks and whites which is equal to the ratio of average
returns for blacks to average returns for whites. A ratio below one denotes the existence of a possible racial discrimination.
According to the human capital transmission channel, the legacy of slavery runs through educational inequality. This
happens since blacks, the vast majority of whom descend from slaves with no education (Smith, 1984; Margo, 1990), have
accumulated a gap in terms of education which results in inequality between blacks and whites, and in turn in overall
inequality. As a preliminary test of this hypothesis, we construct a measure of racial inequality for education,25
based on
information on the years of schooling for blacks and whites.26
Table 4
Slavery and racial inequality – IV estimates.
Estimation method: IV Model 1 Model 2 Model 3
Dependent variable Racial inequality
Slaves/population 1860 0.0915nnn
(10.67)
0.0967nnn
(9.58)
0.0934nnn
(5.58)
Population density 1860 0.00304nnn
(20.26)
0.00315nnn
(14.96)
0.00314nnn
(5.79)
Land inequality 1860 0.00817
(1.05)
À0.0176
(À1.06)
À0.0164
(À1.00)
Constant À0.00120
(-0.35)
0.01000
(1.38)
0.00949
(1.25)
Variables instrumented Slaves Slaves and land ineq. Slaves and land ineq.
Instruments Malaria suitability Malaria suitab.þtobacco suitab. Malaria suitab.þtobacco suitab.þcotton suitab.
Anderson canon. LR stat. 88.453 67.149 75.977
Cragg Donald F-stat 88.842 33.525 25.336
Stock and Yogo critic. val. 16.38 7.03 13.43
Hansen J-stat. 0.5696
Endogeneity 0.0000 0.0000 0.0190
State dummies Yes Yes Yes
Observations 1833 1833 1830
R-squared 0.269 0.247 0.258
Sample All counties All counties All counties
Robust t statistics in parentheses.
nnn
po0.01.
nn
po0.05.
n
po0.1.
20
Chay and Munshi (2012) study network formation among blacks after abolition and how it affected their voting and migration behavior.
21
Sundstrom (2007) estimates the white-black earnings gap of men in the South in 1940, adjusting for individual differences in schooling and
experience, and finds evidence of discrimination, which depressed black workers' wages and also prevented them from acquiring skills.
22
For a discussion of macro-Mincerian equations see Krueger and Lindahl (2001) and references therein.
23
In order to estimate returns for whites and blacks at the county level we compute separate estimates for the two groups. Data are from the 2000 US
Census.
24
The geographic dummies are considered since there is evidence that the vicinity to the coast, in particular to the Atlantic Ocean, has a direct effect
on current economic outcomes (see Lagerlöf, 2005). See also Rappaport and Sachs (2003) for an analysis of the coastal concentration of economic activity in
the US.
25
Data on educational attainment by race are from the 2000 US Census. For each race we compute the average years of schooling and then we derive a
Gini index.
26
See Birdsall and Londono (1997) and Thomas et al. (2002) for cross-country analyses of education Gini indices.
G. Bertocchi, A. Dimico / European Economic Review 70 (2014) 197–209 203
Table A5 in the Table Appendix reports descriptive statistics for the two proxies we have constructed in order to test the
two potential channels. We present these statistics for the entire sample of counties and also for the sub-sample of counties
belonging to former slave states. At the mean, the ratio of the expected returns on education we estimated for blacks and
whites is 0.51, across all counties. When confined to former slave states, the blacks to whites ratio of returns on education is
even smaller, suggesting the presence of more discrimination down in the South. The distribution of education is also more
unequal within slave states.
In Table 5 we compare our two hypotheses. In Model 1 we regress our measures of racial educational inequality on the
previous set of controls and we find a significant effect of the share of slaves, which increases racial inequality in education by
almost 0.005 per a standard deviation in the share of slaves. In Model 2 we replace the dependent variable with our measures of
racial discrimination in the labor market and we also find that the share of slaves has a significant effect on the black/white ratio of
returns on education, by increasing the gap by almost 0.097 per a standard deviation. To test the robustness of these results in
Models 3 and 4 we also use an IV estimator using the same set of instruments as in Model 4 in Table 427
and we find that the
effect of slavery on racial educational inequality is reinforced, while the coefficient on the returns loses significance.
The evidence we collected so far thus leads us to conclude that current income inequality between races is primarily
influenced by slavery through the impact exerted by the latter on the unequal educational attainment between races.28
In other words, it is through human capital transmission that slavery determines the cross-county distribution of inequality
in the US today.
Our results share a number of features with the literature on race and inequality. For example Smith and Welch (1989)
find that black relative wages rose from 18 to 35 percent in the 1960–80 period and that education is the overwhelmingly
dominant factor in explaining this relative advance, while Card and Krueger (1992) attribute to schooling between 15 and 20
percent of the overall growth in black-white relative earnings between 1960 and 1980. At the same time, Neal (2006)
collects evidence suggesting that, even though the black-white educational gaps diminished over most of the twentieth
century, this convergence process is still far from complete. Moreover, over a panel dataset covering the 1940–2000 period
at the state level, Bertocchi and Dimico (2012a) find that the racial educational gap significantly depends on its 1940 level,
which is in turn larger in former slave states: in other words, states with a larger initial gap still have larger racial
educational inequality.29
These results are consistent with the present finding that the inequality of education between
races is the main determinant of income inequality because of its impact on racial income inequality.
Table 5
Slavery and inequality – channels of transmission.
Estimation methods: OLS IV
Dependent variables Model 1 Model 2 Model 3 Model 4
Racial educational
inequality
Blacks/whites returns on
education
Racial educational
inequality
Blacks/whites returns on
education
Slaves/population 1860 0.0346nnn
(18.60)
À0.208nnn
(À6.51)
0.0852nnn
(11.64)
À0.267
(À1.60)
Population density 1860 0.00204nnn
(6.49)
À0.0054nnn
(À3.28)
0.00206nnn
(6.54)
À0.00366nnn
(À2.97)
Constant 0.0133nnn
(3.71)
0.425nnn
(7.55)
0.00643n
(1.83)
0.680nnn
(8.17)
Variables instrumented Slaves and land ineq
Instruments Malaria suitab.þtobacco suitab.þcotton suitab.
Anderson canon. LR stat. 75.41 67.696
Cragg Donald F-stat. 25.143 22.521
Stock and Yogo critic. val. 13.43 13.43
Hansen J-stat 0.2054 0.9249
Endogeneity 0.000 0.0436
State dummies Yes Yes Yes Yes
Observations 1849 1803 1805 1759
R-Squared 0.594 0.144 0.323 0.128
Sample All counties All counties All counties All counties
Robust t statistics in parentheses.
nnn
po0.01.
nn
po0.05.
n
po0.1.
27
First stages are similar to those presented in Table A2 in Table Appendix.
28
In the context of nineteenth century Puerto Rico, Bobonis and Morrow (2010) find that the abolition of labor coercion reduced laborers' incentives to
accumulate human capital.
29
The correlation between the racial gap in education in 1940 and the fraction slaves/population in 1860 is 0.90 at the high-school level and 0.78 at the
bachelor-degree level.
G. Bertocchi, A. Dimico / European Economic Review 70 (2014) 197–209204
5. A quasi experiment
In this section we exploit the exogenous variation in slavery determined by the instruments used for our IV specification
to carry out an additional test. According to Engerman and Sokoloff (1997, 2005a) and Mann (2011) slavery largely depends
on factor endowments and malaria hazard. Therefore we can exploit this exogenous variation to predict the probability of
slavery by using the “discontinuity” in the use of slavery along the a sort of “extended Mason–Dixon line” dividing between
slave and non-slave states: in other words, we can match counties which did and did not make use of slavery despite having
the same probability of developing a slave society. The discontinuity in the use of slavery can therefore be interpreted as the
result of state and local politics only. As a result, if we control for this channel then we should obtain an unbiased estimate of
the effect of slavery on inequality.
In more details, if we look at counties along the border between slave and non-slave states (as illustrated in Figure A1 in
Table Appendix), then counties within slave and non-slave states should be very similar in terms of factor endowments and
because of that they should have the same probability of developing slavery. However, only those counties within slave
states actually ended up introducing this form of labor coercion, mainly because of differences in state politics. Therefore if
within the same sample of counties with a similar probability of developing slavery we manage to control for state politics
and state policy variables then we should be able to estimate the counterfactual.
From an empirical point of view first we need to match counties which have a similar probability of developing slavery
and then we can estimate the effect of the latter on long-term outcomes. This can be done using a propensity score model
which is then followed by an OLS estimator. The propensity score model will assign the probability of developing slavery on
the basis of factor endowments and will match counties which have a similar probability of developing slavery by choosing
the region within a common support. Then we can look at counties within this region in order to understand what would
have happened to counties which have not been treated with slavery if they had developed this form of labor coercion. This
is done by exploiting the variation in slavery between matched counties as in a sort of county-pair identification model.30
The fact that we use a propensity score to match counties will permit us to have a better matching since counties are chosen
on the basis of specific criteria related to slavery and they are not assumed to be a priori identical. As a consequence we will
be able to control for any county-specific factor which could be related to slavery (except for those related to state politics
and policies) and at the same time we will be able to control for spatial fixed effects in the same way a county-pair
identification model does. As usual, clustering at the state-border level allows to control for the correlation across counties
sharing the same borders.
The basic assumption behind our estimation procedure is conditional independence, which in our case means that there
is a set of observed characteristics Z (related to factor endowments and malaria environment) such that the outcome is
independent on the probability of slavery conditional on a set of pre-treatment independent variables X. In other words the
selection into treatment depends on observables up to a random factor, so that our estimation procedure can be considered
as a weaker version of a pure randomization in which the treatment is independent of pre-treated independent variables. Of
course there are costs associated with the use of such an estimator. The main one relates to the limited sample size, which in
our case is confined to the set of counties along the border between slave and non-slave states. The smaller sample size
affects the variation in our main explanatory variable (slavery) given that the use of slavery was largely restricted to the
Table 6
Quasi experiment (matching model).
Estimation method: OLS Model 1 Model 2 Model 3
Dependent variables Racial inequality Racial educational inequality Blacks/whites returns on edu.
Slaves/population 1860 0.0286nnn
(4.81)
0.0337nnn
(5.10)
À0.0747
(À0.63)
Population density 1860 0.0539nnn
(4.69)
0.0321nnn
(6.87)
À0.288nn
(À2.24)
Land inequality 1860 0.0262n
(2.00)
0.0225nn
(2.54)
0.271
(0.62)
Constant À0.00122
(À0.21)
À0.00239
(À0.58)
0.385nn
(2.55)
State dummies Yes Yes Yes
Observations 145 143 133
R-Squared 0.497 0.547 0.106
Sample Common support Common support Common support
Robust t statistics in parentheses.
nnn
po0.01.
nn
po0.05.
n
po0.1.
30
A county-pair identification strategy has been used among others by Dube et al. (2010) and Naidu (2010), to test the effect of the minimum wage and
of disenfranchisement schemes, respectively.
G. Bertocchi, A. Dimico / European Economic Review 70 (2014) 197–209 205
deep South. On the other side, this simple quasi experiment will help us to understand what would have happened to
counties which used slavery if this form of labor coercion had been banned in the first place.
Tables A6 and A7 in Table Appendix show the propensity score model and the distribution of the propensity score in the
treatment and matched comparison groups across blocks (Rosenbaum and Rubin, 1983). The difference in mean between
counties exposed and not exposed to slavery is not significantly different across blocks, which confirms that the
characteristics of the treatment and comparison groups are not significantly different from each other within blocks. This
test is particularly important for our analysis given that it ensures that matched counties with and without slavery are
exactly the same, so that there are no unobserved characteristics which can affect the estimates once we control for state
politics and policies by using a set of state dummy variables.
Table 6 provides estimates restricted to the region of common support. In Model 1 we still find a significant effect of
slavery on income inequality across races. In Model 2 we test the effect of the share of slaves on racial educational inequality
and we can also confirm the significant effect of the former on the latter. In Model 3 we replace the dependent variable with
the gap in the returns to education for blacks and whites and, consistently with the IV estimates in Section 4, we do not find
a statistical significant effect of slavery, which implies that racial educational inequality is the main channel through which
slavery affects the inequality between races.
To conclude, our robustness checks confirm the results found in the previous section suggesting that the persistence in
the racial gap in education is a crucial channel of transmission from slavery to current inequality within the US.
6. Why education?
As outlined in the previous sections one of the main reasons why the effect of slavery on inequality runs through the
inequality between races is related to the huge impact that education has on wages (see also Goldin and Katz, 1999). The
natural question to ask now is why slavery may have affected education inequality. One of the main reasons is related to
local politics and to the close link between them and educational policies. In other words, educational policies as shaped by
local politics represent a channel through which the gap in education between whites and blacks has persisted. Using a
panel of the US states over the 1940–2000 period Bertocchi and Dimico (2012a) show that a larger educational gap between
whites and blacks in 1940 has caused a long-lasting gap in education which still persists today. This gap is the result of the
0
20
40
60
80
100
0 0.2 0.4 0.6 0.8 1
slave_1860
0
20
40
60
80
100
0 0.2 0.4 0.6 0.8 1
slave_1860
0
20
40
60
80
100
0 0.2 0.4 0.6 0.8 1
slave share 1860
0
20
40
60
80
100
0 0.2 0.4 0.6 0.8 1
slave_1860
1900 Presidential Turnout (%) Fitted values 1900 Democratic Vote Share (%) Fitted values
1960 Presidential Turnout (%) Fitted values
1960 Democratic Vote Share (%) Fitted values
Fig. 1. Slavery, presidential turnout, and Democratic share.
G. Bertocchi, A. Dimico / European Economic Review 70 (2014) 197–209206
post-Reconstruction politics and “separate but equal” educational policies. Using data on voting registration for blacks and
whites within the state of Mississippi Bertocchi and Dimico (2012b) show that in 1917 the student–teacher ratio for blacks is
much higher in counties with lower black registration. This higher ratio is the result of state-funding diversion from black to
white pupils. Since local officers in former slave states could use funding for black pupils in order to finance education for
white pupils, they applied a lower property tax. The property tax is the principal source of revenue for localities/counties
and it also represents the main source of funding for education, with nearly half of all property-tax revenues used for public
elementary and secondary education (Kenyon, 2007). Even after the abolition of “separate but equal” counties which used to
have a lower property tax still kept a lower tax rate, with a negative effect on public school funding and therefore education
for blacks.
Plots in Fig. 1 show the relationship between the slave share in 1860 and local politics, in terms of presidential voting
turnout and Democratic share.31
The two plots at the top show the relationship for the year 1900, when almost all the
Southern states – with the exception of Texas, Alabama, and Virginia – had introduced forms of disenfranchisement for
blacks. The plot on the left shows that turnout in counties with a massive share of slaves in 1860 is much smaller than in
counties with a lower share of slaves (almost À0.7 percentage points in turnout per a 1 percent increase in the share of
slaves) while the plot on the right shows that slavery is also closely associated with a larger share for the Democratic Party
which, at the time, represented the interests of the white elites. The two plots at the bottom of the figure show that this
relationship still persists until 1960, i.e., until the realignment of party politics and the approval of the Voting Rights Act. Of
course one can argue that presidential elections data are not appropriate to evaluate local politics, but in the US presidential
turnout has always been the highest if compared to other elections, so that in the worst case scenario results should be
downward biased.32
The connection between disenfranchisement of blacks and local politics is confirmed by a more formal
analysis in Bertocchi and Dimico (2012b), Naidu (2010) and Acharya et al. (2013), while Acemoglu et al. (2013) offer a survey
of the literature on democracy, redistribution and public good provision including education.
0
0.2
0.4
0.6
0 0.2 0.4 0.6 0.8 1
slave_1860
0
2
4
6
8
10
0 0.2 0.4 0.6 0.8 1
slave_1860
1962 Per Capita Property Tax Fitted values 1992 Per Capita Property Tax Fitted values
Fig. 2. Slavery and property taxes.
6.5
7
7.5
8
0 0.2 0.4 0.6 0.8 1
slave_1860
1
2
3
4
5
0 0.2 0.4 0.6 0.8 1
slave_1860
Log Total Education Expenditure p.c. (2000) Fitted values 2000 Weighted Average Black Education blk 25+ Fitted values
Fig. 3. Slavery and education expenditure.
31
Data on presidential elections are from Clubb et al. (2006).
32
We use data on turnout for presidential elections because historical data on local elections are not available.
G. Bertocchi, A. Dimico / European Economic Review 70 (2014) 197–209 207
While the above documented political balance of power had broader implications, the next link between slavery and
education inequality is to be found in the local nature of education provision and funding. As mentioned above, the property
tax is the main source of funding for localities/counties and thus for public education support. Because of the “separate but
equal” educational policies applied in Southern states until the 1960s, local officers could divert state funding for blacks to
finance education for whites. As a result they could impose a lower property tax and spend less in education. The
relationship between slavery and per capita property taxes is shown in plots in Fig. 2 for 1962 (on the left) and 1992 (on the
right). The plots show that a larger share of slaves is associated with a smaller per capita tax in 1962 and the relationship
still holds in 1992, which implies a sort of persistence in the education policies implemented before and after the abolition
of black disenfranchisement.
Finally in Fig. 3 on the left we show the relationship between slavery and education expenditure per capita in 2000 (from
the National Center for Education Statistics). Education expenditure in 2000 is still negatively affected by slavery. On the
right we plot a measure of the average education attainment of the black population over age 25 in 2000 (the source is
Census), which is inversely related to past slavery despite the above-mentioned evidence of convergence between blacks
and whites in terms of education.
While the evidence we have reported in this section of course does not imply causality, it does provide a clear illustration
of the strong links between the legacy of slavery, local politics, fiscal policy choices and current education outcomes.
7. Conclusion
In this paper we have shown that the legacy of slavery still plays a major role in the US economy and society, since the
past use of slave labor persistently affects current inequality, and particularly its racial component. In other words, those US
counties that in the past exhibited a higher slave share over population turn out to be still more unequal in the present day.
We also show that human capital transmission is a crucial channel through which slavery manifests its legacy.
The declared goal of recent reform programs for the American schooling system has been the removal of the persistent
racial and ethnic educational gaps that are still pervasive in the US society. This is the case both for No Child Left Behind, the
federal education program enacted in 2002 under President Bush, and for Race to the Top, the current program created by
President Obama. This goal is consistent with the evidence we provide, showing how deeply educational inequality is rooted
in the history of the country.
Acknowledgments
We would like to thank two anonymous referees, Daron Acemoglu, Costas Azariadis, Roland Benabou, Elena Esposito,
Raquel Fernandez, Chiara Gigliarano, Oded Galor, Nippe Lagerlöf, Nathan Nunn, Elias Papaioannou, Dietrich Vollrath, as well
as participants at the NBER Summer Institute Workshop on Income Distribution and Macroeconomics, the IV Workshop of
the Social Choice Research Group, the PRIN Workshop on Political Institutions and Demographic Dynamics, the Rimini
Conference in Economics and Finance, the IX Brucchi Luchino Labour Economics Workshop, the CEPR ESSIM, the IEA, and
seminars at the Universities of Nottingham, Glasgow, Göteborg, IMT Lucca, National University of Singapore, and Sheffield,
for comments and suggestions. Generous financial support from the Italian University Ministry and Fondazione Cassa
Risparmio di Modena is gratefully acknowledged.
Appendix A. Supporting information
Supplementary data associated with this article can be found in the online version at: http://dx.doi.org/10.1016/j.
euroecorev.2014.04.007.
References
Acemoglu, D., Bautista, M.A., Querubín, P., Robinson, J.A., 2008a. Economic and political inequality in development: the case of Cundinamarca, Colombia. In:
Helpman, E. (Ed.), Institutions and Economic Performance, Harvard University Press, Cambridge, pp. 181–245.
Acemoglu, D., Johnson, S., Robinson, J.A., Yared, P., 2008b. Income and democracy. Am. Econ. Rev. 98, 808–842.
Acemoglu, D., Johnson, S., Robinson, J.A., 2002. Reversal of fortune: geography and institutions in the making of the modern world income distribution. Q. J.
Econ. 117, 1231–1294.
Acemoglu, D., Naidu, S., Restrepo, P.. Robinson, J.A., 2013, Democracy, Redistribution and Inequality. NBER Working Paper no. 19746.
Acemoglu, D., Robinson, J.A., 2008. Persistence of power, elites, and institutions. Am. Econ. Rev. 98, 267–293.
Acemoglu, D., Wolitzky, A., 2011. The economics of labor coercion. Econometrica 79, 555–600.
Acharya, A., Blackwell, M. and Sen, M., 2013. The Political Legacy of American Slavery. Mimeo. University of Rochester.
Ashenfelter, O., Heckman, J.J., 1976. Measuring the effect of an anti-discrimination program. In: Ashenfelter, O., Blum, J. (Eds.), Estimating the Labor Market
Effects of Social Programs, Princeton University Press, Princeton, pp. 46–89.
Berlin, I., 2003. Generations of Captivity: A History of African American Slaves. Harvard University Press, Cambridge.
Bertocchi, G., Dimico, A., 2012a. The racial gap in education and the legacy of slavery. J. Comp. Econ. 40, 581–595.
Bertocchi, G., Dimico, A., 2012b, De Jure and de Facto Determinants of Power: Evidence from Mississippi. CEPR Discussion Paper No. 9064.
Bertocchi, G., Dimico, A., 2010, Slavery, Education, and Inequality. CEPR Discussion Paper no. 8073.
G. Bertocchi, A. Dimico / European Economic Review 70 (2014) 197–209208
Birdsall, B., Londono, J.J., 1997. Asset inequality matters: an assessment of the World Bank's approach to poverty reduction. Am. Econ. Rev. Pap. Proc. 87,
32–37.
Bobonis, G. J., Morrow, P. M., 2010, Labor Coercion and the Accumulation of Human Capital, mimeo. University of Toronto.
Cameron, S.V., Heckman, J.J., 2001. The dynamics of educational attainment for blacks, hispanics, and whites. J. Polit. Econ. 109, 455–499.
Card, D., Krueger, A.B., 1992. School quality and black-white relative earnings: a direct assessment. Q. J. Econ. 107, 151–200.
Caselli, F., Coleman, W.J., 2001. The U.S. structural transformation and regional convergence: a reinterpretation. J. Polit. Econ. 109, 584–616.
Chay, K., Munshi, K., 2012, Black Networks After Emancipation: Evidence from Reconstruction and the Great Migration. Mimeo, Brown University.
Clubb, J. M., Flanigan, W. H., Zingale, N. H., 2006. Electoral Data for Counties in the United States: Presidential and Congressional Races, 1840–1972. Inter-
university Consortium for Political and Social Research.
Collins, W.J., Margo, R.A., 2006. Historical perspectives on racial differences in schooling in the United States. In: Hanushek, E., Welch, F. (Eds.), Handbook of
the Economics of Education, Elsevier, New York, pp. 107–154.
David, P.A., Stampp, K.M. (Eds.), 1976. , Oxford University Press, New York.
Donohue III, J.J., Heckman, J., 1991. Continuous versus episodic change: the impact of Civil Rights Policy on the economic status of Blacks. J. Econ. Lit. 29,
1603–1643.
Dube, A., Lester, T.W., Reich, M., 2010. Minimum wage effects across state borders: estimates using contiguous counties. Rev. Econ. Stat. 92, 945–964.
Einhorn, R.L., 2002. Patrick Henry's case against the constitution: the structural problem with slavery. J. Early Repub. 22, 549–573.
Engerman, S.L., Sokoloff, K.L., 2005a. Institutional and non-institutionals explanations of economic differences. In: Menard, C., Shirley, M.M. (Eds.),
Handbook of New Institutional Economics, Springer, Dordrecht, pp. 639–665.
Engerman, S.L., Sokoloff, K.L., 2005b. The evolution of suffrage institutions in the Americas. J. Econ. Hist. 65, 891–921.
Engerman, S.L., Sokoloff, K.L., 1997. Factor endowments, institutions, and differential paths of growth among new world economies: a view from economic
historians of the United States. In: Harber, S. (Ed.), How Latin America Fell Behind, Stanford University Press, Stanford, pp. 260–304.
Esposito, E., 2013, Side Effects of Immunities: The African Slave Trade. Mimeo. University of Bologna.
Fogel, R.W., Engerman, S.L., 1974. Time on the cross: the economics of American Negro slavery. Little Brown, Boston.
Galor, O., Moav, O., Vollrath, D., 2009. Inequality in landownership, the emergence of human-capital promoting institutions, and the great divergence. Rev.
Econ. Stud. 76, 143–179.
Gething, P.W., Van Boeckel, T.P., Smith, D.L., Guerra, C.A., Patil, A.P., Snow, R.W., Hay, S.I., 2011. Modelling the global constraints of temperature on
transmission of Plasmodium falciparum and P. vivax. Parasites Vectors 4, 92–102.
Goldin, C., Margo, R.A., 1992. The great compression: the US wage structure at mid-century. Q. J. Econ. 107, 1–34.
Goldin, C., 1998. America's graduation from high school: the evolution and spread of secondary schooling in the twentieth century. J. Econ. Hist. 58,
345–374.
Goldin, C., Katz, L.F., 1999. The shaping of higher education: the formative years in the Unites States, 1890 to 1940. J. Econ. Perspect. 13, 37–62.
Hall, R.E., Jones, C.I., 1999. Why do some countries produce so much more output per worker than others? Q. J. Econ. 114, 83–116.
Heckman, J.J., 1990. The central role of the south in accounting for economic progress of black Americans. Am. Econ. Rev. 80, 242–246.
Irwin, J.R., 1994. Explaining the decline in southern per capita output after emancipation. Explor. Econ. Hist. 31, 336–356.
Jenkins, S.P., 1999. INEQDEC0: Stata Module to Calculate Inequality Indices with Decomposition by Subgroup. Statistical Software Components S366007,
Boston College.
Kenyon, D.A., 2007. The Property Tax-School Funding Dilemma (Policy Focus Report), CambridgeThe Lincoln Institute of Land Policy.
Key, V.O., 1964. In: Politics, Parties and Pressure Groups5th edition Crowell, New York.
Krueger, A.B., Lindahl, M., 2001. Education for growth: why and for whom. J. Econ. Lit. 39, 1101–1136.
Lagerlöf, N., 2009. Slavery and other property rights. Rev. Econ. Stud. 76, 319–342.
Lagerlöf, N., 2005, Geography, Institutions, and Growth: The United States as a Microcosm. Mimeo, York University.
Mann, C.C., 2011. 1493: How the Ecological Collision of Europe and the Americas Gave Rise to the Modern World. Granta Books, London.
Margo, R.A., 1990. Race and Schooling in the South, 1880–1950: An Economic History. University of Chicago Press, Chicago.
Mariscal, E., Sokoloff, K.L., 2000. Schooling, suffrage, and the persistence of inequality in the Americas, 1800–1945. In: Haber, S. (Ed.), Political Institutions
and Economic Growth in Latin America: Essays in Policy, History, and Political Economy, Hoover Institution Press, Stanford, pp. 159–218.
Mitchener, K.J., McLean, I.W., 2003. The productivity of U.S. states since 1880. J. Econ. Growth 8, 73–114.
Morgan, E., 1975. American Slavery, American Freedom: The Ordeal of Colonial Virginia. W. W. Norton & Company, New York, London.
Naidu, S., 2010, Suffrage, Schooling, and Sorting in the Post-Bellum U.S. South. Mimeo, Harvard University.
Neal, D., 2006. Why Has Black-White skill convergence stopped?. In: Hanushek, E., Welch, F. (Eds.), Handbook of Economics of Education, vol. 1, North-
Holland, Amsterdam, pp. 511–576. (Chapter 9).
Nunn, N., 2008a. The long-term effects of Africa's slave trades. Q. J. Econ. 123, 139–176.
Nunn, N., 2008b. Slavery, inequality, and economic development in the Americas: an examination of the Engerman–Sokoloff Hypothesis. In: Helpman, E.
(Ed.), Institutions and Economic Performance, Harvard University Press, Cambridge, pp. 48–180.
Ramcharan, R., 2010. Inequality and redistribution: evidence from U.S. counties and states, 1890–1930. Rev. Econ. Stat. 92, 729–744.
Ransom, R.L., Sutch, R., 2001. One Kind of Freedom: The Economic Consequences of Emancipation, 2nd edition Cambridge University Press, New York.
Rappaport, J., Sachs, J.D., 2003. The United States as a coastal nation. J. Econ. Growth 8, 5–46.
Rosenbaum, P.R., Rubin, D.B., 1983. The central role of the propensity score in observational studies for causal effects. Biometrika 70, 41–55.
Sacerdote, B., 2005. Slavery and the intergenerational transmission of human capital. Rev. Econ. Stat. 87, 217–234.
Shea, J., 1997. Instrument relevance in multivariate linear models: a simple measure. Rev. Econ. Stat. 79, 348–352.
Smith, J.P., 1984. Race and human capital. Am. Econ. Rev. 74, 685–698.
Smith, J.P., Welch, F.R., 1989. Black economic progress after Myrdal. J. Econ. Lit. 27, 519–564.
Sokoloff, K.L., Engerman, S.L., 2000. Institutions, factor endowments, and paths of development in the new world. J. Econ. Perspect. 14, 217–232.
Sokoloff, K.L., Zolt, E.M., 2007. Inequality and the evolution of institutions of taxation: evidence from the economic history of the Americas. In: Edwards, S.,
Esquivel, G., Marquez, G. (Eds.), The Decline of Latin American Economies: Growth, Institutions, and Crises, University of Chicago Press, Chicago,
pp. 83–136.
Sundstrom, W.A., 2007. The geography of wage discrimination in the pre-civil rights south. J. Econ. Hist. 67, 410–444.
Thomas, V., Wang, Y., Fan, X., 2002, A New Dataset on Inequality in Education: Gini and Theil Indices of Schooling for 140 Countries, 1960–2000. Mimeo,
World Bank.
Vollrath, D., 2013. School funding and inequality in the rural United States, 1890. Explor. Econ. Hist. 50, 267–284.
Wooldridge, J.M., 2002. Introductory Econometrics, 2nd edition South-Western, Cincinnati.
Wright, G., 2006. Slavery and American Economic Development. Louisiana State University Press, Baton Rouge.
G. Bertocchi, A. Dimico / European Economic Review 70 (2014) 197–209 209

More Related Content

Similar to Slavery, education, and inequality. Graziella Bertocchi & Arcangelo Dimico

Fractionalization alesinassrn fractionalization
Fractionalization   alesinassrn fractionalizationFractionalization   alesinassrn fractionalization
Fractionalization alesinassrn fractionalization
Espi Sul
 
Politico-economic Regimes and Attitudes: Female Workers under State-socialism
Politico-economic Regimes and Attitudes: Female Workers under State-socialismPolitico-economic Regimes and Attitudes: Female Workers under State-socialism
Politico-economic Regimes and Attitudes: Female Workers under State-socialism
Stockholm Institute of Transition Economics
 
Coglianese - Can Regulatory Capture Explain Economic Inequality in America
Coglianese - Can Regulatory Capture Explain Economic Inequality in AmericaCoglianese - Can Regulatory Capture Explain Economic Inequality in America
Coglianese - Can Regulatory Capture Explain Economic Inequality in America
Shane Murphy
 
Language Essay. How To Write An Ap Lang Synthesis Essay - Ahern Scribble
Language Essay. How To Write An Ap Lang Synthesis Essay - Ahern ScribbleLanguage Essay. How To Write An Ap Lang Synthesis Essay - Ahern Scribble
Language Essay. How To Write An Ap Lang Synthesis Essay - Ahern Scribble
Brandy Johnson
 
Language Essay
Language EssayLanguage Essay
Language Essay
Niki Taylor
 
1 8Human Trafficking Maria Fernanda GranadilloSYG23
 1 8Human Trafficking Maria Fernanda GranadilloSYG23 1 8Human Trafficking Maria Fernanda GranadilloSYG23
1 8Human Trafficking Maria Fernanda GranadilloSYG23
MargaritoWhitt221
 
Looking through the lens of the past and present
Looking through the lens of the past and presentLooking through the lens of the past and present
Looking through the lens of the past and present
Shaza2611
 
Running Head DISCUSSION1DISCUSSION 2.docx
Running Head DISCUSSION1DISCUSSION 2.docxRunning Head DISCUSSION1DISCUSSION 2.docx
Running Head DISCUSSION1DISCUSSION 2.docx
todd271
 
Running head DISCUSSION1DISCUSSION2.docx
Running head DISCUSSION1DISCUSSION2.docxRunning head DISCUSSION1DISCUSSION2.docx
Running head DISCUSSION1DISCUSSION2.docx
todd271
 
Essay On Destiny. Impressive Manifest Destiny Essay Thatsnotus
Essay On Destiny. Impressive Manifest Destiny Essay  ThatsnotusEssay On Destiny. Impressive Manifest Destiny Essay  Thatsnotus
Essay On Destiny. Impressive Manifest Destiny Essay Thatsnotus
Nicoletta Tyagi
 
Sample Scholarship Essay
Sample Scholarship EssaySample Scholarship Essay
Sample Scholarship Essay
Jessica Hunter
 
Barrera, Chapter 1 Introduction” (1-3 only)1. Present the.docx
Barrera,  Chapter 1 Introduction” (1-3 only)1.    Present the.docxBarrera,  Chapter 1 Introduction” (1-3 only)1.    Present the.docx
Barrera, Chapter 1 Introduction” (1-3 only)1. Present the.docx
ikirkton
 
Wealth Inequality Among Immigrants ConsistentRacialEthnic .docx
Wealth Inequality Among Immigrants ConsistentRacialEthnic .docxWealth Inequality Among Immigrants ConsistentRacialEthnic .docx
Wealth Inequality Among Immigrants ConsistentRacialEthnic .docx
jessiehampson
 

Similar to Slavery, education, and inequality. Graziella Bertocchi & Arcangelo Dimico (20)

Fractionalization alesinassrn fractionalization
Fractionalization   alesinassrn fractionalizationFractionalization   alesinassrn fractionalization
Fractionalization alesinassrn fractionalization
 
JPAE 17(2) Article --- W. Haynes
JPAE 17(2) Article  --- W. HaynesJPAE 17(2) Article  --- W. Haynes
JPAE 17(2) Article --- W. Haynes
 
Politico-economic Regimes and Attitudes: Female Workers under State-socialism
Politico-economic Regimes and Attitudes: Female Workers under State-socialismPolitico-economic Regimes and Attitudes: Female Workers under State-socialism
Politico-economic Regimes and Attitudes: Female Workers under State-socialism
 
Coglianese - Can Regulatory Capture Explain Economic Inequality in America
Coglianese - Can Regulatory Capture Explain Economic Inequality in AmericaCoglianese - Can Regulatory Capture Explain Economic Inequality in America
Coglianese - Can Regulatory Capture Explain Economic Inequality in America
 
Language Essay. How To Write An Ap Lang Synthesis Essay - Ahern Scribble
Language Essay. How To Write An Ap Lang Synthesis Essay - Ahern ScribbleLanguage Essay. How To Write An Ap Lang Synthesis Essay - Ahern Scribble
Language Essay. How To Write An Ap Lang Synthesis Essay - Ahern Scribble
 
Language Essay
Language EssayLanguage Essay
Language Essay
 
1 8Human Trafficking Maria Fernanda GranadilloSYG23
 1 8Human Trafficking Maria Fernanda GranadilloSYG23 1 8Human Trafficking Maria Fernanda GranadilloSYG23
1 8Human Trafficking Maria Fernanda GranadilloSYG23
 
Looking through the lens of the past and present
Looking through the lens of the past and presentLooking through the lens of the past and present
Looking through the lens of the past and present
 
THIS IS IT
THIS IS ITTHIS IS IT
THIS IS IT
 
Running Head DISCUSSION1DISCUSSION 2.docx
Running Head DISCUSSION1DISCUSSION 2.docxRunning Head DISCUSSION1DISCUSSION 2.docx
Running Head DISCUSSION1DISCUSSION 2.docx
 
Running head DISCUSSION1DISCUSSION2.docx
Running head DISCUSSION1DISCUSSION2.docxRunning head DISCUSSION1DISCUSSION2.docx
Running head DISCUSSION1DISCUSSION2.docx
 
salgado.humberto.finaldraft
salgado.humberto.finaldraftsalgado.humberto.finaldraft
salgado.humberto.finaldraft
 
Essay On Destiny. Impressive Manifest Destiny Essay Thatsnotus
Essay On Destiny. Impressive Manifest Destiny Essay  ThatsnotusEssay On Destiny. Impressive Manifest Destiny Essay  Thatsnotus
Essay On Destiny. Impressive Manifest Destiny Essay Thatsnotus
 
Sample Scholarship Essay
Sample Scholarship EssaySample Scholarship Essay
Sample Scholarship Essay
 
'Race and poverty
'Race and poverty'Race and poverty
'Race and poverty
 
Barrera, Chapter 1 Introduction” (1-3 only)1. Present the.docx
Barrera,  Chapter 1 Introduction” (1-3 only)1.    Present the.docxBarrera,  Chapter 1 Introduction” (1-3 only)1.    Present the.docx
Barrera, Chapter 1 Introduction” (1-3 only)1. Present the.docx
 
Why Nations Fail - Book Review
Why Nations Fail - Book ReviewWhy Nations Fail - Book Review
Why Nations Fail - Book Review
 
Wealth Inequality Among Immigrants ConsistentRacialEthnic .docx
Wealth Inequality Among Immigrants ConsistentRacialEthnic .docxWealth Inequality Among Immigrants ConsistentRacialEthnic .docx
Wealth Inequality Among Immigrants ConsistentRacialEthnic .docx
 
A REVIEW OF WHY NATIONS FAILS. Documents
A REVIEW OF WHY NATIONS FAILS. DocumentsA REVIEW OF WHY NATIONS FAILS. Documents
A REVIEW OF WHY NATIONS FAILS. Documents
 
Tulane University 2016 Thesis Document of Joseph A. Colón
Tulane University 2016 Thesis Document of Joseph A. ColónTulane University 2016 Thesis Document of Joseph A. Colón
Tulane University 2016 Thesis Document of Joseph A. Colón
 

More from eraser Juan José Calderón

Ética y Revolución Digital . revista Diecisiete nº 4. 2021
Ética y Revolución Digital . revista Diecisiete nº 4. 2021Ética y Revolución Digital . revista Diecisiete nº 4. 2021
Ética y Revolución Digital . revista Diecisiete nº 4. 2021
eraser Juan José Calderón
 
Desigualdades educativas derivadas del COVID-19 desde una perspectiva feminis...
Desigualdades educativas derivadas del COVID-19 desde una perspectiva feminis...Desigualdades educativas derivadas del COVID-19 desde una perspectiva feminis...
Desigualdades educativas derivadas del COVID-19 desde una perspectiva feminis...
eraser Juan José Calderón
 

More from eraser Juan José Calderón (20)

Evaluación de t-MOOC universitario sobre competencias digitales docentes medi...
Evaluación de t-MOOC universitario sobre competencias digitales docentes medi...Evaluación de t-MOOC universitario sobre competencias digitales docentes medi...
Evaluación de t-MOOC universitario sobre competencias digitales docentes medi...
 
Call for paper 71. Revista Comunicar
Call for paper 71. Revista ComunicarCall for paper 71. Revista Comunicar
Call for paper 71. Revista Comunicar
 
Editorial of the JBBA Vol 4, Issue 1, May 2021. Naseem Naqvi,
Editorial of the JBBA Vol 4, Issue 1, May 2021. Naseem Naqvi, Editorial of the JBBA Vol 4, Issue 1, May 2021. Naseem Naqvi,
Editorial of the JBBA Vol 4, Issue 1, May 2021. Naseem Naqvi,
 
REGULATION OF THE EUROPEAN PARLIAMENT AND OF THE COUNCIL LAYING DOWN HARMONIS...
REGULATION OF THE EUROPEAN PARLIAMENT AND OF THE COUNCIL LAYING DOWN HARMONIS...REGULATION OF THE EUROPEAN PARLIAMENT AND OF THE COUNCIL LAYING DOWN HARMONIS...
REGULATION OF THE EUROPEAN PARLIAMENT AND OF THE COUNCIL LAYING DOWN HARMONIS...
 
Predicting Big Data Adoption in Companies With an Explanatory and Predictive ...
Predicting Big Data Adoption in Companies With an Explanatory and Predictive ...Predicting Big Data Adoption in Companies With an Explanatory and Predictive ...
Predicting Big Data Adoption in Companies With an Explanatory and Predictive ...
 
Innovar con blockchain en las ciudades: Ideas para lograrlo, casos de uso y a...
Innovar con blockchain en las ciudades: Ideas para lograrlo, casos de uso y a...Innovar con blockchain en las ciudades: Ideas para lograrlo, casos de uso y a...
Innovar con blockchain en las ciudades: Ideas para lograrlo, casos de uso y a...
 
Innovar con blockchain en las ciudades: Ideas para lograrlo, casos de uso y a...
Innovar con blockchain en las ciudades: Ideas para lograrlo, casos de uso y a...Innovar con blockchain en las ciudades: Ideas para lograrlo, casos de uso y a...
Innovar con blockchain en las ciudades: Ideas para lograrlo, casos de uso y a...
 
Ética y Revolución Digital . revista Diecisiete nº 4. 2021
Ética y Revolución Digital . revista Diecisiete nº 4. 2021Ética y Revolución Digital . revista Diecisiete nº 4. 2021
Ética y Revolución Digital . revista Diecisiete nº 4. 2021
 
#StopBigTechGoverningBigTech . More than 170 Civil Society Groups Worldwide O...
#StopBigTechGoverningBigTech . More than 170 Civil Society Groups Worldwide O...#StopBigTechGoverningBigTech . More than 170 Civil Society Groups Worldwide O...
#StopBigTechGoverningBigTech . More than 170 Civil Society Groups Worldwide O...
 
PACTO POR LA CIENCIA Y LA INNOVACIÓN 8 de febrero de 2021
PACTO POR LA CIENCIA Y LA INNOVACIÓN 8 de febrero de 2021PACTO POR LA CIENCIA Y LA INNOVACIÓN 8 de febrero de 2021
PACTO POR LA CIENCIA Y LA INNOVACIÓN 8 de febrero de 2021
 
Expert Panel of the European Blockchain Observatory and Forum
Expert Panel of the European Blockchain Observatory and ForumExpert Panel of the European Blockchain Observatory and Forum
Expert Panel of the European Blockchain Observatory and Forum
 
Desigualdades educativas derivadas del COVID-19 desde una perspectiva feminis...
Desigualdades educativas derivadas del COVID-19 desde una perspectiva feminis...Desigualdades educativas derivadas del COVID-19 desde una perspectiva feminis...
Desigualdades educativas derivadas del COVID-19 desde una perspectiva feminis...
 
"Experiencias booktuber: Más allá del libro y de la pantalla"
"Experiencias booktuber: Más allá del libro y de la pantalla""Experiencias booktuber: Más allá del libro y de la pantalla"
"Experiencias booktuber: Más allá del libro y de la pantalla"
 
The impact of digital influencers on adolescent identity building.
The impact of digital influencers on adolescent identity building.The impact of digital influencers on adolescent identity building.
The impact of digital influencers on adolescent identity building.
 
Open educational resources (OER) in the Spanish universities
Open educational resources (OER) in the Spanish universitiesOpen educational resources (OER) in the Spanish universities
Open educational resources (OER) in the Spanish universities
 
El modelo flipped classroom: un reto para una enseñanza centrada en el alumno
El modelo flipped classroom: un reto para una enseñanza centrada en el alumnoEl modelo flipped classroom: un reto para una enseñanza centrada en el alumno
El modelo flipped classroom: un reto para una enseñanza centrada en el alumno
 
Pensamiento propio e integración transdisciplinaria en la epistémica social. ...
Pensamiento propio e integración transdisciplinaria en la epistémica social. ...Pensamiento propio e integración transdisciplinaria en la epistémica social. ...
Pensamiento propio e integración transdisciplinaria en la epistémica social. ...
 
Escuela de Robótica de Misiones. Un modelo de educación disruptiva.
Escuela de Robótica de Misiones. Un modelo de educación disruptiva.Escuela de Robótica de Misiones. Un modelo de educación disruptiva.
Escuela de Robótica de Misiones. Un modelo de educación disruptiva.
 
La Universidad española Frente a la pandemia. Actuaciones de Crue Universidad...
La Universidad española Frente a la pandemia. Actuaciones de Crue Universidad...La Universidad española Frente a la pandemia. Actuaciones de Crue Universidad...
La Universidad española Frente a la pandemia. Actuaciones de Crue Universidad...
 
Covid-19 and IoT: Some Perspectives on the Use of IoT Technologies in Prevent...
Covid-19 and IoT: Some Perspectives on the Use of IoT Technologies in Prevent...Covid-19 and IoT: Some Perspectives on the Use of IoT Technologies in Prevent...
Covid-19 and IoT: Some Perspectives on the Use of IoT Technologies in Prevent...
 

Recently uploaded

Jual Obat Aborsi Hongkong ( Asli No.1 ) 085657271886 Obat Penggugur Kandungan...
Jual Obat Aborsi Hongkong ( Asli No.1 ) 085657271886 Obat Penggugur Kandungan...Jual Obat Aborsi Hongkong ( Asli No.1 ) 085657271886 Obat Penggugur Kandungan...
Jual Obat Aborsi Hongkong ( Asli No.1 ) 085657271886 Obat Penggugur Kandungan...
ZurliaSoop
 
Salient Features of India constitution especially power and functions
Salient Features of India constitution especially power and functionsSalient Features of India constitution especially power and functions
Salient Features of India constitution especially power and functions
KarakKing
 

Recently uploaded (20)

Food safety_Challenges food safety laboratories_.pdf
Food safety_Challenges food safety laboratories_.pdfFood safety_Challenges food safety laboratories_.pdf
Food safety_Challenges food safety laboratories_.pdf
 
Basic Civil Engineering first year Notes- Chapter 4 Building.pptx
Basic Civil Engineering first year Notes- Chapter 4 Building.pptxBasic Civil Engineering first year Notes- Chapter 4 Building.pptx
Basic Civil Engineering first year Notes- Chapter 4 Building.pptx
 
Accessible Digital Futures project (20/03/2024)
Accessible Digital Futures project (20/03/2024)Accessible Digital Futures project (20/03/2024)
Accessible Digital Futures project (20/03/2024)
 
Beyond_Borders_Understanding_Anime_and_Manga_Fandom_A_Comprehensive_Audience_...
Beyond_Borders_Understanding_Anime_and_Manga_Fandom_A_Comprehensive_Audience_...Beyond_Borders_Understanding_Anime_and_Manga_Fandom_A_Comprehensive_Audience_...
Beyond_Borders_Understanding_Anime_and_Manga_Fandom_A_Comprehensive_Audience_...
 
Philosophy of china and it's charactistics
Philosophy of china and it's charactisticsPhilosophy of china and it's charactistics
Philosophy of china and it's charactistics
 
This PowerPoint helps students to consider the concept of infinity.
This PowerPoint helps students to consider the concept of infinity.This PowerPoint helps students to consider the concept of infinity.
This PowerPoint helps students to consider the concept of infinity.
 
ICT Role in 21st Century Education & its Challenges.pptx
ICT Role in 21st Century Education & its Challenges.pptxICT Role in 21st Century Education & its Challenges.pptx
ICT Role in 21st Century Education & its Challenges.pptx
 
Towards a code of practice for AI in AT.pptx
Towards a code of practice for AI in AT.pptxTowards a code of practice for AI in AT.pptx
Towards a code of practice for AI in AT.pptx
 
Jual Obat Aborsi Hongkong ( Asli No.1 ) 085657271886 Obat Penggugur Kandungan...
Jual Obat Aborsi Hongkong ( Asli No.1 ) 085657271886 Obat Penggugur Kandungan...Jual Obat Aborsi Hongkong ( Asli No.1 ) 085657271886 Obat Penggugur Kandungan...
Jual Obat Aborsi Hongkong ( Asli No.1 ) 085657271886 Obat Penggugur Kandungan...
 
Basic Intentional Injuries Health Education
Basic Intentional Injuries Health EducationBasic Intentional Injuries Health Education
Basic Intentional Injuries Health Education
 
Kodo Millet PPT made by Ghanshyam bairwa college of Agriculture kumher bhara...
Kodo Millet  PPT made by Ghanshyam bairwa college of Agriculture kumher bhara...Kodo Millet  PPT made by Ghanshyam bairwa college of Agriculture kumher bhara...
Kodo Millet PPT made by Ghanshyam bairwa college of Agriculture kumher bhara...
 
Jamworks pilot and AI at Jisc (20/03/2024)
Jamworks pilot and AI at Jisc (20/03/2024)Jamworks pilot and AI at Jisc (20/03/2024)
Jamworks pilot and AI at Jisc (20/03/2024)
 
Salient Features of India constitution especially power and functions
Salient Features of India constitution especially power and functionsSalient Features of India constitution especially power and functions
Salient Features of India constitution especially power and functions
 
Graduate Outcomes Presentation Slides - English
Graduate Outcomes Presentation Slides - EnglishGraduate Outcomes Presentation Slides - English
Graduate Outcomes Presentation Slides - English
 
Understanding Accommodations and Modifications
Understanding  Accommodations and ModificationsUnderstanding  Accommodations and Modifications
Understanding Accommodations and Modifications
 
COMMUNICATING NEGATIVE NEWS - APPROACHES .pptx
COMMUNICATING NEGATIVE NEWS - APPROACHES .pptxCOMMUNICATING NEGATIVE NEWS - APPROACHES .pptx
COMMUNICATING NEGATIVE NEWS - APPROACHES .pptx
 
How to Manage Global Discount in Odoo 17 POS
How to Manage Global Discount in Odoo 17 POSHow to Manage Global Discount in Odoo 17 POS
How to Manage Global Discount in Odoo 17 POS
 
80 ĐỀ THI THỬ TUYỂN SINH TIẾNG ANH VÀO 10 SỞ GD – ĐT THÀNH PHỐ HỒ CHÍ MINH NĂ...
80 ĐỀ THI THỬ TUYỂN SINH TIẾNG ANH VÀO 10 SỞ GD – ĐT THÀNH PHỐ HỒ CHÍ MINH NĂ...80 ĐỀ THI THỬ TUYỂN SINH TIẾNG ANH VÀO 10 SỞ GD – ĐT THÀNH PHỐ HỒ CHÍ MINH NĂ...
80 ĐỀ THI THỬ TUYỂN SINH TIẾNG ANH VÀO 10 SỞ GD – ĐT THÀNH PHỐ HỒ CHÍ MINH NĂ...
 
How to setup Pycharm environment for Odoo 17.pptx
How to setup Pycharm environment for Odoo 17.pptxHow to setup Pycharm environment for Odoo 17.pptx
How to setup Pycharm environment for Odoo 17.pptx
 
ICT role in 21st century education and it's challenges.
ICT role in 21st century education and it's challenges.ICT role in 21st century education and it's challenges.
ICT role in 21st century education and it's challenges.
 

Slavery, education, and inequality. Graziella Bertocchi & Arcangelo Dimico

  • 1. Slavery, education, and inequality Graziella Bertocchi a,n , Arcangelo Dimico b,1 a University of Modena and Reggio Emilia, CEPR, CHILD and IZA, Dipartimento di Economia Marco Biagi, Viale Berengario, 51, I-41121 Modena, Italy b Queen's University Belfast, Management School, Riddel Hall 185, Sranmillis Rd, BT9 5EE Belfast, UK a r t i c l e i n f o Article history: Received 28 September 2012 Accepted 4 April 2014 Available online 9 May 2014 JEL classification: E02 D02 H52 J15 O11 Keywords: Slavery Inequality Education Institutions a b s t r a c t We investigate the effect of slavery on the current level of income inequality across US counties. We find that a larger proportion of slaves over population in 1860 persistently increases inequality, and in particular inequality across races. We also show that a crucial channel of transmission from slavery to racial inequality is human capital accumulation, i.e., current inequality is primarily influenced by slavery through the unequal educational attainment of blacks and whites. Finally, we provide suggestive evidence that the underlying links run through the political exclusion of former slaves and the resulting negative influence on the local provision of education. & 2014 Elsevier B.V. All rights reserved. 1. Introduction Recent advances in growth theory have debated the long-run determinants of current comparative economic performances. In this paper we address the same issue by investigating the legacy of slavery in the US. Our goal is to assess if, nearly a century and a half after its abolition, this peculiar institution still exerts an influence on the American economy and society. We are especially interested on its potential effect on current inequality. To concentrate on a single country facilitates the empirical investigation on several grounds, since it reduces the risk of omitted variable bias that typically plagues cross-country investigations. At the same time, because of their size and history, the US still presents sufficient variations along both the geographic and the institutional dimensions to make such investigation worthwhile. Slavery was introduced in North America as early as in the sixteenth century and its diffusion escalated throughout the next centuries. Overall, the Middle Passage brought an estimated 645,000 slaves, mostly from Africa, to the territories that today represent the US. Initially most of the slaves were forcibly settled in the coastal Southern colonies, where they were employed primarily in agriculture. Later, between the American Revolution and the Civil War, with the Second Middle Passage around a million slaves were relocated toward the inland regions where the plantation economy was developing (Berlin, 2003). By the 1860 Census the US slave population had grown to four million, to represent about 13% of the entire Contents lists available at ScienceDirect journal homepage: www.elsevier.com/locate/eer European Economic Review http://dx.doi.org/10.1016/j.euroecorev.2014.04.007 0014-2921/& 2014 Elsevier B.V. All rights reserved. n Corresponding author. Tel.: þ39 059 2056856. E-mail addresses: graziella.bertocchi@unimore.it (G. Bertocchi), arcangelo_dimico@hotmail.it (A. Dimico). URL: http://www.economia.unimore.it/bertocchi_graziella (G. Bertocchi). 1 Tel.:þ44 2890974167. European Economic Review 70 (2014) 197–209
  • 2. population, distributed within 15 slave states, mostly in the South. In the same year, almost 90% of the blacks living in the US were slaves. The American Civil War led to the abolition of slavery in 1865. We measure the historical legacy of slavery with the share of slaves over population in 1860 and we find that the current level of income inequality is indeed shaped by it, since the distribution of per capita income is more unequal today in counties associated in the past with a larger proportion of slaves in the population. Moreover, we show that past slavery affects the racial component of inequality, while it is not associated with higher inequality within each race. To investigate the mechanism through which slavery determines current racial inequality, we compare two alternative channels: human capital transmission and racial discrimination. To be noticed is that, at least in principle, these two channels are not mutually exclusive since, as suggested by Sokoloff and Engerman (2000) and Acemoglu et al. (2008a,b), institutional and economic development paths may be interlinked and jointly determined by various factors. For instance, the institution of public schooling, which has been a major vehicle of capital accumulation, may have been more rapid and more effective in the same counties which were less exposed to de facto and de jure discrimination. In evaluating the human capital transmission mechanism, we test the hypothesis that the long-term influence of slavery may run through its negative impact on the educational attainment of blacks relative to those of whites. According to this hypothesis, which is closely associated with Smith (1984) and the literature on race and human capital, the counties more affected by slavery should be associated with worse educational attainment for the black population. For a cross section of counties, our empirical investigation does support this hypothesis. The second channel of transmission we test is motivated by those racial discrimination theories which have emphasized racial differences in the value of skills. Racial discrimination can manifest itself on the schooling dimension, through worse quantity and quality of the education publicly provided, or directly on the labor market, by denying blacks access to certain jobs (see Smith, 1984). We find that the evidence supporting the relevance of this second potential channel of transmission is much weaker than that collected for the first channel. Our empirical findings are confirmed after robustness checks involving other potential confounding factors such as factor endowments, IV estimation, and quasi-experimental evidence. We complete our investigation with a series of reduced forms illustrated by scatter plots which further explore the underlying mechanisms linking slavery to local politics, and in turn to education policies and the resulting racial gap in education. The resulting evidence, together with our previous results, supports the following theory. Slave counties have been persistently characterized by restricted political participation achieved both through de jure and de facto methods. The political exclusion of former slaves resulted in a limited supply of education since, being education locally administered and financed, political exclusion implied undertaxation and reduced funding. Our empirical implementation of the concept of slavery involves the fraction of slaves over population in 1860, which reflects the intensity of the diffusion of this specific form of work organization together with its influence on local institutions. The long-term legacy of slavery can also run through institutional differences, such as national or state-level institutions aimed at protecting property rights in human labor and the associated balance of political power, which may be influential even in the presence of small fractions of slaves even though it should be eliminated by state fixed effects. Despite controlling for de-jure institutional differences using state dummies, we do find the same effect on racial inequality even when we control for the slave share measured in 1800, at a time when small fractions of slaves were still present in some Northern states. We interpret these results as supportive of our empirical strategy. The rest of the paper is organized as follows. In Section 2 we discuss the relevant literature. In Section 3 we examine the effect of slavery on inequality. In Section 4 we explore the channels through which this effect materializes. Section 5 is devoted to a quasi experiment and Section 6 to the reduced-form evidence. In Section 7 we derive our conclusions. 2. Related literature The historiography of slavery in North America is huge. Economic historians have focused on the profitability and the efficiency of slavery. In their provocative and controversial empirical work on the antebellum South, Fogel and Engerman (1974) suggested that slavery was both productive and economically efficient, a conclusion which was criticized, among others, by David and Stampp (1976) and Ransom and Sutch (2001). Lagerlöf (2009) and Acemoglu and Wolitzky (2011) model the economics of labor coercion from a related perspective. Since our goal is to establish whether slavery can be viewed as a deep determinant of long-run development, we contribute to the research line, initiated by Hall and Jones (1999), which has searched for fundamental, rather than proximate, growth factors. Other authors have already focused on the long-term legacy of slavery, in a number of dimensions. While Nunn (2008a) has examined the implications of slave trades in Africa, Engerman and Sokoloff (2005a) and Nunn (2008b) have looked at the impact of slavery in the receiving countries. In particular, on the basis of historical evidence, the former formulate the hypothesis that factor endowments, through large-plantation slavery and other inequality-perpetuating institutions, may have hampered subsequent economic growth. The latter estimates the influence of slavery on the current performances of the US economy at the county level, to find that slave use is negatively correlated with subsequent economic development, but that this relationship is not driven by large-scale plantation slavery, i.e., a more precise measure of factor endowments. He also finds a positive impact of slavery on 1860 land inequality, which is in turn correlated with current income inequality, but no impact of 1860 land inequality on current income, which suggests that inequality may not be the channel of influence running from factor endowments to the current level of development. Mitchener and McLean (2003) find that the legacy of slavery has a strong and persistent effect on G. Bertocchi, A. Dimico / European Economic Review 70 (2014) 197–209198
  • 3. productivity levels, measured as income per worker, across US states in the 1880–1980 period. Lagerlöf (2005) explores the link between geography and slavery and also documents a negative relationship between slavery and current income at the county level for a sample of former slave states. A common conclusion for this stream of the literature is a negative relationship between past slavery and current income per capita across the US states and counties, even though Bertocchi and Dimico (2010) find that this relationship is not robust after controlling for structural differences among the US states and regions. More generally, economic historians have documented how, despite a decline in the immediate aftermath of the Civil War,2 from the mid‐1870s per capita income in the South started to converge to that of the rest of the country, with an acceleration after WW2. The abolition of the Jim Crow Laws in 1964–1965 may have contributed to the process by improving blacks' schooling, skills, occupations, employment rate, and therefore possibly productivity (see Margo, 1990). Indeed Donohue and Heckman (1991) find that governmental anti-discrimination efforts, starting with the 1964 Civil Rights Act, had a substantial impact on the economic status of blacks.3 A separate research line, which is more relevant to our goal, has focused on the impact of race on inequality. This work has documented that, since emancipation and especially since 1940, the average income of black Americans has increased greatly, both in absolute and relative terms. The determinants of the relative improvement of the economic status of blacks after WWII, however, have been the subject of debate. Both the civil rights movement, with its impact on the labor market through affirmative action laws, and long-term changes in human capital have been advanced as possible explanations of the observed trend (Heckman, 1990; Margo, 1990). The main contributions to the line of research on race and human capital are Smith (1984) and Smith and Welch (1989), followed by Margo (1990) and Collins and Margo (2006).4 The evidence collected by these authors documents the evolution of racial differences both in the quality and the quantity of education. After the Civil War, African-Americans had essentially no exposure to formal schooling, as a legacy of the extremely high rates of illiteracy that existed under slavery. The first generations of former slaves were able to complete far fewer years of schooling, on average, than whites and they had access to racially segregated public schools, mostly in the South, where they received a qualitatively inferior education, even if compared to that received by Southern whites.5 Initially the combination of low educational attainment and inferior educational quality determined the persistence of large wage and income gaps. Subsequently, however, the racial schooling gap declined, as successive generations of black children received more and better schooling, with an eventual impact on earnings. Overall, despite the initial conditions and the persistence of discrimination, the reported evidence on the evolution of educational differences, in a wide number of dimensions (such as literacy rates, years of educational attainment, spending per pupil, and returns to literacy), overwhelmingly points to long-term convergence.6 3. Slavery and inequality According to the Engerman and Sokoloff hypothesis, the initial presence of specific factor endowments explains the development of agricultural production techniques based on slave labor, which in turn resulted in extreme economic inequality and in a set of political (Engerman and Sokoloff, 2005b), redistributive (Sokoloff and Zolt, 2007), and educational (Mariscal and Sokoloff, 2000) institutions that reflected this inequality. The link between factor endowments and inequality is also empirically documented. Galor et al. (2009) find evidence that land inequality – which can proxy for factor endowments – adversely affected the emergence of human capital promoting institutions, as measured by educational expenditure across US states in the 1900–1940 period. Vollrath (2013) documents a negative effect of inequality on property tax revenues in 1890. Ramcharan (2010) tests the relationship between land inequality and redistribution and uncovers a significant effect of land inequality on redistributive policies in the 1890–1930 period. Over a cross section of slave counties, Lagerlöf (2005) finds that counties which in 1850 had a larger slave population display higher racial inequality today. However, the link between slavery and current economic and racial inequality still remains unclear. The channel through which this link may have worked is also poorly understood. Given this state of the art, we investigate the long-run effects of slavery on inequality using a sample of US counties (at 1860 boundaries) distributed across 42 states, including 15 slave states. The share of slaves over population in 1860 varies considerably, both across and within states.7 It is highest in South Carolina and Louisiana (at about 55 percent, respectively) and lowest in Delaware and Missouri (at about 2 and 8 percent, respectively). In order to measure inequality, we use a Theil decomposition to decompose the level of income inequality at a county level into two components: inequality across races (between inequality, or racial inequality) and inequality within races 2 See for example Fogel and Engerman (1974) and Ransom and Sutch (2001). Irwin (1994) shows that the decline in labor productivity in the South was positively correlated with the extent of slavery before the Civil War. Evidence of a catch-up between North and South is also presented by Caselli and Coleman (2001). 3 Acemoglu and Robinson (2008) suggest that, at least initially, the impact of the abolition of slavery on the Southern economy was limited by the fact that, after the Civil War, the landed elites managed to maintain economic institutions based on low-skilled, repressed labor through the exercise of de facto political power. 4 See also Goldin and Margo (1992), Goldin (1998), and Goldin and Katz (1999). 5 Naidu (2010) estimates the effect of the nineteenth century disenfranchisement laws for blacks in the South and finds that they are associated with a fall in black educational inputs and thus with low-quality Southern schooling. Bertocchi and Dimico (2012b) find that black disenfranchisement negatively affects black education over a sample of Mississippi counties. 6 A related stream of the literature has measured the long-term influence of family background. See for example Cameron and Heckman (2001) and Sacerdote (2005). 7 See Table A1 in Table Appendix and the Data Appendix for data sources. G. Bertocchi, A. Dimico / European Economic Review 70 (2014) 197–209 199
  • 4. (within inequality).8 Theoretically one should expect a positive effect of slavery on overall inequality, running through inequality across races, since blacks are likely to be confined at the bottom of the income distribution. On the other hand the effect of slavery on within inequality is a priori less clear-cut. While it is likely that there is no effect on income distribution among blacks (for the same reason as above), the effect of slavery on inequality among whites is likely to be more complex. One can expect a positive effect if slavery has contributed to establish a small white elite (former slaveholders) who has preserved its wealth and power over time. On the other hand the effect is likely to be insignificant if political and economic structural changes have washed out such privileges. As a result the overall effect is potentially ambiguous.9 Following Acemoglu et al. (2002) and Nunn (2008b) we also control for population density in 1860 as a proxy for initial prosperity. To be noticed, however, is that our goal is to investigate whether slavery can be viewed as a fundamental, deep determinant of inequality over the long run. Thus, we employ the most parsimonious possible specification, where proximate factors, such as migration, etc. are omitted (see Hall and Jones, 1999).10 In Table 1 we test the relationship between slavery and the current level of overall, between and within income inequality. All specifications include a full set of state dummies. In Model 1 we find that slavery has a positive and significant effect on overall inequality. The effect is economically significant, with an increase in inequality of 0.045 per a 1 percent increase in the share of slaves. In Model 2 we look at inequality between races: the coefficient on slavery is almost unchanged and significant at a 1 percent level. Finally in the Model 3 we look at the effect of slavery on inequality within races and we find it is not significant.11 The long-term influence of slavery can also run through institutional differences such as de jure institutions aimed at protecting property rights in humans.12 The influence of these factors may be powerful even in the presence of small fractions of slaves even though it should be eliminated by state fixed effects. In turn the intensity of slavery, as a form of work organization shaping social and institutional relations, is more likely to reflect the effect of de facto institutions which, according to Key (1964), should be more binding in counties with a larger share of slaves.13 To gain further insight into the relevance of our empirical implementation of the concept of slavery, in the specifications shown in Table 1 we substitute the slave share in 1860 with the slave share in 1800, i.e., measured at a time when several Northern states still had small fractions of slaves. The results from this specification (which we do not report for brevity) still show a significant effect of the slave share on racial inequality, while the effect on within inequality becomes significantly negative and makes the effect on overall inequality insignificant.14 Engerman and Sokoloff (1997, 2005a) have influentially argued that the diffusion of agricultural crops best suited for the employment of slave labor is determined by factor endowments, such as soils, climate, etc., best suited to large-scale plantations. The resulting unequal structure of society has in turn contributed to the evolution of a set of legal, political, and educational institutions meant to preserve the privileges of the elites, which have exerted a persistent impact on economic outcomes long after the abolition of slavery, by determining paths of development characterized by marked inequalities. If this theory is verified, the influence of the legal institution of slavery would come from its association with factor endowments.15 In our context, the latter could be proxied by land inequality, which should in turn reflect the diffusion of those crops that were typical of large-scale plantations and thus of the use of slave labor. To control for this potential historical confound, we construct an index of land inequality similar to the one employed by Lagerlöf (2005), Nunn (2008b), and Galor et al. (2009).16 It is reasonable to expect that, within counties with a prevalence of large-scale plantations and therefore large land inequality, income inequality in mid- nineteenth century was higher, because of the presence of a small white elite and a large share of poor blacks. This in turn implied, in those days, a larger degree of inequality between blacks and whites (Nunn, 2008b). This initial racial inequality may have persisted until the present day and contributed to the higher overall economic inequality, as suggested by our previous results. In Table 2 we insert controls for factor endowments. In Models 1–3 we add the index of land inequality in 1860 to the specifications of Table 1. In Model 1 we find a marginal effect of land inequality on the overall level of inequality in 2000. However, this hardly impacts on the coefficient of the slave share variable. In addition, as Model 3 shows, the marginal effect 8 The decomposition is obtained using the Stata plug in program INEQDECO by Jenkins (1999). 9 Note that the sample represents existing counties in 1860. In these counties whites and blacks together still represent more than 95% of the total population. As a result inequality between races largely captures the difference between whites and blacks. 10 The cross-county correlation between the fraction of slaves in 1860 and the fraction of blacks in 2000 is 0.80. Therefore, despite the massive relocation of blacks from the rural South to the urban North, race and past slavery still appear closely related. In the 1970s there was actually a reversal of black migration flows due to employment and integration opportunities in the South (Ashenfelter and Heckman, 1976). 11 We also experiment with a quadratic form on the share of slaves in 1860. Its effect on racial inequality, which is our main focus, is only marginally significant and still positive. Therefore we retain a linear form in the following models. 12 Einhorn (2002) discusses the links between the US property law and slave property law. 13 Wright (2006) draws a similar distinction between slavery as a form of work organization and slavery as a set of property rights. 14 To verify whether the effect of the slave share on inequality vanishes after accounting for a proxy of current racism, we also add a control for the share of black population in 2000 (as in Lagerlöf, 2005). Despite the fact that the new variable exhibits a positive coefficient on racial inequality, the effect of slavery is confirmed, suggesting that the legacy of slavery may persist through other channels other than racism. See Morgan (1975) for a discussion on the development of slavery and the emergence of racism in colonial Virginia. 15 The direct link between endowments and slavery, where the former are measured by temperature, elevation, and precipitation, has been examined for the US by Lagerlöf (2005). 16 Consistently with the literature the index reflects the size, rather than the value, of land holdings and is calculated using information about the size of each farm (1860 Census). Sizes of farms fall in the following ranges: (1) 9 acres or less, (2) 10–19 acres, (3) 20–49 acres, (4) 50–99 acres, (5) 100–499 acres, (6) 500–999 acres, and (7) 1000 acres or more. We assume that farms are uniformly distributed within each category and for the category of 1000 acres or more we use 1000 acres. G. Bertocchi, A. Dimico / European Economic Review 70 (2014) 197–209200
  • 5. of land inequality on overall inequality is likely to be related to the effect on inequality within races, since there is no effect of land inequality on inequality between races (Model 2). Therefore, although land inequality and slavery are statistically associated their effects on current overall inequality run through different channels.17 Similar results (in regressions which we do not report for brevity) are obtained using alternative measures of inequality in 1860 which are constructed using data on household wealth and the value of real estate holdings from IPUMS. Both controls exert a significant effect on current racial inequality but they hardly affect the coefficient on the share of slaves in 1860. In Models 4–6 of Table 2 we also control for latitude and longitude, which largely explain climatic differences within the US, and for a proxy of soil neutrality (pH) collected from the Harmonized World Soil Database (FAO GeoNetwork). Climate and soil quality should largely determine the crops produced in an area providing a deeper control for crops suitability. The impact of the share of slaves is hardly affected despite a significant effect of latitude on all measures of inequality and a marginal effect of soil neutrality on overall and within inequality. Therefore, the effect of slavery persists even after controlling for the diffusion of large-scale plantations as determined by factor endowments. Identical results obtain in a variant excluding land inequality (which we omit for brevity). Table 1 Slavery and inequality. Estimation method: OLS Model 1 Model 2 Model 3 Dependent variables Overall inequality Racial inequality Within inequality Slaves/population 1860 0.0452nnn (5.96) 0.0492nnn (10.67) À0.00393 (À0.73) Population density 1860 0.00597nnn (5.50) 0.00308nnn (18.23) 0.00289nnn (3.10) Constant 0.251nnn (22.07) 0.00623nnn (4.70) 0.245nnn (19.28) State dummies Yes Yes Yes Observations 1980 1980 1980 R2 0.427 0.334 0.353 Sample All counties All counties All counties Robust t statistics in parentheses. nnn po0.01. nn po0.05. n po0.1. Table 2 Slavery and inequality – controlling for factor endowments. Estimation method: OLS Model 1 Model 2 Model 3 Model 4 Model 5 Model 6 Dependent variables Overall ineq. Racial ineq. Within ineq. Overall ineq. Racial ineq. Within ineq. Slaves/population 1860 0.0468nnn (6.11) 0.0494nnn (10.70) À0.0026 (À0.48) 0.0403nnn (5.37) 0.0477nnn (10.50) À0.00746 (À1.37) Population density 1860 0.00588nnn (5.63) 0.00308nnn (18.30) 0.00280nnn (3.15) 0.00553nnn (5.45) 0.00553nnn (19.77) 0.00297nnn (2.91) Land inequality 1860 0.0214n (1.79) 0.00170 (0.24) 0.0197nn (2.23) 0.00884 (0.74) 0.00884 (À0.35) À0.00250 (1.28) Soil PH 0.00206n (1.79) 0.000564 (1.28) 0.00150n (1.70) Longitude 0.000794 (1.42) 0.000450 (1.49) 0.000344 (0.78) Latitude À0.00574nnn (À8.08) À0.00139nnn (À4.49) À0.00435nnn (À7.27) Constant 0.243nnn (24.61) 0.00263 (0.88) 0.240nnn (25.62) 0.608nnn (8.31) 0.608nnn (3.38) 0.117nnn (7.98) State dummies Yes Yes Yes Yes Yes Yes Observations 1875 1875 1875 1836 1836 1836 R-squared 0.418 0.327 0.343 0.440 0.332 0.369 Sample All counties All counties All counties All counties All counties All counties Robust t statistics in parentheses. nnn po0.01. nn po0.05. n po0.1. 17 According to Wright (2006) this distinction can be the result of different property rights emerging from slave and free labor production systems. G. Bertocchi, A. Dimico / European Economic Review 70 (2014) 197–209 201
  • 6. Our results so far indicate a strong and persistent effect of slavery on current inequality and in particular on current racial inequality. The relationship between slavery, land inequality, and racial inequality may also be biased by omitted variables and measurement error. As a final robustness check we test the effect of slavery in 1860 on the latter using an IV model in order to provide some source of exogenous variation, first to the share of slaves in 1860 and then also to land inequality in 1860, using distinct instruments. Mann (2011) argues that the reason why slavery developed in the US is because of the resistance of African slaves to tropical diseases, and in particular to malaria. Using data on the force and stability of malaria transmission and on malaria endemicity, Esposito (2013) documents a strong cross-sectional correlation between geographic suitability to malaria and the diffusion of slavery across the US counties. Based on these findings, we use a similar instrument for the share of slaves in 1860 based on a proxy of environmental suitability for transmission of malaria falciparum. In order to construct our proxy we use disaggregated GIS data at a 1 km level from the Malaria Atlas Project, which then is aggregated at a county level (1860 boundaries). The resulting index of suitability is a relative measure of the effect of environmental conditions on vectorial capacity and reproductive number which is proxied using a biological model incorporating the impact of climate on vector lifespan and the duration of Plasmodium falciparum sporogeny (Gething et al., 2011). Given that the index is constructed using exogenous variations in climate the environmental hazard is likely to remain constant before and after the introduction of slavery. In addition, unlike Africa, in the US malaria has been eradicated since the 1940s, so that the malaria ecology is unlikely to have a direct impact on current economic outcomes. In principle, as argued by Wright (2006), land inequality could be endogenous to slavery, as slave owners could easily acquire the best lands. Moreover, the relationship between slavery, land inequality, and racial inequality may also be biased by omitted variables and measurement error. Therefore, to gain further insights we use FAO GAEZ data to construct indexes of soil suitability to cotton and tobacco – which normally are associated with scale economies – to construct instruments for land inequality in 1860. Cotton and tobacco have also been associated with the use of slavery. Therefore, in Table 3 we report the pairwise correlation between the presumed endogenous variables and their proposed instruments. Our measure of environmental suitability for malaria falciparum is strongly correlated with the share of slaves in 1860 (0.57) and much less correlated with land inequality in 1860 (0.27). The index of soil suitability to tobacco is correlated strongly with land inequality and only weakly correlated with the share of slaves. The cross-correlation between malaria's and tobacco's suitability is also rather low (0.29). The facts that each of these two candidate instruments is highly correlated with one of the endogenous variables only and that the cross-correlation between instruments is quite low are important in order to disentangle the orthogonal part of the instrument correlated with endogenous variables (Shea, 1997). Cotton suitability on the other hand is quite significantly correlated with both slavery and land inequality, which confirms the evidence that land inequality and slavery were more frequent along the Cotton Belt. In Table 4 we re-estimate Model 2 in Table 2 using an IV estimator where the dependent variable is racial inequality. In Model 1 we only use an instrument for the share of slaves in 1860 and the coefficient on slavery is now much larger and still highly significant. In Model 2 we also instrument for land inequality using soil suitability to tobacco and the coefficient on the share of slaves in 1860 is almost unchanged. In Model 3 we also enter the index of soil suitability to cotton as an additional instrument and the null that the model is not over-identified (Hansen Test) cannot be rejected. Beside diagnostic tests, the suitability of the instruments is also confirmed by the fact that the coefficients on the share of slaves and land inequality are extremely stable across models, which is unlikely to happen if the instruments are endogenous (Wooldridge, 2002) given that it is difficult to have a bias which is systematically the same across specifications.18 Table A2 in the Appendix reports first stage statistics. We find that the effect of the index of malaria suitability on the share of slaves in 1860 is highly significant, while the index of tobacco suitability exerts almost no effect on slavery. The opposite pattern of significance occurs for land inequality. Malaria suitability does not exert any effect on land inequality while tobacco suitability is highly significant. Therefore each instrument has an independent effect on the two endogenous variables providing enough orthogonality between predicted values, as confirmed by the Cragg-Donald F-statistic which is much larger than the critical values in Stock and Yogo (2005). As a result, the instruments are both relevant.19 Table 3 Slavery and factor endowments – pairwise correlations. Slaves Land ineq. Malaria Cotton Tobacco Slaves/population 1860 1.0000 Land inequality 1860 0.1297 1.0000 Climate suitability to malaria F. 0.5744 0.2758 1.0000 Soil suitability to cotton 0.4160 0.3842 0.6910 1.0000 Soil suitability to tobacco 0.1294 0.4591 0.2956 0.0994 1.0000 18 As a falsification exercise we also regress malaria suitability against our best proxy of agricultural conditions (soil neutrality) and we find an insignificant effect of soil pH on malaria, consistent with the idea that the slave share is independent of particular agricultural conditions. 19 IV estimates of Model 5 of Table 2, which involves a longer list of controls for factor endowments, yield identical results. Therefore we refer to Model 2 of Table 2 as a benchmark for the rest of the paper. G. Bertocchi, A. Dimico / European Economic Review 70 (2014) 197–209202
  • 7. 4. Channels of transmission So far we have shown that there is a robust and persistent relationship between slavery and current inequality, particularly on its racial component. In this section we try to understand which is the channel through which this influence manifests itself. While the legacy of slavery for contemporary economic outcomes may have run through multiple channels, ranging from social capital20 and wealth inequality to law enforcement and criminalization, here we focus on two specific mechanisms: racial discrimination and human capital transmission. According to the racial discrimination mechanism, one of the legacies of slavery was a gap in the earnings of blacks which can be attributed to discrimination.21 To test this hypothesis we proceed as follows. We start by creating a measure of racial discrimination. To this end, we estimate returns on education at the county level for blacks and whites through a model akin to a macro-Mincerian equation.22 The estimates are reported in Table A3 in Table Appendix.23 Beside educational attainment, we also control for experience, as proxied by the employment rate and median age for each group, for the proportion of whites and blacks in the labor force, to capture clusters or network effects, and for fixed geographical effects (namely, for counties within North Eastern and South Atlantic states).24 In Table A4 we summarize the descriptive statistics resulting from our estimates. As expected income per capita tends to increase with the level of education. On average, for educated whites income per capita is 71.3 percent higher than for whites who did not complete high school, while for educated blacks income per capita is only 36.5 percent higher. We use predicted returns to construct a proxy of discrimination between blacks and whites which is equal to the ratio of average returns for blacks to average returns for whites. A ratio below one denotes the existence of a possible racial discrimination. According to the human capital transmission channel, the legacy of slavery runs through educational inequality. This happens since blacks, the vast majority of whom descend from slaves with no education (Smith, 1984; Margo, 1990), have accumulated a gap in terms of education which results in inequality between blacks and whites, and in turn in overall inequality. As a preliminary test of this hypothesis, we construct a measure of racial inequality for education,25 based on information on the years of schooling for blacks and whites.26 Table 4 Slavery and racial inequality – IV estimates. Estimation method: IV Model 1 Model 2 Model 3 Dependent variable Racial inequality Slaves/population 1860 0.0915nnn (10.67) 0.0967nnn (9.58) 0.0934nnn (5.58) Population density 1860 0.00304nnn (20.26) 0.00315nnn (14.96) 0.00314nnn (5.79) Land inequality 1860 0.00817 (1.05) À0.0176 (À1.06) À0.0164 (À1.00) Constant À0.00120 (-0.35) 0.01000 (1.38) 0.00949 (1.25) Variables instrumented Slaves Slaves and land ineq. Slaves and land ineq. Instruments Malaria suitability Malaria suitab.þtobacco suitab. Malaria suitab.þtobacco suitab.þcotton suitab. Anderson canon. LR stat. 88.453 67.149 75.977 Cragg Donald F-stat 88.842 33.525 25.336 Stock and Yogo critic. val. 16.38 7.03 13.43 Hansen J-stat. 0.5696 Endogeneity 0.0000 0.0000 0.0190 State dummies Yes Yes Yes Observations 1833 1833 1830 R-squared 0.269 0.247 0.258 Sample All counties All counties All counties Robust t statistics in parentheses. nnn po0.01. nn po0.05. n po0.1. 20 Chay and Munshi (2012) study network formation among blacks after abolition and how it affected their voting and migration behavior. 21 Sundstrom (2007) estimates the white-black earnings gap of men in the South in 1940, adjusting for individual differences in schooling and experience, and finds evidence of discrimination, which depressed black workers' wages and also prevented them from acquiring skills. 22 For a discussion of macro-Mincerian equations see Krueger and Lindahl (2001) and references therein. 23 In order to estimate returns for whites and blacks at the county level we compute separate estimates for the two groups. Data are from the 2000 US Census. 24 The geographic dummies are considered since there is evidence that the vicinity to the coast, in particular to the Atlantic Ocean, has a direct effect on current economic outcomes (see Lagerlöf, 2005). See also Rappaport and Sachs (2003) for an analysis of the coastal concentration of economic activity in the US. 25 Data on educational attainment by race are from the 2000 US Census. For each race we compute the average years of schooling and then we derive a Gini index. 26 See Birdsall and Londono (1997) and Thomas et al. (2002) for cross-country analyses of education Gini indices. G. Bertocchi, A. Dimico / European Economic Review 70 (2014) 197–209 203
  • 8. Table A5 in the Table Appendix reports descriptive statistics for the two proxies we have constructed in order to test the two potential channels. We present these statistics for the entire sample of counties and also for the sub-sample of counties belonging to former slave states. At the mean, the ratio of the expected returns on education we estimated for blacks and whites is 0.51, across all counties. When confined to former slave states, the blacks to whites ratio of returns on education is even smaller, suggesting the presence of more discrimination down in the South. The distribution of education is also more unequal within slave states. In Table 5 we compare our two hypotheses. In Model 1 we regress our measures of racial educational inequality on the previous set of controls and we find a significant effect of the share of slaves, which increases racial inequality in education by almost 0.005 per a standard deviation in the share of slaves. In Model 2 we replace the dependent variable with our measures of racial discrimination in the labor market and we also find that the share of slaves has a significant effect on the black/white ratio of returns on education, by increasing the gap by almost 0.097 per a standard deviation. To test the robustness of these results in Models 3 and 4 we also use an IV estimator using the same set of instruments as in Model 4 in Table 427 and we find that the effect of slavery on racial educational inequality is reinforced, while the coefficient on the returns loses significance. The evidence we collected so far thus leads us to conclude that current income inequality between races is primarily influenced by slavery through the impact exerted by the latter on the unequal educational attainment between races.28 In other words, it is through human capital transmission that slavery determines the cross-county distribution of inequality in the US today. Our results share a number of features with the literature on race and inequality. For example Smith and Welch (1989) find that black relative wages rose from 18 to 35 percent in the 1960–80 period and that education is the overwhelmingly dominant factor in explaining this relative advance, while Card and Krueger (1992) attribute to schooling between 15 and 20 percent of the overall growth in black-white relative earnings between 1960 and 1980. At the same time, Neal (2006) collects evidence suggesting that, even though the black-white educational gaps diminished over most of the twentieth century, this convergence process is still far from complete. Moreover, over a panel dataset covering the 1940–2000 period at the state level, Bertocchi and Dimico (2012a) find that the racial educational gap significantly depends on its 1940 level, which is in turn larger in former slave states: in other words, states with a larger initial gap still have larger racial educational inequality.29 These results are consistent with the present finding that the inequality of education between races is the main determinant of income inequality because of its impact on racial income inequality. Table 5 Slavery and inequality – channels of transmission. Estimation methods: OLS IV Dependent variables Model 1 Model 2 Model 3 Model 4 Racial educational inequality Blacks/whites returns on education Racial educational inequality Blacks/whites returns on education Slaves/population 1860 0.0346nnn (18.60) À0.208nnn (À6.51) 0.0852nnn (11.64) À0.267 (À1.60) Population density 1860 0.00204nnn (6.49) À0.0054nnn (À3.28) 0.00206nnn (6.54) À0.00366nnn (À2.97) Constant 0.0133nnn (3.71) 0.425nnn (7.55) 0.00643n (1.83) 0.680nnn (8.17) Variables instrumented Slaves and land ineq Instruments Malaria suitab.þtobacco suitab.þcotton suitab. Anderson canon. LR stat. 75.41 67.696 Cragg Donald F-stat. 25.143 22.521 Stock and Yogo critic. val. 13.43 13.43 Hansen J-stat 0.2054 0.9249 Endogeneity 0.000 0.0436 State dummies Yes Yes Yes Yes Observations 1849 1803 1805 1759 R-Squared 0.594 0.144 0.323 0.128 Sample All counties All counties All counties All counties Robust t statistics in parentheses. nnn po0.01. nn po0.05. n po0.1. 27 First stages are similar to those presented in Table A2 in Table Appendix. 28 In the context of nineteenth century Puerto Rico, Bobonis and Morrow (2010) find that the abolition of labor coercion reduced laborers' incentives to accumulate human capital. 29 The correlation between the racial gap in education in 1940 and the fraction slaves/population in 1860 is 0.90 at the high-school level and 0.78 at the bachelor-degree level. G. Bertocchi, A. Dimico / European Economic Review 70 (2014) 197–209204
  • 9. 5. A quasi experiment In this section we exploit the exogenous variation in slavery determined by the instruments used for our IV specification to carry out an additional test. According to Engerman and Sokoloff (1997, 2005a) and Mann (2011) slavery largely depends on factor endowments and malaria hazard. Therefore we can exploit this exogenous variation to predict the probability of slavery by using the “discontinuity” in the use of slavery along the a sort of “extended Mason–Dixon line” dividing between slave and non-slave states: in other words, we can match counties which did and did not make use of slavery despite having the same probability of developing a slave society. The discontinuity in the use of slavery can therefore be interpreted as the result of state and local politics only. As a result, if we control for this channel then we should obtain an unbiased estimate of the effect of slavery on inequality. In more details, if we look at counties along the border between slave and non-slave states (as illustrated in Figure A1 in Table Appendix), then counties within slave and non-slave states should be very similar in terms of factor endowments and because of that they should have the same probability of developing slavery. However, only those counties within slave states actually ended up introducing this form of labor coercion, mainly because of differences in state politics. Therefore if within the same sample of counties with a similar probability of developing slavery we manage to control for state politics and state policy variables then we should be able to estimate the counterfactual. From an empirical point of view first we need to match counties which have a similar probability of developing slavery and then we can estimate the effect of the latter on long-term outcomes. This can be done using a propensity score model which is then followed by an OLS estimator. The propensity score model will assign the probability of developing slavery on the basis of factor endowments and will match counties which have a similar probability of developing slavery by choosing the region within a common support. Then we can look at counties within this region in order to understand what would have happened to counties which have not been treated with slavery if they had developed this form of labor coercion. This is done by exploiting the variation in slavery between matched counties as in a sort of county-pair identification model.30 The fact that we use a propensity score to match counties will permit us to have a better matching since counties are chosen on the basis of specific criteria related to slavery and they are not assumed to be a priori identical. As a consequence we will be able to control for any county-specific factor which could be related to slavery (except for those related to state politics and policies) and at the same time we will be able to control for spatial fixed effects in the same way a county-pair identification model does. As usual, clustering at the state-border level allows to control for the correlation across counties sharing the same borders. The basic assumption behind our estimation procedure is conditional independence, which in our case means that there is a set of observed characteristics Z (related to factor endowments and malaria environment) such that the outcome is independent on the probability of slavery conditional on a set of pre-treatment independent variables X. In other words the selection into treatment depends on observables up to a random factor, so that our estimation procedure can be considered as a weaker version of a pure randomization in which the treatment is independent of pre-treated independent variables. Of course there are costs associated with the use of such an estimator. The main one relates to the limited sample size, which in our case is confined to the set of counties along the border between slave and non-slave states. The smaller sample size affects the variation in our main explanatory variable (slavery) given that the use of slavery was largely restricted to the Table 6 Quasi experiment (matching model). Estimation method: OLS Model 1 Model 2 Model 3 Dependent variables Racial inequality Racial educational inequality Blacks/whites returns on edu. Slaves/population 1860 0.0286nnn (4.81) 0.0337nnn (5.10) À0.0747 (À0.63) Population density 1860 0.0539nnn (4.69) 0.0321nnn (6.87) À0.288nn (À2.24) Land inequality 1860 0.0262n (2.00) 0.0225nn (2.54) 0.271 (0.62) Constant À0.00122 (À0.21) À0.00239 (À0.58) 0.385nn (2.55) State dummies Yes Yes Yes Observations 145 143 133 R-Squared 0.497 0.547 0.106 Sample Common support Common support Common support Robust t statistics in parentheses. nnn po0.01. nn po0.05. n po0.1. 30 A county-pair identification strategy has been used among others by Dube et al. (2010) and Naidu (2010), to test the effect of the minimum wage and of disenfranchisement schemes, respectively. G. Bertocchi, A. Dimico / European Economic Review 70 (2014) 197–209 205
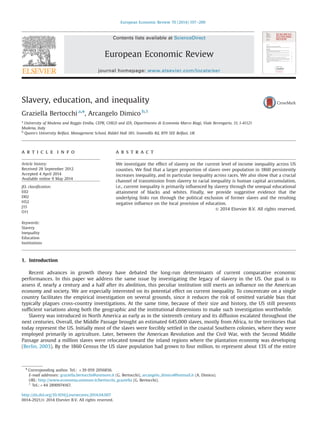
  • 10. deep South. On the other side, this simple quasi experiment will help us to understand what would have happened to counties which used slavery if this form of labor coercion had been banned in the first place. Tables A6 and A7 in Table Appendix show the propensity score model and the distribution of the propensity score in the treatment and matched comparison groups across blocks (Rosenbaum and Rubin, 1983). The difference in mean between counties exposed and not exposed to slavery is not significantly different across blocks, which confirms that the characteristics of the treatment and comparison groups are not significantly different from each other within blocks. This test is particularly important for our analysis given that it ensures that matched counties with and without slavery are exactly the same, so that there are no unobserved characteristics which can affect the estimates once we control for state politics and policies by using a set of state dummy variables. Table 6 provides estimates restricted to the region of common support. In Model 1 we still find a significant effect of slavery on income inequality across races. In Model 2 we test the effect of the share of slaves on racial educational inequality and we can also confirm the significant effect of the former on the latter. In Model 3 we replace the dependent variable with the gap in the returns to education for blacks and whites and, consistently with the IV estimates in Section 4, we do not find a statistical significant effect of slavery, which implies that racial educational inequality is the main channel through which slavery affects the inequality between races. To conclude, our robustness checks confirm the results found in the previous section suggesting that the persistence in the racial gap in education is a crucial channel of transmission from slavery to current inequality within the US. 6. Why education? As outlined in the previous sections one of the main reasons why the effect of slavery on inequality runs through the inequality between races is related to the huge impact that education has on wages (see also Goldin and Katz, 1999). The natural question to ask now is why slavery may have affected education inequality. One of the main reasons is related to local politics and to the close link between them and educational policies. In other words, educational policies as shaped by local politics represent a channel through which the gap in education between whites and blacks has persisted. Using a panel of the US states over the 1940–2000 period Bertocchi and Dimico (2012a) show that a larger educational gap between whites and blacks in 1940 has caused a long-lasting gap in education which still persists today. This gap is the result of the 0 20 40 60 80 100 0 0.2 0.4 0.6 0.8 1 slave_1860 0 20 40 60 80 100 0 0.2 0.4 0.6 0.8 1 slave_1860 0 20 40 60 80 100 0 0.2 0.4 0.6 0.8 1 slave share 1860 0 20 40 60 80 100 0 0.2 0.4 0.6 0.8 1 slave_1860 1900 Presidential Turnout (%) Fitted values 1900 Democratic Vote Share (%) Fitted values 1960 Presidential Turnout (%) Fitted values 1960 Democratic Vote Share (%) Fitted values Fig. 1. Slavery, presidential turnout, and Democratic share. G. Bertocchi, A. Dimico / European Economic Review 70 (2014) 197–209206
  • 11. post-Reconstruction politics and “separate but equal” educational policies. Using data on voting registration for blacks and whites within the state of Mississippi Bertocchi and Dimico (2012b) show that in 1917 the student–teacher ratio for blacks is much higher in counties with lower black registration. This higher ratio is the result of state-funding diversion from black to white pupils. Since local officers in former slave states could use funding for black pupils in order to finance education for white pupils, they applied a lower property tax. The property tax is the principal source of revenue for localities/counties and it also represents the main source of funding for education, with nearly half of all property-tax revenues used for public elementary and secondary education (Kenyon, 2007). Even after the abolition of “separate but equal” counties which used to have a lower property tax still kept a lower tax rate, with a negative effect on public school funding and therefore education for blacks. Plots in Fig. 1 show the relationship between the slave share in 1860 and local politics, in terms of presidential voting turnout and Democratic share.31 The two plots at the top show the relationship for the year 1900, when almost all the Southern states – with the exception of Texas, Alabama, and Virginia – had introduced forms of disenfranchisement for blacks. The plot on the left shows that turnout in counties with a massive share of slaves in 1860 is much smaller than in counties with a lower share of slaves (almost À0.7 percentage points in turnout per a 1 percent increase in the share of slaves) while the plot on the right shows that slavery is also closely associated with a larger share for the Democratic Party which, at the time, represented the interests of the white elites. The two plots at the bottom of the figure show that this relationship still persists until 1960, i.e., until the realignment of party politics and the approval of the Voting Rights Act. Of course one can argue that presidential elections data are not appropriate to evaluate local politics, but in the US presidential turnout has always been the highest if compared to other elections, so that in the worst case scenario results should be downward biased.32 The connection between disenfranchisement of blacks and local politics is confirmed by a more formal analysis in Bertocchi and Dimico (2012b), Naidu (2010) and Acharya et al. (2013), while Acemoglu et al. (2013) offer a survey of the literature on democracy, redistribution and public good provision including education. 0 0.2 0.4 0.6 0 0.2 0.4 0.6 0.8 1 slave_1860 0 2 4 6 8 10 0 0.2 0.4 0.6 0.8 1 slave_1860 1962 Per Capita Property Tax Fitted values 1992 Per Capita Property Tax Fitted values Fig. 2. Slavery and property taxes. 6.5 7 7.5 8 0 0.2 0.4 0.6 0.8 1 slave_1860 1 2 3 4 5 0 0.2 0.4 0.6 0.8 1 slave_1860 Log Total Education Expenditure p.c. (2000) Fitted values 2000 Weighted Average Black Education blk 25+ Fitted values Fig. 3. Slavery and education expenditure. 31 Data on presidential elections are from Clubb et al. (2006). 32 We use data on turnout for presidential elections because historical data on local elections are not available. G. Bertocchi, A. Dimico / European Economic Review 70 (2014) 197–209 207
  • 12. While the above documented political balance of power had broader implications, the next link between slavery and education inequality is to be found in the local nature of education provision and funding. As mentioned above, the property tax is the main source of funding for localities/counties and thus for public education support. Because of the “separate but equal” educational policies applied in Southern states until the 1960s, local officers could divert state funding for blacks to finance education for whites. As a result they could impose a lower property tax and spend less in education. The relationship between slavery and per capita property taxes is shown in plots in Fig. 2 for 1962 (on the left) and 1992 (on the right). The plots show that a larger share of slaves is associated with a smaller per capita tax in 1962 and the relationship still holds in 1992, which implies a sort of persistence in the education policies implemented before and after the abolition of black disenfranchisement. Finally in Fig. 3 on the left we show the relationship between slavery and education expenditure per capita in 2000 (from the National Center for Education Statistics). Education expenditure in 2000 is still negatively affected by slavery. On the right we plot a measure of the average education attainment of the black population over age 25 in 2000 (the source is Census), which is inversely related to past slavery despite the above-mentioned evidence of convergence between blacks and whites in terms of education. While the evidence we have reported in this section of course does not imply causality, it does provide a clear illustration of the strong links between the legacy of slavery, local politics, fiscal policy choices and current education outcomes. 7. Conclusion In this paper we have shown that the legacy of slavery still plays a major role in the US economy and society, since the past use of slave labor persistently affects current inequality, and particularly its racial component. In other words, those US counties that in the past exhibited a higher slave share over population turn out to be still more unequal in the present day. We also show that human capital transmission is a crucial channel through which slavery manifests its legacy. The declared goal of recent reform programs for the American schooling system has been the removal of the persistent racial and ethnic educational gaps that are still pervasive in the US society. This is the case both for No Child Left Behind, the federal education program enacted in 2002 under President Bush, and for Race to the Top, the current program created by President Obama. This goal is consistent with the evidence we provide, showing how deeply educational inequality is rooted in the history of the country. Acknowledgments We would like to thank two anonymous referees, Daron Acemoglu, Costas Azariadis, Roland Benabou, Elena Esposito, Raquel Fernandez, Chiara Gigliarano, Oded Galor, Nippe Lagerlöf, Nathan Nunn, Elias Papaioannou, Dietrich Vollrath, as well as participants at the NBER Summer Institute Workshop on Income Distribution and Macroeconomics, the IV Workshop of the Social Choice Research Group, the PRIN Workshop on Political Institutions and Demographic Dynamics, the Rimini Conference in Economics and Finance, the IX Brucchi Luchino Labour Economics Workshop, the CEPR ESSIM, the IEA, and seminars at the Universities of Nottingham, Glasgow, Göteborg, IMT Lucca, National University of Singapore, and Sheffield, for comments and suggestions. Generous financial support from the Italian University Ministry and Fondazione Cassa Risparmio di Modena is gratefully acknowledged. Appendix A. Supporting information Supplementary data associated with this article can be found in the online version at: http://dx.doi.org/10.1016/j. euroecorev.2014.04.007. References Acemoglu, D., Bautista, M.A., Querubín, P., Robinson, J.A., 2008a. Economic and political inequality in development: the case of Cundinamarca, Colombia. In: Helpman, E. (Ed.), Institutions and Economic Performance, Harvard University Press, Cambridge, pp. 181–245. Acemoglu, D., Johnson, S., Robinson, J.A., Yared, P., 2008b. Income and democracy. Am. Econ. Rev. 98, 808–842. Acemoglu, D., Johnson, S., Robinson, J.A., 2002. Reversal of fortune: geography and institutions in the making of the modern world income distribution. Q. J. Econ. 117, 1231–1294. Acemoglu, D., Naidu, S., Restrepo, P.. Robinson, J.A., 2013, Democracy, Redistribution and Inequality. NBER Working Paper no. 19746. Acemoglu, D., Robinson, J.A., 2008. Persistence of power, elites, and institutions. Am. Econ. Rev. 98, 267–293. Acemoglu, D., Wolitzky, A., 2011. The economics of labor coercion. Econometrica 79, 555–600. Acharya, A., Blackwell, M. and Sen, M., 2013. The Political Legacy of American Slavery. Mimeo. University of Rochester. Ashenfelter, O., Heckman, J.J., 1976. Measuring the effect of an anti-discrimination program. In: Ashenfelter, O., Blum, J. (Eds.), Estimating the Labor Market Effects of Social Programs, Princeton University Press, Princeton, pp. 46–89. Berlin, I., 2003. Generations of Captivity: A History of African American Slaves. Harvard University Press, Cambridge. Bertocchi, G., Dimico, A., 2012a. The racial gap in education and the legacy of slavery. J. Comp. Econ. 40, 581–595. Bertocchi, G., Dimico, A., 2012b, De Jure and de Facto Determinants of Power: Evidence from Mississippi. CEPR Discussion Paper No. 9064. Bertocchi, G., Dimico, A., 2010, Slavery, Education, and Inequality. CEPR Discussion Paper no. 8073. G. Bertocchi, A. Dimico / European Economic Review 70 (2014) 197–209208
  • 13. Birdsall, B., Londono, J.J., 1997. Asset inequality matters: an assessment of the World Bank's approach to poverty reduction. Am. Econ. Rev. Pap. Proc. 87, 32–37. Bobonis, G. J., Morrow, P. M., 2010, Labor Coercion and the Accumulation of Human Capital, mimeo. University of Toronto. Cameron, S.V., Heckman, J.J., 2001. The dynamics of educational attainment for blacks, hispanics, and whites. J. Polit. Econ. 109, 455–499. Card, D., Krueger, A.B., 1992. School quality and black-white relative earnings: a direct assessment. Q. J. Econ. 107, 151–200. Caselli, F., Coleman, W.J., 2001. The U.S. structural transformation and regional convergence: a reinterpretation. J. Polit. Econ. 109, 584–616. Chay, K., Munshi, K., 2012, Black Networks After Emancipation: Evidence from Reconstruction and the Great Migration. Mimeo, Brown University. Clubb, J. M., Flanigan, W. H., Zingale, N. H., 2006. Electoral Data for Counties in the United States: Presidential and Congressional Races, 1840–1972. Inter- university Consortium for Political and Social Research. Collins, W.J., Margo, R.A., 2006. Historical perspectives on racial differences in schooling in the United States. In: Hanushek, E., Welch, F. (Eds.), Handbook of the Economics of Education, Elsevier, New York, pp. 107–154. David, P.A., Stampp, K.M. (Eds.), 1976. , Oxford University Press, New York. Donohue III, J.J., Heckman, J., 1991. Continuous versus episodic change: the impact of Civil Rights Policy on the economic status of Blacks. J. Econ. Lit. 29, 1603–1643. Dube, A., Lester, T.W., Reich, M., 2010. Minimum wage effects across state borders: estimates using contiguous counties. Rev. Econ. Stat. 92, 945–964. Einhorn, R.L., 2002. Patrick Henry's case against the constitution: the structural problem with slavery. J. Early Repub. 22, 549–573. Engerman, S.L., Sokoloff, K.L., 2005a. Institutional and non-institutionals explanations of economic differences. In: Menard, C., Shirley, M.M. (Eds.), Handbook of New Institutional Economics, Springer, Dordrecht, pp. 639–665. Engerman, S.L., Sokoloff, K.L., 2005b. The evolution of suffrage institutions in the Americas. J. Econ. Hist. 65, 891–921. Engerman, S.L., Sokoloff, K.L., 1997. Factor endowments, institutions, and differential paths of growth among new world economies: a view from economic historians of the United States. In: Harber, S. (Ed.), How Latin America Fell Behind, Stanford University Press, Stanford, pp. 260–304. Esposito, E., 2013, Side Effects of Immunities: The African Slave Trade. Mimeo. University of Bologna. Fogel, R.W., Engerman, S.L., 1974. Time on the cross: the economics of American Negro slavery. Little Brown, Boston. Galor, O., Moav, O., Vollrath, D., 2009. Inequality in landownership, the emergence of human-capital promoting institutions, and the great divergence. Rev. Econ. Stud. 76, 143–179. Gething, P.W., Van Boeckel, T.P., Smith, D.L., Guerra, C.A., Patil, A.P., Snow, R.W., Hay, S.I., 2011. Modelling the global constraints of temperature on transmission of Plasmodium falciparum and P. vivax. Parasites Vectors 4, 92–102. Goldin, C., Margo, R.A., 1992. The great compression: the US wage structure at mid-century. Q. J. Econ. 107, 1–34. Goldin, C., 1998. America's graduation from high school: the evolution and spread of secondary schooling in the twentieth century. J. Econ. Hist. 58, 345–374. Goldin, C., Katz, L.F., 1999. The shaping of higher education: the formative years in the Unites States, 1890 to 1940. J. Econ. Perspect. 13, 37–62. Hall, R.E., Jones, C.I., 1999. Why do some countries produce so much more output per worker than others? Q. J. Econ. 114, 83–116. Heckman, J.J., 1990. The central role of the south in accounting for economic progress of black Americans. Am. Econ. Rev. 80, 242–246. Irwin, J.R., 1994. Explaining the decline in southern per capita output after emancipation. Explor. Econ. Hist. 31, 336–356. Jenkins, S.P., 1999. INEQDEC0: Stata Module to Calculate Inequality Indices with Decomposition by Subgroup. Statistical Software Components S366007, Boston College. Kenyon, D.A., 2007. The Property Tax-School Funding Dilemma (Policy Focus Report), CambridgeThe Lincoln Institute of Land Policy. Key, V.O., 1964. In: Politics, Parties and Pressure Groups5th edition Crowell, New York. Krueger, A.B., Lindahl, M., 2001. Education for growth: why and for whom. J. Econ. Lit. 39, 1101–1136. Lagerlöf, N., 2009. Slavery and other property rights. Rev. Econ. Stud. 76, 319–342. Lagerlöf, N., 2005, Geography, Institutions, and Growth: The United States as a Microcosm. Mimeo, York University. Mann, C.C., 2011. 1493: How the Ecological Collision of Europe and the Americas Gave Rise to the Modern World. Granta Books, London. Margo, R.A., 1990. Race and Schooling in the South, 1880–1950: An Economic History. University of Chicago Press, Chicago. Mariscal, E., Sokoloff, K.L., 2000. Schooling, suffrage, and the persistence of inequality in the Americas, 1800–1945. In: Haber, S. (Ed.), Political Institutions and Economic Growth in Latin America: Essays in Policy, History, and Political Economy, Hoover Institution Press, Stanford, pp. 159–218. Mitchener, K.J., McLean, I.W., 2003. The productivity of U.S. states since 1880. J. Econ. Growth 8, 73–114. Morgan, E., 1975. American Slavery, American Freedom: The Ordeal of Colonial Virginia. W. W. Norton & Company, New York, London. Naidu, S., 2010, Suffrage, Schooling, and Sorting in the Post-Bellum U.S. South. Mimeo, Harvard University. Neal, D., 2006. Why Has Black-White skill convergence stopped?. In: Hanushek, E., Welch, F. (Eds.), Handbook of Economics of Education, vol. 1, North- Holland, Amsterdam, pp. 511–576. (Chapter 9). Nunn, N., 2008a. The long-term effects of Africa's slave trades. Q. J. Econ. 123, 139–176. Nunn, N., 2008b. Slavery, inequality, and economic development in the Americas: an examination of the Engerman–Sokoloff Hypothesis. In: Helpman, E. (Ed.), Institutions and Economic Performance, Harvard University Press, Cambridge, pp. 48–180. Ramcharan, R., 2010. Inequality and redistribution: evidence from U.S. counties and states, 1890–1930. Rev. Econ. Stat. 92, 729–744. Ransom, R.L., Sutch, R., 2001. One Kind of Freedom: The Economic Consequences of Emancipation, 2nd edition Cambridge University Press, New York. Rappaport, J., Sachs, J.D., 2003. The United States as a coastal nation. J. Econ. Growth 8, 5–46. Rosenbaum, P.R., Rubin, D.B., 1983. The central role of the propensity score in observational studies for causal effects. Biometrika 70, 41–55. Sacerdote, B., 2005. Slavery and the intergenerational transmission of human capital. Rev. Econ. Stat. 87, 217–234. Shea, J., 1997. Instrument relevance in multivariate linear models: a simple measure. Rev. Econ. Stat. 79, 348–352. Smith, J.P., 1984. Race and human capital. Am. Econ. Rev. 74, 685–698. Smith, J.P., Welch, F.R., 1989. Black economic progress after Myrdal. J. Econ. Lit. 27, 519–564. Sokoloff, K.L., Engerman, S.L., 2000. Institutions, factor endowments, and paths of development in the new world. J. Econ. Perspect. 14, 217–232. Sokoloff, K.L., Zolt, E.M., 2007. Inequality and the evolution of institutions of taxation: evidence from the economic history of the Americas. In: Edwards, S., Esquivel, G., Marquez, G. (Eds.), The Decline of Latin American Economies: Growth, Institutions, and Crises, University of Chicago Press, Chicago, pp. 83–136. Sundstrom, W.A., 2007. The geography of wage discrimination in the pre-civil rights south. J. Econ. Hist. 67, 410–444. Thomas, V., Wang, Y., Fan, X., 2002, A New Dataset on Inequality in Education: Gini and Theil Indices of Schooling for 140 Countries, 1960–2000. Mimeo, World Bank. Vollrath, D., 2013. School funding and inequality in the rural United States, 1890. Explor. Econ. Hist. 50, 267–284. Wooldridge, J.M., 2002. Introductory Econometrics, 2nd edition South-Western, Cincinnati. Wright, G., 2006. Slavery and American Economic Development. Louisiana State University Press, Baton Rouge. G. Bertocchi, A. Dimico / European Economic Review 70 (2014) 197–209 209