South asian history_(visual_inforamtion).
•
1 like•121 views

VISUAL INFORAMTION IN STUDY OF HISTORY

Recommended
More Related Content
Viewers also liked
Viewers also liked (20)
Similar to South asian history_(visual_inforamtion).
Similar to South asian history_(visual_inforamtion). (20)
More from EHSAN KHAN
More from EHSAN KHAN (20)
Recently uploaded
Recently uploaded (20)
South asian history_(visual_inforamtion).
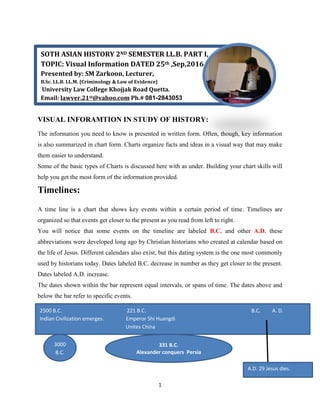
- 1. 1 VISUAL INFORAMTION IN STUDY OF HISTORY: The information you need to know is presented in written form. Often, though, key information is also summarized in chart form. Charts organize facts and ideas in a visual way that may make them easier to understand. Some of the basic types of Charts is discussed here with as under. Building your chart skills will help you get the most form of the information provided. Timelines: A time line is a chart that shows key events within a certain period of time. Timelines are organized so that events get closer to the present as you read from left to right. You will notice that some events on the timeline are labeled B.C. and other A.D. these abbreviations were developed long ago by Christian historians who created at calendar based on the life of Jesus. Different calendars also exist, but this dating system is the one most commonly used by historians today. Dates labeled B.C. decrease in number as they get closer to the present. Dates labeled A.D. increase. The dates shown within the bar represent equal intervals, or spans of time. The dates above and below the bar refer to specific events. SOTH ASIAN HISTORY 2ND SEMESTER LL.B. PART I, TOPIC: Visual Information DATED 25th ,Sep,2016 Presented by: SM Zarkoon, Lecturer, B.Sc. LL.B. LL.M. {Criminology & Law of Evidence} University Law College Khojjak Road Quetta. Email: lawyer.21st@yahoo.com Ph.# 081-2843053 2500 B.C. 221 B.C. B.C. A. D. Indian Civilization emerges. Emperor Shi Huangdi Unites China 3000 B.C. A.D. 29 Jesus dies. 331 B.C. Alexander conquers Persia
- 2. 2 Tables: Tables provide a simple way to organize a large amount of information graphically. A table is arranged in a grid pattern. Columns run vertically, or from top to bottom. Rows run horizontally, or from left to right. Look at the sample table below. It summarizes some basic facts about four early civilizations. The four civilizations are listed in the column on the far left, at the beginning of each row The categories of information given about each civilization are listed at the head of each column. To find information you must read both horizontally and vertically. For example, if you want to find where the Egyptian civilization was located, go to the row labeled Egypt, and then read across to the column labeled Location. Tables can be very large. You may have seen computer spreadsheets that include dozens of rows and columns. Yet all tables follow the basic grid pattern shown here. CIVILIZATOIN LOCATION RIVER(s) EMERGED Mesopotamia Southwest Asia Tigris and Euphrates 3000 B.C. Egypt Northeast Africa Nile 2700 B.C. India Indian Subcontinent Indus 2500 B.C. Shang China East Asia Huang 1650 B.C. Activity: FOUR ANCIENT CIVILIZATIONS. 1. When did shang china emerge? 2. On which river did Egypt depend?
- 3. 3 Flowcharts: As you have read, a timeline is a special type of chart that shows when things happened. A flowchart is a special type of chart that show how one thing leads to another. Many flow charts show a process, or a series of steps that follow one another. To understand a flowchart, begin by reading the first box. Then, follow the arrows to the next event or stage in the process. Sometimes the arrows will lead you back to where you started. This shows that the events are a cycle, or a series of events that keeps repeating. The flowchart below illustrates a process that occurred over and over again in ancient China, as you read, a notice how one step leads to another. New rulers overthrow old ruling family. New ruling family governs well at first Overtime, ruling family becomes weak Poor government leads to problems Government loose support of people RULING CYCYLE IN ANCIENT CHINA
- 4. 4 Social Pyramids: Every civilization had a strict social order. Certain class , or groups, of people had more power and prestige than did other classes. A special chart shows how such societies are organized. This chart is called a social pyramid. In a Social Pyramid , the person or persons with highest rank are shown at the top. The persons with lowest rank are shown at the bottom. Social pyramids get wider as you go from top to bottom. This design shows the highest class usually had the smallest number of people. The social pyramid here shows Egyptian society was organized between 1500 B.C. and 500 B.C., Egypt was ruled by pharaohs. Below the pharaoh, the other people in society each had a place.
- 5. 5 GRAPHS: One common type of visual is the line graph, such as the one shown here. Line graphs indicate changes over time. They are useful or showing information such as population growth or government expenses. In studying ancient times, though, historian has very few exact number to work with.