SlideShare a Scribd company logo
1 of 2
Download to read offline
2011 Normative Data
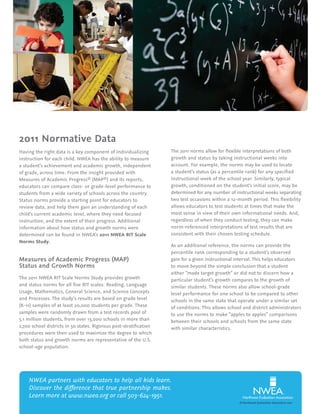
Having the right data is a key component of individualizing
instruction for each child. NWEA has the ability to measure
a student’s achievement and academic growth, independent
of grade, across time. From the insight provided with
Measures of Academic Progress®
(MAP®
) and its reports,
educators can compare class- or grade-level performance to
students from a wide variety of schools across the country.
Status norms provide a starting point for educators to
review data, and help them gain an understanding of each
child’s current academic level, where they need focused
instruction, and the extent of their progress. Additional
information about how status and growth norms were
determined can be found in NWEA’s 2011 NWEA RIT Scale
Norms Study.
Measures of Academic Progress (MAP)
Status and Growth Norms
The 2011 NWEA RIT Scale Norms Study provides growth
and status norms for all five RIT scales: Reading, Language
Usage, Mathematics, General Science, and Science Concepts
and Processes. The study’s results are based on grade level
(K-11) samples of at least 20,000 students per grade. These
samples were randomly drawn from a test records pool of
5.1 million students, from over 13,000 schools in more than
2,700 school districts in 50 states. Rigorous post-stratification
procedures were then used to maximize the degree to which
both status and growth norms are representative of the U.S.
school-age population.
The 2011 norms allow for flexible interpretations of both
growth and status by taking instructional weeks into
account. For example, the norms may be used to locate
a student’s status (as a percentile rank) for any specified
instructional week of the school year. Similarly, typical
growth, conditioned on the student’s initial score, may be
determined for any number of instructional weeks separating
two test occasions within a 12-month period. This flexibility
allows educators to test students at times that make the
most sense in view of their own informational needs. And,
regardless of when they conduct testing, they can make
norm-referenced interpretations of test results that are
consistent with their chosen testing schedule.
As an additional reference, the norms can provide the
percentile rank corresponding to a student’s observed
gain for a given instructional interval. This helps educators
to move beyond the simple conclusion that a student
either “made target growth” or did not to discern how a
particular student’s growth compares to the growth of
similar students. These norms also allow school-grade
level performance for one school to be compared to other
schools in the same state that operate under a similar set
of conditions. This allows school and district administrators
to use the norms to make “apples to apples” comparisons
between their schools and schools from the same state
with similar characteristics.
NWEA partners with educators to help all kids learn.
Discover the difference that true partnership makes.
Learn more at www.nwea.org or call 503-624-1951.
©Northwest Evaluation Association 2011
In the samples, each district’s base school calendar was used to
determine instructional days. Using the instructional days data,
time frames for beginning-of-year tests, middle-of-year tests, and
end-of-year tests were established. The centers of these time frames
were roughly 20 days, 80 days, and 130 days from the beginning of
the academic year of the student’s school for the fall, winter and
spring terms, respectively.
2011 READING STATUS NORMS (RIT VALUES)
Grade
Beginning-of-Year
Mean
Middle-of-Year
Mean
End-of-Year
Mean
k 142.5 151.0 157.7
1 160.3 170.7 176.9
2 175.9 183.6 189.6
3 189.9 194.6 199.2
4 199.8 203.2 206.7
5 207.1 209.8 212.3
6 212.3 214.3 216.4
7 216.3 218.2 219.7
8 219.3 221.2 222.4
9 221.4 221.9 222.9
10 223.2 223.4 223.8
11 223.4 223.5 223.7
2011 MATHEMATICS STATUS NORMS (RIT VALUES)
Grade
Beginning-of-Year
Mean
Middle-of-Year
Mean
End-of-Year
Mean
k 143.7 150.7 159.1
1 162.8 172.4 179.0
2 178.2 185.5 191.3
3 192.1 198.5 203.1
4 203.8 208.7 212.5
5 212.9 217.8 221.0
6 219.6 222.8 225.6
7 225.6 228.2 230.5
8 230.2 232.8 234.5
9 233.8 234.9 236.0
10 234.2 235.5 236.6
11 236.0 237.2 238.3
2011 LANGUAGE USAGE STATUS NORMS (RIT VALUES)
Grade
Beginning-of-Year
Mean
Middle-of-Year
Mean
End-of-Year
Mean
2 175.4 185.3 190.0
3 191.1 196.5 200.3
4 200.9 204.4 207.0
5 208.0 211.0 212.9
6 212.3 214.4 216.2
7 215.8 217.3 218.7
8 218.7 220.2 221.3
9 220.6 221.0 221.8
10 221.9 222.2 222.7
11 222.1 222.7 223.3
2011 GENERAL SCIENCE STATUS NORMS (RIT VALUES)
Grade
Beginning-of-Year
Mean
Middle-of-Year
Mean
End-of-Year
Mean
3 189.0 192.5 195.5
4 196.4 198.7 200.8
5 201.3 203.7 205.3
6 205.4 206.8 208.1
7 208.2 209.5 210.9
8 211.2 212.4 213.5
9 213.2 213.6 214.3
10 214.9 215.6 216.2
2011 SCIENCE CONCEPTS STATUS NORMS (RIT VALUES)
Grade
Beginning-of-Year
Mean
Middle-of-Year
Mean
End-of-Year
Mean
3 188.0 191.7 194.5
4 195.4 197.5 199.5
5 200.6 202.8 204.3
6 204.6 205.9 207.1
7 207.5 208.7 209.9
8 210.4 211.5 212.4
9 213.2 213.6 214.3
10 213.9 214.3 214.6
More Related Content

What's hot

Web 2.0 assessment presentation
Web 2.0 assessment presentation Web 2.0 assessment presentation
Web 2.0 assessment presentation Eric Miles
 
Assessment presentation
Assessment presentationAssessment presentation
Assessment presentationcburchar
 
Maximizing student assessment systems cronin
Maximizing student assessment systems   croninMaximizing student assessment systems   cronin
Maximizing student assessment systems croninNWEA
 
Types of assessments
Types of assessmentsTypes of assessments
Types of assessmentsEEWalsh59
 
Specialist research presentation
Specialist research presentationSpecialist research presentation
Specialist research presentationEtowah High School
 
Getting explicit about reading
Getting explicit about readingGetting explicit about reading
Getting explicit about readingCourtney Huff
 
RHS Explore and Plan Parent Night information presented
RHS Explore and Plan Parent Night information presentedRHS Explore and Plan Parent Night information presented
RHS Explore and Plan Parent Night information presentedjuliedecember
 
Standardized Testing
Standardized TestingStandardized Testing
Standardized TestingMiss EAP
 
compartion between a comparative study and a non-comparative study
compartion between a comparative study and a non-comparative studycompartion between a comparative study and a non-comparative study
compartion between a comparative study and a non-comparative studyu059087
 

What's hot (18)

Web 2.0 assessment presentation
Web 2.0 assessment presentation Web 2.0 assessment presentation
Web 2.0 assessment presentation
 
Assessment presentation
Assessment presentationAssessment presentation
Assessment presentation
 
Evaluation
EvaluationEvaluation
Evaluation
 
Wowzers efficacy
Wowzers efficacyWowzers efficacy
Wowzers efficacy
 
Maximizing student assessment systems cronin
Maximizing student assessment systems   croninMaximizing student assessment systems   cronin
Maximizing student assessment systems cronin
 
Evaluation : Concept, Purpose, and Need
Evaluation : Concept, Purpose, and NeedEvaluation : Concept, Purpose, and Need
Evaluation : Concept, Purpose, and Need
 
Rubrics
RubricsRubrics
Rubrics
 
Cc rfinal
Cc rfinalCc rfinal
Cc rfinal
 
Concept of Evaluation
Concept of EvaluationConcept of Evaluation
Concept of Evaluation
 
Types of assessments
Types of assessmentsTypes of assessments
Types of assessments
 
Specialist research presentation
Specialist research presentationSpecialist research presentation
Specialist research presentation
 
Getting explicit about reading
Getting explicit about readingGetting explicit about reading
Getting explicit about reading
 
RHS Explore and Plan Parent Night information presented
RHS Explore and Plan Parent Night information presentedRHS Explore and Plan Parent Night information presented
RHS Explore and Plan Parent Night information presented
 
Validity
ValidityValidity
Validity
 
Standardized Testing
Standardized TestingStandardized Testing
Standardized Testing
 
Data
DataData
Data
 
compartion between a comparative study and a non-comparative study
compartion between a comparative study and a non-comparative studycompartion between a comparative study and a non-comparative study
compartion between a comparative study and a non-comparative study
 
Exam reform
Exam reformExam reform
Exam reform
 

Viewers also liked

Some useful expressions for the party
Some useful expressions for the partySome useful expressions for the party
Some useful expressions for the partyhelenmazarron
 
circulatory system
circulatory systemcirculatory system
circulatory systemSteph Hanna
 
respiratory system
respiratory systemrespiratory system
respiratory systemSteph Hanna
 
Falsafah pendidikan negara
Falsafah pendidikan negaraFalsafah pendidikan negara
Falsafah pendidikan negaraDee Hamid
 
CC15-317 Halloween News Release_web
CC15-317 Halloween News Release_webCC15-317 Halloween News Release_web
CC15-317 Halloween News Release_webBrittaney C. Major
 
Normes inox
Normes inoxNormes inox
Normes inoxAMI35
 
Primer trabajo individual TC Juan José Arcos Sánchez
Primer trabajo individual TC Juan José Arcos SánchezPrimer trabajo individual TC Juan José Arcos Sánchez
Primer trabajo individual TC Juan José Arcos SánchezJuanjo AS
 

Viewers also liked (10)

1
11
1
 
Some useful expressions for the party
Some useful expressions for the partySome useful expressions for the party
Some useful expressions for the party
 
circulatory system
circulatory systemcirculatory system
circulatory system
 
respiratory system
respiratory systemrespiratory system
respiratory system
 
Afis viscri
Afis viscriAfis viscri
Afis viscri
 
Falsafah pendidikan negara
Falsafah pendidikan negaraFalsafah pendidikan negara
Falsafah pendidikan negara
 
Guia 10
Guia 10Guia 10
Guia 10
 
CC15-317 Halloween News Release_web
CC15-317 Halloween News Release_webCC15-317 Halloween News Release_web
CC15-317 Halloween News Release_web
 
Normes inox
Normes inoxNormes inox
Normes inox
 
Primer trabajo individual TC Juan José Arcos Sánchez
Primer trabajo individual TC Juan José Arcos SánchezPrimer trabajo individual TC Juan José Arcos Sánchez
Primer trabajo individual TC Juan José Arcos Sánchez
 

Similar to 2011 normative data_overview-1

Using Common Assessment Data to Predict High Stakes Performance- An Efficien...
Using Common Assessment Data to Predict High Stakes Performance-  An Efficien...Using Common Assessment Data to Predict High Stakes Performance-  An Efficien...
Using Common Assessment Data to Predict High Stakes Performance- An Efficien...Bethany Silver
 
Parent presentation 2011 12 export
Parent presentation 2011 12 exportParent presentation 2011 12 export
Parent presentation 2011 12 exportJonathan Martin
 
Incerts Network
Incerts NetworkIncerts Network
Incerts NetworkIncerts
 
Map ppt for parents 5.2013
Map ppt for parents 5.2013Map ppt for parents 5.2013
Map ppt for parents 5.2013gurubesar
 
Knowledge, Process, Understanding, Product/Performance
Knowledge, Process, Understanding, Product/PerformanceKnowledge, Process, Understanding, Product/Performance
Knowledge, Process, Understanding, Product/PerformanceKristine Barredo
 
Running head INRODUCTION TO QUANTITATIVE ANALYSIS1Introduction.docx
Running head INRODUCTION TO QUANTITATIVE ANALYSIS1Introduction.docxRunning head INRODUCTION TO QUANTITATIVE ANALYSIS1Introduction.docx
Running head INRODUCTION TO QUANTITATIVE ANALYSIS1Introduction.docxjeanettehully
 
Assesment, Data & Tracking
Assesment, Data & TrackingAssesment, Data & Tracking
Assesment, Data & TrackingaHinchliffe
 
Measuring student academic growth through Value Added methodology: An introd...
Measuring student academic growth through Value Added methodology:  An introd...Measuring student academic growth through Value Added methodology:  An introd...
Measuring student academic growth through Value Added methodology: An introd...F Jenkins
 
PREDICTIVE VALIDITY OF SCHOOL BASED EXAMINATION IN RELATION TO WAEC AND NECO ...
PREDICTIVE VALIDITY OF SCHOOL BASED EXAMINATION IN RELATION TO WAEC AND NECO ...PREDICTIVE VALIDITY OF SCHOOL BASED EXAMINATION IN RELATION TO WAEC AND NECO ...
PREDICTIVE VALIDITY OF SCHOOL BASED EXAMINATION IN RELATION TO WAEC AND NECO ...FRANCIS SOLOMON
 
Teach NJ project SGO presentation 2013-14
Teach NJ project SGO presentation 2013-14Teach NJ project SGO presentation 2013-14
Teach NJ project SGO presentation 2013-14WHSwarriors
 
Assessment and Examination.ppt
Assessment and Examination.pptAssessment and Examination.ppt
Assessment and Examination.pptNasirMahmood976516
 
C:value added
C:value addedC:value added
C:value addedcarol
 
Elementary Progress Report Handbook.11.14
Elementary Progress Report Handbook.11.14Elementary Progress Report Handbook.11.14
Elementary Progress Report Handbook.11.14Susan Domanico
 
Pierce county WAVA - CCSS - Gohen
Pierce county WAVA - CCSS - GohenPierce county WAVA - CCSS - Gohen
Pierce county WAVA - CCSS - Gohenpcwava
 
In the classroom; a summary dialogue
In the classroom; a summary dialogueIn the classroom; a summary dialogue
In the classroom; a summary dialogueIrene Rose Villote
 
overviewaccountabilitymetrics_june2014.ppt
overviewaccountabilitymetrics_june2014.pptoverviewaccountabilitymetrics_june2014.ppt
overviewaccountabilitymetrics_june2014.pptMohamedHendawy17
 
Wyoming Accountability in Education Act - 1/16/14 Presentation
Wyoming Accountability in Education Act - 1/16/14 PresentationWyoming Accountability in Education Act - 1/16/14 Presentation
Wyoming Accountability in Education Act - 1/16/14 PresentationJay Harnack
 

Similar to 2011 normative data_overview-1 (20)

Using Common Assessment Data to Predict High Stakes Performance- An Efficien...
Using Common Assessment Data to Predict High Stakes Performance-  An Efficien...Using Common Assessment Data to Predict High Stakes Performance-  An Efficien...
Using Common Assessment Data to Predict High Stakes Performance- An Efficien...
 
Parent presentation 2011 12 export
Parent presentation 2011 12 exportParent presentation 2011 12 export
Parent presentation 2011 12 export
 
Incerts Network
Incerts NetworkIncerts Network
Incerts Network
 
Map ppt for parents 5.2013
Map ppt for parents 5.2013Map ppt for parents 5.2013
Map ppt for parents 5.2013
 
Va 101 ppt
Va 101 pptVa 101 ppt
Va 101 ppt
 
Knowledge, Process, Understanding, Product/Performance
Knowledge, Process, Understanding, Product/PerformanceKnowledge, Process, Understanding, Product/Performance
Knowledge, Process, Understanding, Product/Performance
 
Running head INRODUCTION TO QUANTITATIVE ANALYSIS1Introduction.docx
Running head INRODUCTION TO QUANTITATIVE ANALYSIS1Introduction.docxRunning head INRODUCTION TO QUANTITATIVE ANALYSIS1Introduction.docx
Running head INRODUCTION TO QUANTITATIVE ANALYSIS1Introduction.docx
 
Assesment, Data & Tracking
Assesment, Data & TrackingAssesment, Data & Tracking
Assesment, Data & Tracking
 
Measuring student academic growth through Value Added methodology: An introd...
Measuring student academic growth through Value Added methodology:  An introd...Measuring student academic growth through Value Added methodology:  An introd...
Measuring student academic growth through Value Added methodology: An introd...
 
PREDICTIVE VALIDITY OF SCHOOL BASED EXAMINATION IN RELATION TO WAEC AND NECO ...
PREDICTIVE VALIDITY OF SCHOOL BASED EXAMINATION IN RELATION TO WAEC AND NECO ...PREDICTIVE VALIDITY OF SCHOOL BASED EXAMINATION IN RELATION TO WAEC AND NECO ...
PREDICTIVE VALIDITY OF SCHOOL BASED EXAMINATION IN RELATION TO WAEC AND NECO ...
 
School_Quality_Guide_2014_EMS_X125
School_Quality_Guide_2014_EMS_X125School_Quality_Guide_2014_EMS_X125
School_Quality_Guide_2014_EMS_X125
 
Teach NJ project SGO presentation 2013-14
Teach NJ project SGO presentation 2013-14Teach NJ project SGO presentation 2013-14
Teach NJ project SGO presentation 2013-14
 
Assessment and Examination.ppt
Assessment and Examination.pptAssessment and Examination.ppt
Assessment and Examination.ppt
 
C:value added
C:value addedC:value added
C:value added
 
Elementary Progress Report Handbook.11.14
Elementary Progress Report Handbook.11.14Elementary Progress Report Handbook.11.14
Elementary Progress Report Handbook.11.14
 
Pierce county WAVA - CCSS - Gohen
Pierce county WAVA - CCSS - GohenPierce county WAVA - CCSS - Gohen
Pierce county WAVA - CCSS - Gohen
 
In the classroom; a summary dialogue
In the classroom; a summary dialogueIn the classroom; a summary dialogue
In the classroom; a summary dialogue
 
overviewaccountabilitymetrics_june2014.ppt
overviewaccountabilitymetrics_june2014.pptoverviewaccountabilitymetrics_june2014.ppt
overviewaccountabilitymetrics_june2014.ppt
 
Wyoming Accountability in Education Act - 1/16/14 Presentation
Wyoming Accountability in Education Act - 1/16/14 PresentationWyoming Accountability in Education Act - 1/16/14 Presentation
Wyoming Accountability in Education Act - 1/16/14 Presentation
 
Sip manual
Sip manualSip manual
Sip manual
 

2011 normative data_overview-1

  • 1. 2011 Normative Data Having the right data is a key component of individualizing instruction for each child. NWEA has the ability to measure a student’s achievement and academic growth, independent of grade, across time. From the insight provided with Measures of Academic Progress® (MAP® ) and its reports, educators can compare class- or grade-level performance to students from a wide variety of schools across the country. Status norms provide a starting point for educators to review data, and help them gain an understanding of each child’s current academic level, where they need focused instruction, and the extent of their progress. Additional information about how status and growth norms were determined can be found in NWEA’s 2011 NWEA RIT Scale Norms Study. Measures of Academic Progress (MAP) Status and Growth Norms The 2011 NWEA RIT Scale Norms Study provides growth and status norms for all five RIT scales: Reading, Language Usage, Mathematics, General Science, and Science Concepts and Processes. The study’s results are based on grade level (K-11) samples of at least 20,000 students per grade. These samples were randomly drawn from a test records pool of 5.1 million students, from over 13,000 schools in more than 2,700 school districts in 50 states. Rigorous post-stratification procedures were then used to maximize the degree to which both status and growth norms are representative of the U.S. school-age population. The 2011 norms allow for flexible interpretations of both growth and status by taking instructional weeks into account. For example, the norms may be used to locate a student’s status (as a percentile rank) for any specified instructional week of the school year. Similarly, typical growth, conditioned on the student’s initial score, may be determined for any number of instructional weeks separating two test occasions within a 12-month period. This flexibility allows educators to test students at times that make the most sense in view of their own informational needs. And, regardless of when they conduct testing, they can make norm-referenced interpretations of test results that are consistent with their chosen testing schedule. As an additional reference, the norms can provide the percentile rank corresponding to a student’s observed gain for a given instructional interval. This helps educators to move beyond the simple conclusion that a student either “made target growth” or did not to discern how a particular student’s growth compares to the growth of similar students. These norms also allow school-grade level performance for one school to be compared to other schools in the same state that operate under a similar set of conditions. This allows school and district administrators to use the norms to make “apples to apples” comparisons between their schools and schools from the same state with similar characteristics. NWEA partners with educators to help all kids learn. Discover the difference that true partnership makes. Learn more at www.nwea.org or call 503-624-1951. ©Northwest Evaluation Association 2011
  • 2. In the samples, each district’s base school calendar was used to determine instructional days. Using the instructional days data, time frames for beginning-of-year tests, middle-of-year tests, and end-of-year tests were established. The centers of these time frames were roughly 20 days, 80 days, and 130 days from the beginning of the academic year of the student’s school for the fall, winter and spring terms, respectively. 2011 READING STATUS NORMS (RIT VALUES) Grade Beginning-of-Year Mean Middle-of-Year Mean End-of-Year Mean k 142.5 151.0 157.7 1 160.3 170.7 176.9 2 175.9 183.6 189.6 3 189.9 194.6 199.2 4 199.8 203.2 206.7 5 207.1 209.8 212.3 6 212.3 214.3 216.4 7 216.3 218.2 219.7 8 219.3 221.2 222.4 9 221.4 221.9 222.9 10 223.2 223.4 223.8 11 223.4 223.5 223.7 2011 MATHEMATICS STATUS NORMS (RIT VALUES) Grade Beginning-of-Year Mean Middle-of-Year Mean End-of-Year Mean k 143.7 150.7 159.1 1 162.8 172.4 179.0 2 178.2 185.5 191.3 3 192.1 198.5 203.1 4 203.8 208.7 212.5 5 212.9 217.8 221.0 6 219.6 222.8 225.6 7 225.6 228.2 230.5 8 230.2 232.8 234.5 9 233.8 234.9 236.0 10 234.2 235.5 236.6 11 236.0 237.2 238.3 2011 LANGUAGE USAGE STATUS NORMS (RIT VALUES) Grade Beginning-of-Year Mean Middle-of-Year Mean End-of-Year Mean 2 175.4 185.3 190.0 3 191.1 196.5 200.3 4 200.9 204.4 207.0 5 208.0 211.0 212.9 6 212.3 214.4 216.2 7 215.8 217.3 218.7 8 218.7 220.2 221.3 9 220.6 221.0 221.8 10 221.9 222.2 222.7 11 222.1 222.7 223.3 2011 GENERAL SCIENCE STATUS NORMS (RIT VALUES) Grade Beginning-of-Year Mean Middle-of-Year Mean End-of-Year Mean 3 189.0 192.5 195.5 4 196.4 198.7 200.8 5 201.3 203.7 205.3 6 205.4 206.8 208.1 7 208.2 209.5 210.9 8 211.2 212.4 213.5 9 213.2 213.6 214.3 10 214.9 215.6 216.2 2011 SCIENCE CONCEPTS STATUS NORMS (RIT VALUES) Grade Beginning-of-Year Mean Middle-of-Year Mean End-of-Year Mean 3 188.0 191.7 194.5 4 195.4 197.5 199.5 5 200.6 202.8 204.3 6 204.6 205.9 207.1 7 207.5 208.7 209.9 8 210.4 211.5 212.4 9 213.2 213.6 214.3 10 213.9 214.3 214.6