Third Quarter 2008 Earnings Conference Call Transcript
WIG - June 2014 Annual Financial Report
1. 00196011
955111
002012
050520002
000000002
5599519
0990990199
585985199
8098019
7575197
7001971
5519651
Industrial
and
property
boom
Strong
commodity
prices and
trade balance
Oil,
mining
and
Poseidon
booms
Tech
wreck
Superannuation
Guarantee
introduced.
Strong
overseas
investment
and property
boom.
Commodity
prices recover.
Industrial
rationalisation.Oil, gas
and
nickel
discoveries
1960
credit
squeeze
US
Credit
crisis
A$ falls 30%.
Commodity
prices fall.
Global
sharemarkets
fall in value.
Sept 11
Terrorist
attacks
on US.
US/Europe
equity
bubble
bursts,
overseas
markets
fall 70%.
World
share
price
collapse.
Property
boom.
Deregulation.
Credit boom.
Commodities
lift
.
$A
floated
CBD
property
crash hits
banks.
Recession.
Interest rates
and inflation
fall.
Privatisation
starts.
10
20
40
60
80
100
120
140
160
180
200
300
400
600
800
1000
1200
1400
1600
1800
2000
2200
3000
4000
5000
6000
7000
Energy
and metal
shares
boom
Commodities
plunge.
Interest
rates
peak.
Severe
recession.
Rising
deficit.
OPEC oil crisis,
inflation, credit
squeeze. Property
company failures.
Bond yields at
20 year low. Banks
and media revive.
EC currency turmoil.
Gold price up.
Inflation
down.
Industrials
recover.
Commodities
weak.
$A fall
attracts
overseas
investors.
01 JAN TO
30 JUN 2009
Wilson HTM
Investment
Group Ltd
Annual Report 2009
2009
Forpersonaluseonly
2. Performance
Our Investment
Philosophy
Eliminating biases
through our integrated
investment process
Energetic and
thorough research
using the three“c’s”:
- company;
- competitors; and
- customers.
Identifying high
growth industries early
Selecting the best of
breed – companies and
people
Peer accountability
through measurement
of predictions
Valuation not
momentum
Putting our money
where our mouth is –
risk heightens focus
Wilson HTM
Priority Growth
Fund
Embodies our
investment philosophy
Capturing of the ideas
generated across the
business
Accessing 45 research,
corporate finance and
investment
professionals
Wilson HTM has over
110 years of experience
guiding investors
through all market
cycles
No.1 ranked Australian
Equity Fund* with a
26.6% p.a. return since
inception to 30 June
2009^
Footnotes are referenced in inside back cover.
Forpersonaluseonly
3. Performance is our Priority
Our Flagship
Priority Growth Fund performance
Alpha through 30 June 2009
Benchmark: S&P/ASX Small Ordinaries Accumulation Index
Inception date: 4 Jul 2005
6 month 1 year 3 year Since inception
0%
5%
10%
15%
20%
25%
30%
35%
40%
45%
50%
Bespoke
investment
solutions
Authorised Investment Manager (AIM) AEQ
Alpha through 30 June 2009
Wilson HTM AIM AEQ Benchmark is made up of 92% S&P/ASX 300 Accumulation Index
(ex property trusts), 5% S&P/ASX 300 Property Trusts Accumulation Index, and 3% 30 Day
Bank Bill Swap Rate.
6 month 1 year 3 year 5 year 10 year
0%
5%
10%
15%
20%
25%
30%
35%
40%
45%
50%
Diversified
portfolio
of boutiques
Pinnacle funds performance
Alpha through 30 June 2009
Plato Core RCL Core Solaris CoreHyperion AEQ
Benchmarks:
Hyperion AEQ - S&P/ASX 300 Accumulation Index. Inception date was on 1 November 1996.
Plato Core - S&P/ASX 300 Accumulation Index. Inception date was on 30 October 2006
RCL Core - S&P/ASX 200 Property Trust Accumulation Index
Solaris Core - S&P/ASX 200 Accumulation Index. Inception date was on 9 January 2008
1 year 3 year 5 year 10 year Since inception6 month
-10%
45%
40%
35%
30%
25%
20%
15%
10%
5%
0%
-5%
50%
Pinnacle
Wilson HTM
Forpersonaluseonly
5. 2
WilsonHTMInvestmentGroupLtd2009AnnualReport
Executive Chairman’s Letter
Dear Shareholder,
Last year I commented that 2008 was a year of two halves, a good first and poor second caused by
very poor stockmarket performance. That was mild compared with the year in review, 2009. Now we
can reflect upon a period of share price collapses only rivalled by 1974 and 1931. Such turmoil tests all
business models and ours has been no exception.
Our Managing Director comments on the year in detail and whilst our profits are sharply lower it is
encouraging that the measures of success we have most ability to control, client alpha and FUM growth,
have both recorded excellent results.
We consider that the worst of the financial markets are now behind us and have continued to steer our
business, as we do our advice to clients, towards long term value growth. To this end we have grown the
total scale of the business by significant growth in Pinnacle Investment Management, boosting support
to the Wilson HTM Priority Growth Fund and the acquisition of Next Financial.
At the same time we are committing to improvements in the infrastructure of Capital Markets and where
cuts have been necessary they have been less than our main competitors.
Prudently managed, we see the current down market as an opportunity to position the Company for
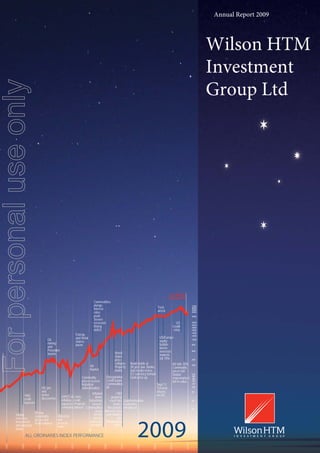
much higher profits, dividends and share price in the future as inevitably the cycle turns. The graph
on the front cover is a reminder that the Australian sharemarket has always retraced its losses to reach
sustainable new highs.
None of our views matter much if we cannot translate our thoughts into results for clients. This
commitment to deliver client performance has always been our core promise. I am very pleased to again
report excellent numbers as shown in the tables preceding my letter. The performance of the Priority
Growth Fund deserves special mention as its return for the year of positive 8.8% versus benchmark
of negative (28.6%) is exemplary but highlights that the diligent and selective approach taken by our
analysts in Research and Corporate Finance is worthwhile.
Ideas, hard work, energy and some pain are produced by our people for the benefit of clients and
shareholders. I thank you all for sticking with us during this extraordinarily tough year. I also thank my
Board colleagues for putting in an extra effort which has helped us govern and position for growth
much better than so many giant household names in the financial services sector.
We have been committed to service and results since 1895 and I am confident that there are many more
years of prudent outperformance ahead.
Yours sincerely,
Steven Wilson
EXECUTIVE CHAIRMAN
WILSON HTM INVESTMENT GROUP LTD
ExecutiveChairman’sLetter
Forpersonaluseonly
6. WilsonHTMInvestmentGroupLtd2009AnnualReport
Wilson HTM Investment Group NPAT of $2.2 million vs $12 million in FY2008
NPAT in established businesses (including Next Financial) of $7.4 million
FUM CAGR since 2004 is 39.7%
Note: WIG listed on the ASX on 19 June 2007
WIG share price has tracked its peer group
How we performed in FY2009
$0.00
$0.50
$1.00
$1.50
$2.00
$2.50
Jun-07 Dec-07 Jun-08 Dec-08 Jun-09
WIG Share Price vs S&P/ASX 200 Financials Index since listing (value of $1 invested)
WIG S&P/ASX 200 Financials
3
ExecutiveChairman’sLetterWilsonHTMInvestmentGroupLtd2009AnnualReport
Wilson HTM Investment Group Ltd - Net Revenue & NPAT
0
2
4
6
8
10
12
14
16
18
20
0
10
20
30
40
50
60
70
80
90
100
110
120
130
140
FY04 FY05 FY06 FY07 FY08 FY09
NPAT($million)
Revenue($million)
Advisory Transactional NPAT NPAT - Established business
56.4
85.2
94.1
131.7
124.7
85.7
Wilson HTM Investment Group Ltd FUM Growth
0.7 0.9
1.3
2.0 1.8 2.00.5
0.6
1.0
1.7
3.5
4.4
1.2
1.5
2.3
3.7
5.3
6.4
0.0
1.0
2.0
3.0
4.0
5.0
6.0
7.0
8.0
Jun 04 Jun 05 Jun 06 Jun 07 Jun 08 Jun 09
$billions
Wilson HTM Pinnacle
Forpersonaluseonly
7. 4
WilsonHTMInvestmentGroupLtd2009AnnualReport
Dear Shareholder,
The 2009 financial year was an important year in the history of the financial markets, also in the history
of our business. It was a year which tested our investment group model, challenged our FUM growth
strategy and on the Capital Markets side of the business, our growth company focus.
During this period the Company’s established business Wilson HTM achieved a net profit after tax of
$7.4 million. The continued investment in Pinnacle Investment Management (Pinnacle) ($4.7 million) and
losses on Principal Investments ($0.5 million), reduced the net profit after tax attributable to shareholders
for the year to $2.2 million.
We consider this to be a solid performance in the context of the financial environment which included
historic falls across all global financial market indices. During the period, the All Ordinaries index fell by
41% from 1 July 2008 to a low of 3112 on 6 of March 2009. This sharp decline significantly curbed trading
volumes and slowed equity capital market activity, particularly impacting the small/mid cap sector.
From the March 2009 low to the end of FY2009, the All Ordinaries recovered 27% to end the year down
26%. The recovery in the markets supported a reversal in the $4.9 million pre-tax loss (after minorities)
incurred by Principal Investments at the 2009 half year and resulted in a full year loss from those
investments of $0.7 million before tax.
Performance fee revenues rose to $4.4 million as a result of alpha achieved in the Wilson HTM Priority
Growth Fund as well as in client funds managed by Wilson HTM’s Authorised Investment Managers.
The Company’s integration of the Next Financial business, which was acquired in April, is proceeding
according to plan.
During the year, the Group continued to invest in Pinnacle Investment Management (Pinnacle) which has
established a foundation of quality investment boutiques with a track record of performance.
Garry Lowrey, Managing Director
Wilson HTM Investment Group Ltd
Managing Director’s Report
NPAT($million)
0
2
4
6
8
10
12
14
16
18
20
0
10
20
30
40
50
60
70
80
90
100
110
120
130
140
FY04 FY05 FY06 FY07 FY08 FY09
Transactional Advisory Performance Fee
Principal Investments/Other Next Financial (net revenue) NPAT
NPAT - Established business
56.4
85.2
94.1
131.7 124.7
85.7
Revenue($million)
Wilson HTM Investment Group Ltd - Net Revenue & NPAT
ManagingDirector’sReport
Forpersonaluseonly
8. 5
WilsonHTMInvestmentGroupLtd2009AnnualReport
Group FUM as at 30 June 2009 rose by 21% to $6.4 billion versus
$5.3 billion in the prior year. FUM growth was driven largely by
net inflows across the Pinnacle boutiques and the acquisition of
Next Financial. At the end of FY2009 Pinnacle had $4.4 billion in
FUM.
Wilson HTM Investment Group Ltd FUM Growth
0.7 0.9
1.3
2.0 1.8
1.3
0.7
0.5 0.6
1.0
1.7
3.5
4.4
1.2
1.5
2.3
3.7
5.3
6.4
0.0
1.0
2.0
3.0
4.0
5.0
6.0
7.0
8.0
Jun 04 Jun 05 Jun 06 Jun 07 Jun 08 Jun 09
$billions
Wilson HTM Next Financial Pinnacle
I will now provide further detail on the financial and operational
performance of the Company’s Capital Markets and Investment
Management business segments.
Financial Performance
Capital Markets
Capital Markets Revenue & Profit before Tax
42.6
69.4 71.7
82.4
87.9
51.7
0.0
2.0
4.0
6.0
8.0
10.0
12.0
14.0
16.0
18.0
20.0
0.0
10.0
20.0
30.0
40.0
50.0
60.0
70.0
80.0
90.0
100.0
FY04 FY05 FY06 FY07 FY08 FY09
ProfitBeforeTax($million)
Revenue($million)
Total Revenue Profit Before Tax
Our Capital Markets business focuses on Australian growth
companies primarily in the mid-market. Capital Markets revenues
declined by 41% to $51.7 million, profit before tax also declined by
80% to $2.5 million.
With the poor market conditions, both the Institutional and Private
Wealth Management stockbroking transaction volumes declined,
and equity capital markets activity slowed. Wilson HTM Corporate
Finance, however, remained active in mergers and acquisitions
and other strategic advisory roles.
Equity capital markets activity for much of the year was slow with
some pick-up in activity experienced closer to the end of the last
quarter of FY 2009.
Five mergers and acquisitions transactions were completed during
the year valued at over $1.8 billion. In Equity Capital Markets,
Sole Lead or Joint Lead Managed equity raisings totalled over
$120 million while other external equity raisings totalled over $54
million.
Investment Management
Investment Management Net Revenue & Profit before Tax
In Investment Management, the operating environment,
characterised by high levels of market volatility, impacted FUM
balances and resulted in a decline in advisory revenue over the
prior year.
Investment Management Net Revenues declined 8% to $34.0
million ($36.8 million in FY2008). Profit before tax in established
business increased by 9% to $5.8 million ($5.3 m FY2008)
Declines in advisory revenue were offset to some extent by
performance fees generated by both the Wilson HTM Priority
Growth Fund and funds managed by Authorised Investment
Managers within the Private Wealth Management business. Net
Revenues of $3.8 million were also achieved in the Next Financial
business which was acquired in April 2009.
Impact of Principal Investments in FY2009
Principal Investments are investments the Company makes as
principal in:
Seed FUM in Wilson HTM Specialty Funds and Pinnacle’s•
boutiques; and
Selected direct equity investments that are a function of the•
Company’s Equity Capital Markets transactions.
It is the Company’s strategy to provide seed FUM to Pinnacle
boutiques in start-up phase as well as similarly placed Wilson HTM
Specialty Funds, to enable those funds to establish performance
track records.
Whilst these are medium to long-term investments, holdings
are required to be revalued to current market values, with the
resulting gains or losses being taken to the profit and loss account.
Consistent with its strategy to build the Pinnacle business, the
Company employed hedging strategies to insulate its profitability
from any mark-to-market losses that may result from those
investments.
The recovery in the equity markets in the fourth quarter of
FY2009 had a positive impact on Principal Investments which had
reported a $4.9 million pre-tax loss (after minorities) at the half
year. This loss was reduced to $0.7 million before tax at the end of
FY2009.
Operational Review
Capital Markets
Within Capital Markets our strategy is to identify, through detailed
analysis and screening, high growth and high performance
companies, primarily in the mid-market, in industry segments
expected to outperform the broader economy. Over FY2009,
Research provided coverage on some 140 companies across
Energy and Resources, Industrial, Healthcare and LifeScience,
Financial Services, Infrastructure, Utilities and Clean Energy.
Whilst some of those segments, such as Energy (in particular Coal
Seam Gas) performed exceptionally well during the year, others
such as LifeSciences, Infrastructure, Utilities and Financial Services
were weighed down by investor aversion to riskier industries and
a scarcity of capital. Slower global growth reduced demand for
commodities, resulting in lower prices and slower activity across
both the Resources and Mining Services segments. Locally,
economic growth and fears of global recession undermined Mid-
cap Industrials and IT Services.
Research
The Company’s Research team comprises one of Australia’s largest
dedicated mid-market research teams. Through our Research
capability we have been able to identify emerging segments such
as Coal Seam Gas, which had another year of exceptional growth
and delivered similarly exceptional returns for our clients.
The quality of the insight generated by our Research is
underpinned by an in depth understanding developed through
fundamental analysis of the industry segments they cover. Our
industry sector team leaders have on average over 16 years of
industry and financial market experience.
ManagingDirector’sReportWilsonHTMInvestmentGroupLtd2009AnnualReport
13.8
15.4
22.3
36.8
34.0
0
2
4
6
8
10
12
14
16
18
20
22
24
26
28
30
0
10
20
30
40
50
60
70
FY04 FY05 FY06 FY07 FY08 FY09
Advisory Revenue
Performance Fee
Next Financial (Net Revenue)
Profit Before Tax
Principal Investments m-t-m
Profit before tax - Established Business
49.3
Revenue($million)
ProfitbeforeTax($millions)
Forpersonaluseonly
9. 6
WilsonHTMInvestmentGroupLtd2009AnnualReport
Managing Director’s Report
- Continued
Corporate Finance
Despite the market environment over the 2009 financial year, we
continued to grow the strength and skills of the Corporate Finance
and Equity Capital Markets teams. The strategy of focusing on
growth industries and the provision of both strategic advice and
capital markets expertise was rewarded with a number of quality
mandates.
Continuing to support our core industries
Every year the Company supports its clients and industry
segments through its investor conference program. This year,
notwithstanding the challenging market conditions we held
three industry conferences including, our annual LifeSciences
Conference, Focus on Coal, and Focus on Oil and Gas. We were
very encouraged by the continued strong attendance levels at
each of these events and have received feedback from both our
Corporate and Institutional clients that these are valued.
Nearly 250 clients and staff attended these conferences. The 35
industry specialists provided expert commentary, analysis and
significant insight to their respective market niches. The Company
acknowledges the importance of these forums and looks forward
to continuing its investor conference program in FY2010.
In addition to our internal conferences we continued to support
external forums that we know are valuable to our corporate
clients and the industries they operate in, such as McCloskey’s coal
conferences and BioShares annual Bio-tech conference.
Investment Management
Wilson HTM Priority Growth Fund Performance
– through 30 June 2009
-40%
-30%
-20%
-10%
0%
10%
20%
30%
40%
50%
60%
6 Month 1 Year 3 Year Since Inception
Priority Growth Fund S&P/ASX Small Ordinaries Accumulation Index
Benchmark: S&P/ASX Small Ordinaries Accumulation Index
Inception date: 4 Jul 2005
Returns are expressed gross of fees
As at 30 June 2009, the Wilson HTM Priority Growth fund had
FUM of $61 million and has again outperformed its benchmark,
the S&P/ASX Small Ordinaries Index. In the year to 30 June 2009,
Wilson HTM Priority Growth achieved alpha of 45%. The Wilson
HTM Priority Growth fund has also out-performed its benchmark
every year since its inception in FY2006. This is an enviable track
record which is increasingly attracting the attention of some of the
industry’s leading research houses, including Morningstar which
now ranks Priority Growth in Australia’s top performing funds.
Equity Issues and
M&A Transactions
FY2009
$60,000,000
Adviser to British American
Tobacco (Australia) on its
divestment of Anzpac Services
(Australia) Pty Ltd
October 2008
British American Tobacco
(Australia)
$ Undisclosed
Adviser to CHAMP Private
Equity in relation to its
acquisition of
LCR Lindores Group
August 2008
$1.1 billion
Adviser to Sunshine Gas
on a takeover offer by
Queensland Gas Company
November 2008
~$32,000,000
Wilson HTM Corporate
Finance adviser to
Wilson HTM Investment
Group on the purchase
of 100% of the issued capital
of Next Financial Limited
April 2009
$528,400,000
(value of 14.81% not owned
at offer price)
Adviser to Cleveland-Cliffs
on its acquisition of remaining
shares in Portman Limited
November 2008
$9,300,000
Placement & Rights Issue
Lead Manager
June/July 2009
$6,900,000
Placement & Rights Issue
Lead Manager
June/July 2009
$47,000,000
Placement
Lead Manager
June 2009
$14,000,000
Placement & Rights Issue
Joint Lead Manager
February 2009
$9,800,000
Placement
Joint Lead Manager
February 2009
$12,000,000
Placement & Rights Issue
Lead Manager
June 2009
$21,300,000
Placement & NR Rights Issue
Lead Manager
June 2009
Comet Ridge
$7,900,000
NR Rights Issue
Lead Manager
December 2008
ManagingDirector’sReport
Forpersonaluseonly
10. 7
Authorised Investment Manager (AIM) AEQ Performance –
through 30 June 2009
-40%
-30%
-20%
-10%
0%
10%
20%
30%
40%
50%
60%
6 Month 1 Year 3 Year 5 Year 10 Year
AIM AIM AEQ Benchmark
Wilson HTM AIM AEQ Benchmark is made up of 92% S&P/ASX 300 Accumulation Index (ex
property trusts), 5% S&P/ASX 300 Property Trusts Accumulation Index, and 3% 30 Day Bank
Bill Swap Rate.
Returns are expressed gross of fees.
FUM managed across our Private Wealth Management Private
Portfolio Discretionary, Non-Discretionary and externally managed
products declined as a result of poor market returns and net fund
outflows.
Private Portfolio Discretionary products are managed by the
Company’s Authorised Investment Managers (AIMs), of which
there were 14 at the end of FY2009. All AIMs are accredited
investment professionals whose performance is closely monitored.
Portfolios are tailored to specific clients’ needs and AIMs can
access ideas and participate, on behalf of clients, in opportunities
that are generated by the Company’s Capital Markets business.
This has assisted our AIMs to generate alpha for clients
every year since inception. This financial year the AIM AEQ
delivered exceptional performance generating alpha of 10%
notwithstanding the challenging market conditions.
Pinnacle Investment Management
Pinnacle FUM Growth - as at 30 June 2009
0.5 0.6
1.0
1.7
3.5
4.4
0.0
0.5
1.0
1.5
2.0
2.5
3.0
3.5
4.0
4.5
5.0
Jun 04 Jun 05 Jun 06 Jun 07 Jun 08 Jun 09
FUM$billion
Pinnacle, which is led by Managing Director Ian Macoun,
continued to expand during the year, adding Pinnacle Private
Equity and Plenary Investment Management to its portfolio
of boutique fund managers and growing the number of
boutiques under its umbrella to seven. Pinnacle also grew its
fund distribution capability with the addition of three senior
distribution specialists. The growth in Pinnacle FUM since its
inception has been substantial and has been a key driver of
revenue for that business.
In FY2009, Pinnacle and Capital International, one of the world’s
most respected investment management firms, entered into
an agreement for the distribution of global equities funds to
Australian retail investors. Under the agreement, Pinnacle, in
conjunction with the Wilson HTM Investment Group administers
the Capital International Global Equities Fund and the Capital
International Global Equities Fund (Hedged).
The agreement combines Pinnacle’s distribution and
administrative strengths with Capital’s unparalleled global
research and equity management experience. The Capital Group
Companies, Inc. (CGC) is one of the oldest major investment
firms in the world. Since its founding in 1931, Capital has focused
exclusively on investment management.
Pinnacle Revenue Growth - through 30 June 2009
0.0
2.0
4.0
6.0
8.0
10.0
12.0
14.0
16.0
18.0
FY2004 FY2005 FY2006 FY2007 FY2008 FY2009
Revenue$million
*Revenue shown is 100% of all boutique revenue (equity accounted). Revenue derived from
Pinnacle itself is not equity accounted.
The Pinnacle business today generates over $16 million in
Revenue, a CAGR of 54% since its launch in FY2006.
Pinnacle Funds Performance – Alpha through 30 June 2009
-10%
-5%
0%
5%
10%
15%
20%
25%
30%
35%
40%
45%
50%
Plato Core RCL Core Solaris CoreHyperion AEQ
1 year 3 year 5 year 10 year since inception6 month
Benchmarks:
Hyperion AEQ - S&P/ASX 300 Accumulation Index. Inception date was on 1 November 1996.
Plato Core - S&P/ASX 300 Accumulation Index. Inception date was on 30 October 2006
RCL Core - S&P/ASX 200 Property Trust Accumulation Index
Solaris Core - S&P/ASX 200 Accumulation Index. Inception date was on 9 January 2008
Returns are expressed gross of fees
On page 10 we have provided a summary of the performance
achieved in each of the Pinnacle boutiques along with the
progress made during the year. As each boutique offers a
different investment proposition, performance will vary according
to investment style and mandate. However, I am pleased to
report that since inception to the end of FY 2009, all of Pinnacle’s
Australian equity investment funds have delivered alpha.
ManagingDirector’sReportWilsonHTMInvestmentGroupLtd2009AnnualReport
Managing Director’s Report
- Continued
Forpersonaluseonly
11. 8
WilsonHTMInvestmentGroupLtd2009AnnualReport
Growing Funds Under Administration
Wilson HTM Investment Group Ltd
Growth in Funds under Administration - as at 30 June 2009
Through service agreements with Deutsche Asset Management
and Capital International, the Group has also substantially grown
its funds under administration (FUA) to $4.9 billion at the end of
FY2009.
Management Team
Following the acquisition of Next Financial, the executive
management team was restructured with the aim of streamlining
the business and ensuring the integration of that business into the
Group. Alex Ihlenfeldt was appointed as Head of Private Wealth
Management, Mark Burns to Head of Capital Markets and Deane
Sweeney replaced Alex Ihlenfeldt in the role of Chief Operating
Officer. Neal McCulloch remains the Chief Financial Officer and
we recently announced the appointment of Andrew Blakemore as
our new Head of Human Resources. We have provided a detailed
organisational chart of the new structure, roles and responsibilities
on page 16.
Community
WIG has developed a broad CSR framework which reflects
our mission of creating prosperity for our clients, people and
community. The approach focuses on the following three main
strategies:
Our Community•
Our People•
Our Governance•
A community focus
In the past year the Company has built on its long established
commitment to community engagement, and to helping those
in need within society with links to employees, clients and the
business.
The Wilson HTM Foundation
For more than twenty years the Wilson HTM Foundation and its
predecessor has been an important part of this philosophy, gifting
more than $1.3 million to date.
The Foundation is overseen by an independent Board of
Directors, with an internal donations committee in place to
assess annual submissions from employees and to make formal
recommendations.
The Foundation donates approximately 6% of capital each year to
a small number of employee chosen charities. It also has a long
term national partnership with the Reach Foundation, which has a
vision “that every young Australian has the support and self belief
to fulfil their potential and dare to dream.”
Workplace giving
The Company offers an employee payroll giving program, through
which employees can make regular donations through automatic
deductions from pre-tax pay. These are matched dollar for dollar
by the Company up to $3,000 per person per annum, and can be
made to any charity of choice which holds tax deductibility status.
The program is managed through external providers to ensure
regulatory compliance, and approximately 17% of employees
participate. In 2008-2009 this resulted in more than $80,000 being
distributed to 45 different charities across the country, with the
Wilson HTM Foundation being the most popular recipient.
Company supported events in FY2009
In addition, the Company is directly involved in and offers
sponsorship or donations to a range of industry, community
and charitable activities which employees and clients initiate or
actively take part in.
Examples during the past year include:
“Classic Wallabies Annual Luncheon” (beneficiary is the Spinal•
Injuries Association)
“Brisbane Big City Barbecue” (beneficiaries are DRUG ARM•
Australasia, Guide Dogs Queensland and the Lord Mayor’s
Community Trust)
NSW “MS Angels” (beneficiary is MS Research Australia)•
Arrow Energy’s “Kick for a Cure” (beneficiary is Prostate Cancer•
Research)
“Australian Stockbrokers’ Foundation Awards Charity Dinner”•
(various beneficiaries)
“Wilson HTM Brisbane to the Gold Coast Cycle Challenge”•
(beneficiaries are Diabetes Australia QLD and the Heart
Foundation)
“Spin to Cure Diabetes” (beneficiary is Juvenile Diabetes)•
People
Due to the poor market conditions experienced in FY2009, the
Company implemented a number of cost-cutting measures
including some reductions in staff members. However, with the
acquisition of Next Financial we added 56 new staff members to
the Group.
We now have 316 full time equivalent staff across Wilson HTM and
49 full time staff across Pinnacle.
Wilson HTM Investment Group Pinnacle
4
7
11
12
11
5
INST. STOCKBROKING
CORPORATE FINANCE PRIVATE CLIENT ADVISORY
RESEARCH
Next
HYPERION
RESOLUTION CAPITAL LTD
PALISADE
PINNACLE
SOLARIS
PLATO
27
10
103
100
22
55
MANAGEMENT & SUPPORT
Managing Director’s Report
- Continued
0.6 0.7
1.1
2.0
2.3
3.2
1.7
0.6
0.7
1.1
2.0
2.3
4.9
0.0
1.0
2.0
3.0
4.0
5.0
Jun 04 Jun 05 Jun 07Jun 06 Jun 08 Jun 09
$billions
Wilson HTM Pinnacle
ManagingDirector’sReport
Forpersonaluseonly
12. 9
WilsonHTMInvestmentGroupLtd2009AnnualReport
Strategy
As an integrated investment group Wilson HTM has a diverse
group of activities united by a shared focus on delivering
outperformance. Across the businesses practices and disciplines
have been established supporting our activities and allowing
Wilson HTM to establish track records which, in the case of some
of our funds, now run 3, 5 and in the case of Hyperion to 10 years.
It is with this focus on outperformance that we are pursuing
growth in the Private Wealth Management market. In the past year
our capabilities in meeting the investment needs of retail clients
in our Private Wealth Management business have been enhanced
with the acquisition of Next Financial. This acquisition has added
Structured Product and Protection strategies to our capabilities
and expanded our client base to include Financial Planning dealer
groups. We anticipate that the acquisition of Next Financial will
allow us to introduce new product offerings and services to
existing and new retail clients of the group and to facilitate the
continued growth of Funds Under Management.
Our Capital Markets operations are orientated to the identification
and delivery of outperforming investment ideas to both
Institutional and Retail investors. Our Capital Markets focus
remains largely on the mid market space and in industry segments
that are expected to outperform the broader economy. While the
last financial year was characterised by a dramatic drop in both the
capitalisation of the Australian market and in trading volumes we
were able to deliver outperforming Research recommendations
and Equity Capital Markets opportunities in emerging sectors such
as Energy and in particular Coal Seam Gas.
Pinnacle’s boutiques focus on delivering outperformance.
The Pinnacle model provides its boutique managers with
equity participation and independence while Pinnacle itself
supports marketing and the growth of FUM and Wilson HTM
provides support services. This allows the boutique managers to
concentrate on investment. The boutique strategy has achieved
meaningful success as measured by growth in FUM in the past
year and will continue to be expanded.
Outlook
With the recent reduction in equity market volatility trading
volumes in our businesses have improved from the levels
experienced through the 2008/09 financial year. We have also
been able to complete a number of Equity Capital Markets
mandates. FUM growth in both Wilson HTM and Pinnacle is being
experienced as a result of inflows and the rising market. While
this improved environment is encouraging the performance of
the business remains dependant upon the factors previously
identified; the performance of the Australian market, the level of
alpha (outperformance) generated and the growth of FUM.
Garry Lowrey
Managing Director
Wilson HTM Investment Group Ltd
ManagingDirector’sReportWilsonHTMInvestmentGroupLtd2009AnnualReport
In April 2009, the Company acquired Next Financial,
a product manufacturer and investment manager
specialising in protected equity products and
discretionary and non-discretionary investment
accounts. Next Financial’s clients are primarily high-
net-worth investors and financial planning dealer
groups.
The acquisition has secured another source of
intellectual property to help generate alpha for our
clients. It is also an extension to our business model,
adding additional investment management, product
structuring expertise and distribution to Wilson
HTM. Next Financial has provided access to new
relationships including over 80 financial planning
dealer groups servicing over 4,500 retail clients.
In addition, Next Financial also directly services
over 200 active high-net-worth clients. We are
working closely with the Next team to leverage those
relationships which will enable us to offer other
investment management products and services to
these dealer groups over time.
With its established income streams and products
that target wealth accumulators and the growing
self-managed superannuation market, the
acquisition is expected to enhance the value of our
business for some time to come.
This acquisition has both grown our pool of talented
people and built our Sydney presence.
As at 30 June 2009, Next Financial had client account
balances of $1.4 billion. This has materially increased
Wilson HTM’s funds under management and
administration.
Next Financial Clients Assets & Liabilities ('CAL')
0.4
0.6
0.9
0.9
0.5
0.6
1.0
1.7
1.5 0.9
0.0
0.5
1.0
1.5
2.0
2.5
3.0
30 Jun 2005 30 Jun 2006 30 Jun 2007 30 Jun 2008 30 Jun 2009
$billion
Assets Liabilities
Acquisition of
Next Financial
“This acquisition has
both grown our pool
of talented people
and built our Sydney
presence.”
Forpersonaluseonly
13. 10
WilsonHTMInvestmentGroupLtd2009AnnualReport
The 2009 financial year was another year of progress within Pinnacle
Investment Management Limited (Pinnacle). During the year we
added two further boutiques to the group, Pinnacle Private Equity
and Plenary Investment Management, bringing the total number of
boutiques under our umbrella to seven. I am also pleased with the
success our boutiques have had winning significant funds under
management. As at 30 June 2009, Pinnacle boutiques had a total of
$4.4 billion in FUM.
In addition to growing our funds, we have established a solid
distribution capability. In April 2009, Pinnacle entered into an
agreement with Capital International, one of the world’s most
respected investment management firms, to distribute global
equities funds to Australian retail investors. Under the agreement,
Pinnacle, in conjunction with Wilson HTM Investment Group, is also
responsible for administering the Capital International Global Equities
Fund and the Capital International Global Equities Fund (Hedged).
Below is an overview of the performance of each of our boutiques.
Solaris Investment Management
Boutique funds manager, Solaris, enjoyed a successful financial year with funds under management reaching
over $1.4 billion as at 30 June 2009. Several key institutional mandates were won during the year and Solaris’
pooled funds received steady inflow. The Brisbane-based, nine person Australian Equities investment team offers
both core and high alpha strategies and is supported by two client service representatives and a Chief Operating
Officer. Since its inception, Solaris’ Core Australian Equity Fund achieved alpha of 5.7% pa.
During the year, Solaris was rated by most major researchers and was awarded the highest possible rating by two
prominent rating houses. Solaris also won the Morningstar Fund Manager of the Year 2008 – Emerging award.
The Solaris Core Australian Equity Fund was added to major platforms and the Solaris Core Australian Equity
Fund (Performance Fee Option) was launched to provide a performance fee alternative, which offers very strong
alignment of interest between fund manager and investor.
Plato Investment Management
The fiscal year ended 30 June 2009 proved a difficult investment environment, with the fall of Lehman Brothers
bringing forth what is now called the Global Financial Crisis. The year was also difficult for quantitative
investment processes, with most Australian quantitative managers sitting in the bottom quartile of performances
in the Mercer Australian Shares Survey.
For Plato the year was one of consolidation, featuring the seeding of two further 130/30 mandates, including
the Plato Australian Shares 130/30 Fund. Investment performance proved difficult with stock movements
dominated by macroeconomic factors rather than bottom-up fundamentals such as analyst earnings revisions.
Despite the Australian shares market falling more than 20%, funds under management increased over the year
to $436m due to net fund inflows in excess of $170m.
Hyperion Asset Management
Hyperion Asset Management outperformed all other Australian long-only equity fund managers for the 2009
financial year, finishing first in the Mercer and Intech surveys for the twelve months to 30 June 2009 in Australian
Equities. Hyperion’s disciplined focus on buying the highest quality companies was rewarded as many listed
companies suffered the effects of the Global Financial Crisis and the market focused on companies with strong
balance sheets and organic growth opportunities.
The Hyperion Australian Growth Companies Fund returned -0.51%, outperforming the benchmark ASX 300
Accumulation Index by 19.8%.
Hyperion’s small cap fund also produced an outstanding result, returning a gross return of 13.7% representing an
out-performance over the S&P ASX Small Ordinaries Accumulation Index of 42.3%
Hyperion’s focus on long-term performance has also paid off handsomely for clients with a 13.9% pa return and a
5.3% pa outperformance of the S&P ASX 300 Accumulation Index for its composite of Australian Equity portfolios
since inception in October 1996.
Pinnacle Investment Management
Ian Macoun, Managing Director
Pinnacle Investment Management
PinnacleInvestmentManagement
Forpersonaluseonly
14. 11
WilsonHTMInvestmentGroupLtd2009AnnualReport
Resolution Capital
Resolution Capital achieved outstanding investment performance in difficult market conditions. Whilst absolute
returns were disappointing, strong positive alpha performance was attributed to management’s strategy,
embarked upon in Q4 2007, of focusing on real estate vehicles with lower financial gearing and higher quality
property rental income streams.
Resolution Capital’s core fund achieved alpha of 5.7% in the year to 30 June 2009.
Two new pooled funds were launched during the period: Resolution Capital Global Property Securities Fund; and
Resolution Capital Core Plus Property Securities Fund. Steady progress was achieved in having the funds rated by
leading ratings agencies.
Palisade Investment Partners
Palisade’s Diversified Infrastructure Fund and Palisade’s Regional Infrastructure Fund are unlisted vehicles giving
wholesale clients access to experienced and specialised investment management in the economic infrastructure
sector. Palisade’s strategy is a sector-specific focus to maximise investor returns through market specialisation
and positioning. Palisade’s focus continues on the development of its Regional Infrastructure Fund with
investment in the Agri Infrastructure and Clean Tech sectors.
In the year to 30 June 2009, Palisade’s Funds successfully demonstrated their defensive attributes during what
was a difficult year for investment markets generally. The Diversified Infrastructure Fund returned -1.60% and
Palisade’s Regional Fund returned 3.8%.
Pinnacle Private Equity
Pinnacle Private Equity Limited is seeking to raise its initial Fund for investment in mid-market private equity
opportunities in Australia and New Zealand. The Pinnacle Private Equity management team has an outstanding
track record of successful investment in companies with strong entrepreneurs, cogent growth opportunities and
an enterprise value at the time of the investment of up to $200 million.
Previous mid-market portfolios managed by the team place it in the upper quartile of comparable private equity
fund managers. Completion of the current fund raising effort will enable Pinnacle Private Equity to continue that
business at a portentous time in the economic cycle without the burden of legacy assets. Pinnacle Private Equity
facilitates and drives the execution of growth strategies by portfolio companies to target returns of more than
20%.
Plenary Investment Management
Plenary Investment Management was established in May 2009 by Plenary Group, a leading specialist social
infrastructure originator, and Pinnacle, to provide institutional investors with access to the growing pipeline of
social infrastructure opportunities both in Australia and offshore.
Plenary Investment Management is currently raising its first Australian Fund, which is capped at $500 million and
‘seeded’ with a diverse pipeline of existing Plenary Group assets.
Social infrastructure is proving to be an attractive option for institutional investors, particularly superannuation
funds, given its growing global pipeline and the surety of steady payment streams from government and long
term, generally inflation-linked returns.
PinnacleInvestmentManagementWilsonHTMInvestmentGroupLtd2009AnnualReport
“As at 30 June 2009, Pinnacle
boutiques had a total of $4.4
billion in FUM.”
Pinnacle Investment Management
- Continued
Forpersonaluseonly
15. 12
WilsonHTMInvestmentGroupLtd2009AnnualReport
Directors’ Profiles
Garry Lowrey
Managing Director Group & Chairman, Wilson HTM
Mr Garry Lowrey was appointed to the role of Managing Director in February 2006.
He joined the Company in 1999 as a Business Director of Corporate Finance. He was
appointed Head of Corporate Finance in 2001.
Prior to joining the Company, he spent 12 years with UBS Warburg and its predecessor
firms. From 1992, he was a Director of UBS Warburg’s Corporate Finance team,
specialising in capital markets and mergers and acquisitions advice to small and Mid-
market companies.
Special Responsibilities:
Managing Director-
Other Current Directorships:
Chairman and Managing Director, Wilson HTM Ltd-
Chairman and Managing Director, Wilson HTM Corporate Finance Ltd-
Chairman and Managing Director, Wilson HTM Services Pty Ltd-
Director, Pinnacle Investment Management Limited-
Director, WHTM Capital Management Limited-
Director, Next Financial Ltd-
Director, Next Financial Investment Management Ltd-
Director, Mosaic Risk Management Pty Ltd-
Director, Pinnacle Private Equity Limited-
Qualifications & Associations:
Bachelor of Business, NSW Institute of Technology-
Master of Applied Finance, Macquarie University-
Member, Institute of Chartered Accountants in Australia-
Master Stockbroker, Securities and Derivatives Industry Association-
Steven Wilson
Executive Chairman Group
Mr Steven Wilson was appointed Executive Chairman of the Company in 2004. Steven
has 30 years of professional investment experience, including four years with Cazenove
& Co. in London. He has been with the Company and its predecessor entities since 1984
in a number of senior positions including Head of Research, Institutional Sales, Corporate
Finance, Investment Management and as Managing Director.
Steven has previously served as a Director on the Boards of City of Brisbane Airport
Corporation, Telstra Corporation, Tourism Queensland and The Council
of Queensland University of Technology.
Listed Company Directorships held in last 3 years (current & recent):
Director, Hyperion Flagship Investments Limited, from 1997 to 2009 (resigned June 2009)-
Special Responsibilities:
Chairman of the Board-
Chairman of the Nominations & Corporate Governance Committee-
Other Current Directorships:
Chairman, Wilson HTM Investment Management Pty Ltd-
Chairman, South Bank Corporation-
Chairman, Barambah Wines Pty Ltd-
Deputy Chairman, Queensland Rugby Union Ltd-
Director, Pinnacle Investment Management Limited-
Director, The Centre for Independent Studies-
Director, National Trust St John’s Cathedral Completion Fundraising Board-
Trustee for University of Queensland Rugby Union Foundation-
Qualifications & Associations:
Bachelor of Commerce, University of Queensland-
Bachelor of Laws, University of Queensland-
Honorary Doctor of Philosophy, Queensland University of Technology-
Solicitor of the Supreme Court of Queensland-
Master Stockbroker, Securities & Derivatives Industry Association-
Fellow, Australian Institute of Company Directors-
Fellow, Financial Services Institute of Australasia-
Directors’Profiles
Forpersonaluseonly
16. 13
WilsonHTMInvestmentGroupLtd2009AnnualReport
Chum Darvall
Non-executive Director
Mr Chum Darvall joined the Board in October 2005. He is presently Chief Executive
Officer of Deutsche Bank Australia and New Zealand, a position he has held since July
2002. He joined Deutsche Bank in September 1994 as Director of Treasury and in 1998
became Head of Global Markets with responsibility for all debt market-related activities.
Prior to his first appointment at Deutsche Bank, he worked in the financial markets
divisions of Westpac (1985-1994) and BA Australia Ltd (1981-1985), a subsidiary of Bank of
America.
Special Responsibilities:
Member of the Audit Compliance & Risk Management Committee-
Other Current Directorships:
Director of various Deutsche Bank entities-
Director, Australian Financial Markets Association-
Director, The Centre for Independent Studies-
Council Member, Business Council of Australia-
Director, Financial Markets Foundation for Children-
Director, Victor Chang Cardiac Research Institute-
Qualifications & Associations:
Bachelor of Arts, Macquarie University-
Fellow, Australian Institute of Company Directors-
Fellow, Financial Services Institute of Australasia-
Ian Fraser
Deputy Chairman and Non-executive Director
Mr Ian Fraser joined the Board in 2006. He is a Chartered Accountant practising as a
Non-executive Company Director with more than 40 years’ experience as a business and
accounting professional including 27 years as a Partner with KPMG. He retired as an audit
and corporate advisory partner with KPMG in 2004.
Special Responsibilities:
Deputy Chairman-
Chairman, Audit Compliance & Risk Management Committee-
Listed Company Directorships held in last 3 years (current & recent):
Chairman, RP Data Ltd from October 2008 and Director from September 2006 to current-
Director, Cellnet Group Limited from March 2006 to August 2007-
Other Current Directorships:
Director, Property IQ NZ Limited-
Member Board, Queensland Bulk Water Supply Authority-
Director, South East Queensland Water Corporation Limited-
Director, Pemsoft Pty Ltd-
Director, Diversified Mining Services Ltd-
Qualifications & Associations:
Bachelor of Commerce, University of Queensland-
Fellow, Institute of Chartered Accountants in Australia-
Fellow, Australian Institute of Company Directors-
Director’sProfilesWilsonHTMInvestmentGroupLtd2009AnnualReport
Directors’ Profiles - Continued
Forpersonaluseonly
17. 14
WilsonHTMInvestmentGroupLtd2009AnnualReport
Steven Skala
Non-executive Director
Mr Steven Skala joined the Board in 2002. Since 2004, he has been Vice Chairman,
Australia and New Zealand of Deutsche Bank AG. He is a former commercial lawyer
with more than 20 years’ experience in corporate law. Between 1982 and 1985, he was
a partner of Brisbane law firm Morris Fletcher and Cross (now Minter Ellison). Between
1985 and 2004 he was a partner of law firm, Arnold Bloch Leibler, and was Head of its
Corporate and Commercial Practice for several years.
Special Responsibilities:
Member of the Nominations & Corporate Governance Committee-
Member of the Remuneration Committee-
Listed Company Directorships held in last 3 years (current & recent):
Director, Hexima Limited, from 2002 to current (Chairman 2002-2008)-
Other Current Directorships:
Vice Chairman, Australia & New Zealand, Deutsche Bank AG-
Director, Deutsche Australia Limited-
Director, Australian Broadcasting Corporation-
Director, Max Capital Group Ltd-
Vice President, The Walter and Eliza Hall Institute of Medical Research-
Director, The Centre for Independent Studies-
Director, The Australian Ballet-
Qualifications & Associations:
Bachelor of Arts, University of Queensland-
Bachelor of Laws (Honours), University of Queensland-
Bachelor of Civil Law, Oxford University-
Solicitor of the Supreme Courts of Queensland, Victoria and-
Northern Territory and the High Court of Australia
Paul Harris
Non-executive Director
Mr Paul Harris joined the Board and its predecessor entities in October 1998. He has worked
for more than 30 years in the securities industry, being a member of the Sydney Stock
Exchange Ltd and a director of a number of its member firms until the time of the public
listing of ASX Limited in October 1998.
He has recently held Directorships with Gresham CEA Management Ltd, Gresham
Technology Management Ltd and was a Governor of the Centenary Institute for Cancer
Research and Cell Biology.
Special Responsibilities:
Member of the Nominations & Corporate Governance Committee-
Member of the Remuneration Committee (Chairman until 30 June 2008)-
Listed Company Directorships held in last 3 years (current & recent):
Director, Ten Network Holdings Ltd (Group of Companies), from 1998 to 2007-
Other Current Directorships:
Director, Fulcrum Capital Partners Ltd-
Governor, WWF Australia-
Qualifications & Associations:
Master of Arts (Law), University of Cambridge-
Fellow, Financial Services Institute of Australasia-
Directors’ Profiles - Continued
Forpersonaluseonly
18. 15
WilsonHTMInvestmentGroupLtd2009AnnualReport
Ann Sherry AO
Non-executive Director
Ms Ann Sherry joined the Board in June 2008. Ann is currently the Chief Executive Officer
of Carnival Australia, a division of Carnival Corporation. Prior to this, Ann was with
Westpac for 12 years. Her roles with Westpac were Chief Executive Officer, Westpac New
Zealand and Group Executive, Westpac New Zealand and the Pacific. Previously, Ann was
the CEO of the Bank of Melbourne and Group Executive, People & Performance. Prior
to Westpac, Ann was First Assistant Secretary of the Office of the Status of Women in
Canberra.
Special Responsibilities:
Member of the Remuneration Committee-
Listed Company Directorships held in last 3 years (current & recent):
None-
Other Current Directorships:
Chair, Public Service Commission of Queensland-
Director, Tourism & Transport Forum Australia Ltd-
Director, Indigenous Enterprise Partnerships-
Director, the Catherine Freeman Foundation-
Board Member, Tourism Queensland-
Director, Company B Ltd-
Qualifications & Associations:
Bachelor of Arts, University of Queensland-
Graduate Diploma in Industrial Relations Queensland-
University of Technology
Member, Australian Institute of Company Directors-
Fellow, Financial Services Institute of Australasia-
Fellow, Institute of Public Administration Australia-
Warren McLeland
Non-executive Director
Mr Warren McLeland joined the Board in March 2007. He began his career with the
Reserve Bank of Australia as a research scholar. He then became a partner and member
of the Sydney Stock Exchange Ltd for Bain and Company (subsequently purchased by
Deutsche Bank), then Chase Manhattan Bank in New York, Hong Kong and Europe
where he managed Chase’s UK securities business and European funds management
business.
He was also a member of the London Stock Exchange, a part-time lecturer at the
University of London, and a Director of the International Primary Markets Association
and the International Securities Markets Association.
Special Responsibilities:
Chairman of the Remuneration Committee (from 1 July 2008)-
Member of the Audit Compliance & Risk Management Committee-
Listed Company Directorships held in last 3 years (current & recent):
Chairman, Ellect Holdings Limited, from April 2005 to current-
Director, Trust Company Limited, from 2005 to current-
Other Current Directorships:
Director, RESIMAC Limited-
Director, Eclectic Investment Trust PLC-
Director, Utilico Limited PLC-
Director, Pain Management Research Institute Limited-
Qualifications & Associations:
Bachelor of Science, University of Sydney-
Master of Business Administration, Australian Graduate School of Management, University of New South Wales-
Fellow, Financial Services Institute of Australasia-
Director’sProfilesWilsonHTMInvestmentGroupLtd2009AnnualReport
Directors’ Profiles - Continued
Forpersonaluseonly
19. 16
WilsonHTMInvestmentGroupLtd2009AnnualReport
Alex Ihlenfeldt
Head of Private Wealth Management
Alex Ihlenfeldt joined the Company in 2000. He was General Manager, prior to taking
the role of Chief Operating Officer from July 2006 to April 2009 when he was appointed
to the role of Head of Private Wealth Management. He has over 20 years’ finance and
accounting experience in both Australia and South Africa. Prior to joining the Company
he held senior positions with PKF (Chartered Accountants) and Indevco Business
Consultants.
Bachelor of Accounting Science (Honours), University of South Africa-
Member, Securities & Derivatives Industry Association-
Fellow, Australian Institute of Company Directors-
Andrew Blakemore
Head of Human Resources
Andrew Blakemore joined the Company in June 2009 as Head of Human Resources.
Prior to joining, Andrew was with Macquarie Group Limited for six years where his roles
included the Regional Head of HR (Australia/NZ) and Global Head of Remuneration.
Andrew also worked for nine years with the BT Financial Group and Bankers Trust
Australia where he was Head of Human Resources and Head of Compensation and
Benefits. He has also worked in corporate superannuation roles with Lend Lease
Financial Services and National Mutual.
Bachelor of Economics, University of Sydney-
Diploma of Superannuation Management, ASFA-
Fellow, Australian Human Resources Institute-
GROUP
BOARD
WILSON HTM
Steven Wilson
Executive Chairman
Group
PINNACLE
BOARD
Ian Macoun
Chairman & Managing
Director
Pinnacle Investment
Management Limited
Andrew Blackmore
Head of Human
Resources
Deane Sweeney
Chief Operating Officer
& Legal Counsel
IT
Services
Marketing
Operations
Compliance
Investment
Management
Services
Neal McCulloch
Chief Financial
Officer
Risk
Management
Company
Secretarial
Business &
Management
Reporting
Financial &
External
Reporting
Administration
& Procurement
Project
Management
Mark Burns
Head of
Capital Markets
Corporate
Finance
Equity
Capital
Markets
Research Institutional
Sales
Alex Ihlenfeldt
Head of Private Wealth
Management
Investment
Advisory
Financial
Advisory
Next
Financial
Garry Lowrey
Managing Director
Group
& Chairman Wilson HTM
Executive Management
ExecutiveManagement
Forpersonaluseonly
20. 17
WilsonHTMInvestmentGroupLtd2009AnnualReport
Neal McCulloch
Chief Financial Officer
Neal McCulloch joined the Company in January 2007. He has over 25 years’ experience
in finance and management positions, most recently as Chief Financial Officer of Orrcon
Limited, a significant business within the listed Hills Industries Limited group. Before
that, he was Group Financial Controller of Queensland Cotton Holdings Limited, a
listed multinational agribusiness, and spent 12 years in the audit and corporate services
division of KPMG.
Bachelor of Business, Queensland University of Technology-
Member, Institute of Chartered Accountants in Australia-
Deane Sweeney
Chief Operating Officer
Deane Sweeney is the Chief Operating Officer for Wilson HTM Investment Group. Deane
has 13 years legal and financial services experience. Prior to joining Wilson HTM, Deane
practiced as a solicitor, before working for Credit Suisse First Boston and Challenger
International in legal and compliance roles. Deane holds a Bachelor of International
Business and a Bachelor of Laws, and is a solicitor of the Supreme Court of Queensland.
Bachelor of Laws (Honours), Griffith University-
Bachelor of International Business, Griffith University-
Member, Queensland Law Society-
Member, Australian Corporate Lawyers Association-
Mark Burns
Head of Capital Markets
Mark Burns joined the Company in May 2007. Prior to that he spent over eleven years
at Deutsche Bank in its investment banking division. At Deutsche Bank he held the
position of Head of the Telecommunications and Media Team in Australia and New
Zealand from 1997 to 2000, before becoming Managing Director, Head of e-Business,
Australia and New Zealand until mid 2001. From 2001 to 2007 Mark managed his own
boutique corporate advisory business, TMT Partners.
Bachelor of Arts (Double Major in Accounting & Economics), Macquarie University-
Master of Applied Finance, Macquarie University-
Fellow, Financial Services Institute of Australasia-
Graduate Member, Australian Institute of Company Directors- WilsonHTMInvestmentGroupLtd2009AnnualReportExecutiveManagement
Executive Management - Continued
Forpersonaluseonly
21. 18
Directors’ReportWilsonHTMInvestmentGroupLtd2009AnnualReport
Your Directors present their report on the consolidated entity (referred to hereafter as the Group) consisting of Wilson HTM Investment
Group Ltd (the Company) and the entities it controlled at the end of, or during, the year ended 30 June 2009.
Directors
The following persons were Directors of Wilson HTM Investment Group Ltd during the whole of the financial year and up to the date of
this report:
Mr S M Wilson
Mr G P Lowrey
Mr C Darvall
Mr I H Fraser
Mr P P A Harris
Mr W J McLeland
Ms A C Sherry AO
Mr S M Skala
Information on the qualifications, experience and responsibilities of Directors is included in the Director’s Profiles on pages 12 to 15 of this
Annual Report.
Principal activities
During the year the principal continuing activities of the Group consisted of:
Investment Management
(a) managing Specialty Fund investments
(b) developing and operating boutique funds management businesses
(c) providing financial planning and funds management services to Private Wealth Management clients
(d) providing investment management services to retail and wholesale clients
(e) investing in selected equity and fund investments as principal
(f) providing infrastructure and administration services to fund managers
Capital Markets
(a) providing equity capital markets and merger and acquisition advisory services
(b) provision of research on ASX listed entities
(c) providing full-service stockbroking services to both private and institutional clients
(d) investing in selected equity investments from time to time as principal
During the year, the Group acquired Next Financial Limited, which was a privately owned, structured financial product manufacturer
and investment manager that specialises in providing protected equity products and discretionary and non-discretionary investment
accounts to high-net-worth clients and financial planning dealer groups.
Other than the above, there has been no significant change in the nature of the principal continuing activities during the year.
Dividends - Wilson HTM Investment Group Ltd
Dividends paid to members during the financial year were as follows:
2009
$’000
2008
$’000
Interim ordinary dividend for the year ended 30 June 2009 of $0.01 (2008: $0.03) per fully paid share paid on
3 April 2009 (2008: 28 March 2008)
957 2,871
Final ordinary dividend for the year ended 30 June 2008 of $0.04 per fully paid share paid on 3 October 2008 3,829 -
4,786 2,871
In addition to the above dividends, since the end of the financial year the Directors have recommended the payment of a final ordinary
dividend of $1,030,000 (1.0 cent per fully paid share) to be paid on 2 October 2009 out of retained profits at 30 June 2009.
Directors’ Report 30 June 2009
Forpersonaluseonly
22. 19
Directors’ReportWilsonHTMInvestmentGroupLtd2009AnnualReport
Review of operations
The Group reported net profit after tax attributable to its shareholders of $2.2 million which was 82% lower than the previous financial
year. Reported revenue declined by 14% to $107 million from $125 million. Reported revenue includes Next Financial revenue for the final
quarter. Excluding the Next Financial contribution, revenue declined 31% to $86 million. Group revenue (excluding Next Financial) was
impacted by the sharp decline in equity market values which reduced trading volumes and FUM values.
Further information on the operations of the Group is set out in the Managing Director’s Report on pages 4 to 9 of this Annual Report.
Earnings per share
2009 Cents 2008 Cents
(a) Basic earnings per share
Profit from continuing operations attributable to the ordinary equity holders of the Company 2.4 13.2
(b) Diluted earnings per share
Profit from continuing operations attributable to the ordinary equity holders of the Company 2.2 12.0
Alternate diluted earnings per share 2.4 12.2
Alternate diluted earnings per share is presented after adjusting the number of shares on issue used in the basic calculation (91,126,368)
for potential ordinary shares, which comprise the weighted average of options on issue (2009: 7,437,186; 2008: 8,717,017), and as if the net
proceeds from the exercised options achieved a return comparable with the Company’s cost of debt during the year.
Significant changes in the state of affairs
During the year, the Group acquired Next Financial Limited, which was a privately owned structured financial product manufacturer
and investment manager that specialises in providing protected equity products and discretionary and non-discretionary investment
accounts to high-net-worth clients and financial planning dealer groups.
Other than as outlined above, there have been no significant changes in the state of affairs of the Company from the date of the last
financial report to the date of this financial report.
Matters subsequent to the end of the financial year
There has not arisen in the interval between the end of the financial year and the date of this report, any item, transaction or event of a
material and unusual nature likely, in the opinion of the Directors of the Company, to significantly affect:
(a) the Group’s operations in future financial years, or
(b) the results of those operations in future financial years, or
(c) the Group’s state of affairs in future financial years.
Likely developments and expected results of operations
The consolidated entity will continue to pursue its policy of increasing its presence in Investment Management and Capital Markets in
Australia during the next financial year. The recovery in equity market values from the low of March 2009 has seen a recovery in trading
volumes and equity capital markets activity which, if sustained through the current financial year, will result in revenues and profits
materially higher than in the 2009 financial year.
Environmental regulation
The Group is not affected by any significant environmental regulation in respect of its operations.
Company Secretary
The Company Secretary is Mr I W Harrison B Bus (Acc), FCPA, CSA (Affiliate). Mr Harrison was appointed to the position of Company
Secretary in 1996 and has worked for the Company for 17 years. He has 29 years experience in the accounting and finance industries.
Directors’ Report
- Continued
Forpersonaluseonly
23. 20
Directors’ReportWilsonHTMInvestmentGroupLtd2009AnnualReport
Meetings of Directors
The numbers of meetings of the Company’s Board of Directors and of each Board committee held during the year ended 30 June 2009,
and the numbers of meetings attended by each Director were:
Meetings of committees
Full meetings of Directors
Nominations and Corporate
Governance
Audit Compliance & Risk
Management
Remuneration
A B A B A B A B
Mr S M Wilson 13 13 - - - - - -
Mr G P Lowrey 13 13 - - - - - -
Mr C Darvall 11 13 - - 4 6 - -
Mr I H Fraser 12 13 - - 6 6 - -
Mr P P A Harris 10 13 - - - - 2 3
Mr W J McLeland 12 13 - - 6 6 3 3
Mr S M Skala 10 13 - - - - 2 3
Ms A C Sherry AO 13 13 - - - - 3 3
A = Number of meetings attended
B = Number of meetings held during the time the Director held office or was a member of the committee during the year
Remuneration report
The remuneration report is set out under the following main headings:
Principles used to determine the nature and amount of remunerationA.
Details of remunerationB.
Service agreementsC.
Share-based compensationD.
Additional information.E.
The information in this remuneration report has been audited as required by section 308(3C) of the Corporations Act 2001.
A Principles used to determine the nature and amount of remuneration
The objective of the Group’s executive reward framework is to ensure reward for performance is competitive and appropriate for
the results delivered. The framework aligns executive reward with achievement of strategic objectives and the creation of value for
shareholders, and conforms with market practice for delivery of reward. The Board ensures that executive reward satisfies the following
key criteria for good reward governance practices:
competitiveness and reasonableness•
acceptability to shareholders•
performance linkage / alignment of executive compensation•
transparency•
capital management.•
The Group has structured an executive remuneration framework that is market competitive and complementary to the reward strategy of
the organisation.
Alignment to shareholders’ interests:
has economic profit as a core component of plan design•
focuses on sustained growth in shareholder wealth, as well as focusing the executive on key non-financial drivers of value•
attracts and retains high calibre executives.•
Alignment to program participants’ interests:
rewards capability and experience•
reflects competitive reward for contribution to growth in shareholder wealth•
provides a clear structure for earning rewards•
provides recognition for contribution.•
The framework provides a mix of fixed and variable pay, and a blend of short and long-term incentives. As executives gain seniority with
the Group, the balance of this mix shifts to a higher proportion of at risk rewards.
Non-executive Directors
Fees and payments to Non-executive Directors reflect the demands which are made on, and the responsibilities of, the Directors.
Non-executive Directors’ fees and payments are reviewed annually by the Board. The Executive Chairman does not receive fees in his
Directors’ Report
- Continued
Forpersonaluseonly
24. 21
WilsonHTMInvestmentGroupLtd2009AnnualReportDirectors’Report
Directors’ Report
- Continued
capacity as Chairman. Mr C Darvall receives no fees, as he is an executive officer and representative of Deutsche Bank Australia, which is a
substantial shareholder in the Company.
Non-executive Directors are eligible to participate in the Employee Option Share Plan.
Directors’ fees
Non-executive Directors (excluding Mr C Darvall) are paid an annual fee for their service on the Board. Directors’ fees are determined
within an aggregate Directors’ fee pool limit, which is periodically recommended for approval by shareholders. The maximum currently
stands at $600,000 per annum and was approved by shareholders at the Annual General Meeting on 24 October 2006. The current
base remuneration was reviewed with effect from 1 January 2009. After reviewing the financial conditions and considering the ongoing
financial crisis afflicting the world, the Non-executive Directors agreed to a 10% reduction in their fees. Non-executive Directors who
chair, or are a member of, a committee receive additional yearly fees.
From 1 January 2009
From 1 July 2008 to 31
December 2008
Base fees amounts shown are annual fees, applicable for the periods indicated
Chairman $NIL $NIL
Other Non-executive Directors $67,500 $75,000
Audit Compliance and Risk Management Committee – Chairman $9,000 $10,000
Audit Compliance & Risk Management Committee – Member $4,500 $5,000
Nomination & Corporate Governance Committee – Member $4,500 $5,000
Remuneration Committee – Chairman $9,000 $10,000
Remuneration Committee – Member $4,500 $5,000
Retirement allowances for Directors
The Company does not provide for retirement allowances for Directors, in line with recent guidance on Non-executive Directors’
remuneration. Superannuation contributions required under the Australian superannuation guarantee legislation continue to be made
and are deducted from the Directors’ overall fee entitlements.
Executive pay
The executive pay and reward framework has three components:
base pay and benefits, including superannuation•
short-term performance incentives, and•
long-term incentives through participation in the Equity Participation Plan, Employee Option Share Plan, or Long-term Incentive Share•
Plan.
The combination of these comprises the executive’s total remuneration.
Base pay
Structured as a package which may be delivered as a combination of cash and prescribed non financial benefits.
Executives are offered competitive base pay that comprises the fixed component of pay and rewards. Base pay for executives is reviewed
annually to ensure the executive’s pay is competitive with the market in the context of total remuneration. An executive’s base pay is also
reviewed on promotion.
There are no guaranteed base pay increases included in any executives’ contracts.
Short-term incentives
If the Group achieves a pre-determined profit target, a short term incentive (STI) pool is available to executives during the annual review.
Cash incentives (bonuses) are payable after conclusion of the financial year. Using a profit target ensures variable reward is available
when value has been created for shareholders and when profit is consistent with the business plan. The incentive pool is leveraged for
performance above the threshold to provide an incentive for executive out performance. The Remuneration Committee may also take
into consideration other influences such as staff retention, business acquisitions and/or relative business unit profitability to make available
additional monies to the STI pool on an ad hoc basis. Each executive has a target STI opportunity depending on the accountabilities of
the role and impact on the organisation or business unit performance.
The Board sets appropriate targets and key performance indicators (KPIs) for the Executive Chairman, who in turn sets appropriate targets
and KPIs for the Managing Director, who in turn sets appropriate targets and KPIs for his direct reports, to link the STI plan and the level of
payout if targets are met. This includes setting minimum levels of performance to trigger payment of STI.
Each year, the Remuneration Committee considers the appropriate targets and key performance indicators (KPIs) to link the STI plan and
the level of payout if targets are met. This includes setting any maximum payout under the STI plan, and minimum levels of performance
to trigger payment of STI.
Forpersonaluseonly
25. 22
Directors’ReportWilsonHTMInvestmentGroupLtd2009AnnualReport
For the year ended 30 June 2009, the KPIs linked to STI plans were based on Group, individual business and personal objectives. The KPIs
required performance in achieving specific targets in relation to financial and non-financial measures linked to drivers of performance in
past, current and future reporting periods.
The Remuneration Committee is responsible for assessing whether the Executive Chairman’s KPIs are met. To help make this assessment,
the Committee receives detailed reports on performance.
The short term bonus payments may be adjusted up or down in line with over or under achievement against the target performance
levels.
The STI target annual payment is reviewed annually.
Long-term incentives
Long-term incentives are provided to certain employees via four different instruments: Equity Participation Plan, Employee Option Share
Plan, Long-term Incentive Share Plan, and Employee Share Acquisition Plan (see page 24 for further information).
B Details of remuneration
Amounts of remuneration
Details of the remuneration of the Directors and the key management personnel (as defined in AASB 124 Related Party Disclosures) of
Wilson HTM Investment Group Ltd are set out in the following tables.
The key management personnel of the Group are the Directors of Wilson HTM Investment Group Ltd (see pages 12 to 15 above) and those
executives that report directly to the Managing Director or Executive Chairman being:
A J Blakemore - Head of Human Resources (from 15 June 2009)•
M A Burns - Head of Capital Markets•
A Ihlenfeldt - Head of Private Wealth Management (from 1 March 2009)•
I Macoun - Chairman and Managing Director of Pinnacle Investment Management Limited•
N A McCulloch - Chief Financial Officer•
A D Sweeney - Chief Operating Officer (from 1 March 2009)•
Key management personnel and other executives of Wilson HTM Investment Group Ltd
Short-term employee benefits
Post employment
benefits
Long-
term
benefits
Share-
based
payments
Cash salary
and fees
Cash
bonus
(STI)
Non-
monetary
benefits
Superan-
nuation
Retirement
benefits
Long
service
leave
Options
and rights
(LTI) Total
Portion of
remuneration
performance
related - STI
Portion of
remuneration
performance
related - LTI
Portion
of
STI
vested
Name $ $ $ $ $ $ $ $ % % %
Directors
Non-executive Directors
C Darvall 2009 - - - - - - 1,585 1,585 - % 100% - %
2008 - - - - - - 2,499 2,499 - % 100% - %
I H Fraser 2009 77,933 - - 5,506 - - 793 84,232 - % 1% - %
2008 64,178 - - 21,330 - - 1,250 86,758 - % 1% - %
P P A Harris 2009 80,739 - - - - - 1,585 82,324 - % 2% - %
2008 33,500 - - 56,500 - - 2,499 92,499 - % 3% - %
W J McLeland 2009 16,750 - - 68,750 - - 793 86,293 - % 1% - %
2008 79,361 - - 5,635 - - 1,250 86,246 - % 1% - %
S M Skala 2009 55,752 - - 25,000 - - 1,585 82,337 - % 2% - %
2008 81,456 - - 3,544 - - 2,499 87,499 - % 3% - %
A C Sherry AO (i) 2009 79,783 - - - - - - 79,783 - % - % - %
2008 - - - - - - - - - % - % - %
Directors’ Report
- Continued
Forpersonaluseonly
26. 23
Directors’ReportWilsonHTMInvestmentGroupLtd2009AnnualReport
Directors’ Report
- Continued
Short-term employee benefits
Post employment
benefits
Long-
term
benefits
Share-
based
payments
Cash salary
and fees
Cash
bonus
(STI)
Non-
monetary
benefits
Superan-
nuation
Retirement
benefits
Long
service
leave
Options
and rights
(LTI) Total
Portion of
remuneration
performance
related - STI
Portion of
remuneration
performance
related - LTI
Portion
of
STI
vested
Name $ $ $ $ $ $ $ $ % % %
Executive Directors
S M Wilson 2009 340,712 - (6,161) 49,519 - 6,476 5,549 396,095 - % 1% 100%
2008 379,271 124,619 11,297 15,840 - (48,956) 8,748 490,819 25% 2% 100%
G P Lowrey 2009 385,316 - 1,387 34,678 - 6,976 11,799 440,156 - % 3% 100%
2008 385,319 275,229 (8,056) 59,450 - 7,013 19,700 738,655 37% 3% 100%
Key management personnel
A J Blakemore (ii) 2009 - - - - - - - - - % - % - %
2008 - - - - - - - - - % - % - %
M A Burns 2009 272,878 - (2,831) 76,052 - - 3,963 350,062 - % 1% 100%
2008 317,710 376,145 (9,888) 62,405 - - 6,248 752,620 50% 1% 100%
A Ihlenfeldt 2009 275,500 - (1,218) 24,795 - 4,988 10,213 314,278 - % 3% 100%
2008 297,185 247,706 12,749 25,958 - 5,025 17,200 605,823 41% 3% 100%
I Macoun 2009 231,996 - (1,308) 88,000 - - 119,883 438,571 - % 27% 100%
2008 293,574 - 2,472 96,422 - - 121,711 514,179 - % 24% 100%
N A McCulloch 2009 184,300 - 800 42,758 - - 1,189 229,047 - % 1% 100%
2008 192,650 68,807 (784) 23,518 - - 1,874 286,065 24% 1% 100%
A D Sweeney (iii) 2009 72,932 - 5,110 6,564 - 1,106 793 86,505 - % 1% 100%
2008 - - - - - - - - - % - % - %
D D G Gamble (iv) 2009 (v) 194,740 - (18,068) 19,260 - 4,832 13,395 214,159 - % 6% 100%
2008 347,483 479,285 8,113 35,435 - 5,840 22,410 898,566 53% 2% 100%
D N Groth (iv) 2009 (v) 168,333 - (8,923) 15,150 - 3,801 10,213 188,574 - % 5% 100%
2008 252,500 352,752 7,444 54,473 - (51,509) 17,200 632,860 56% 3% 100%
B J Usasz (iv) 2009 (v) 169,913 - (5,240) 15,150 - - 10,213 190,036 - % 5% 100%
2008 254,992 224,770 (3,167) 41,061 - - 17,200 534,856 42% 3% 100%
M S Walsh (iv) 2009 (v) 198,777 - (26,762) 17,890 - - 10,755 200,660 - % 5% 100%
2008 275,500 355,963 (1,141) 56,832 - - 17,749 704,903 50% 3% 100%
Total compensation: Key Management Personnel (Consolidated)
2009 2,806,354 - (63,214) 489,072 - 28,179 204,306 3,464,697 - % 6% -
2008 3,254,679 2,505,276 19,039 558,403 - (82,587) 260,037 6,514,847 39% 4% -
Total compensation: Key Management Personnel (Company)
2009 1,036,984 - (4,774) 183,453 - 13,452 23,689 1,252,805 - % 2% -
2008 1,023,085 399,848 3,241 162,299 - (41,943) 38,445 1,584,975 25% 2% -
(i) AC Sherry AO was appointed as a Director on 17 June 2008
(ii) A J Blakemore joined the Group on 15 June 2009
(iii) A D Sweeney was appointed to the position of Chief Operating Officer on 1 March 2009
(iv) Following a change in management structure effective 1 March 2009, these employees ceased to be classified as key management personnel. They all continue in senior management roles
within the Group.
(v) Figures shown represent remuneration for the eight months of the year up until the date of the change.
The above disclosure relates to the key management personnel and other executives of the Group. The Directors are the only officers of
the Company requiring disclosure, therefore no further disclosure is required.
STI is a combination of an amount based on achievement of KPIs and a discretionary amount and the portion vested above represents
100% of that combined amount.
Non-monetary benefits represent movement in accrued annual leave.
Forpersonaluseonly
27. 24
Directors’ReportWilsonHTMInvestmentGroupLtd2009AnnualReport
C Service agreements
On appointment to the Board, new Directors are provided with a letter of appointment setting out the Company’s expectations, their
responsibilities, rights and the terms and conditions of their employment. All new Directors participate in a review program which covers
the operation of the Board and its Committees and financial, strategic, operations and risk management issues.
Remuneration and other terms of employment for the Executive Chairman, Managing Director and key management personnel are
also formalised in service agreements. Each of these agreements provide for the provision of performance related cash bonuses, other
benefits including participation, when eligible, in the Employee Option Share Plan. Other major provisions of the agreements relating to
remuneration are set out below.
All contracts with executives may be terminated early by either party with one month’s notice, subject to termination payments as
detailed below.
S M Wilson, Executive Chairman
Term of agreement - on going, commencing 1 July 2003.•
Base salary, inclusive of superannuation, for the year ended 30 June 2009 of $390,000, to be reviewed annually by the Remuneration•
Committee.
Payment of a termination benefit on termination by the Company, other than for gross misconduct, equal to one month base salary.•
G P Lowrey, Managing Director
Term of agreement - on going, commencing 9 February 2006.•
Base salary, inclusive of superannuation, for the year ended 30 June 2009 of $420,000, to be reviewed annually by the Executive•
Chairman.
Payment of a termination benefit on termination by the Company, other than for gross misconduct, equal to one month base salary.•
A J Blakemore, Head of Human Resources
Term of agreement - on going, commencing 15 June 2009.•
Base salary, inclusive of superannuation, for the year ended 30 June 2009 of $250,000, to be reviewed annually by the Managing Director.•
Payment of a termination benefit on termination by the Company, other than for gross misconduct, equal to one month base salary.•
M A Burns, Head of Capital Markets
Term of agreement - on going, commencing 14 May 2007.•
Base salary, inclusive of superannuation, for the year ended 30 June 2009 of $350,000, to be reviewed annually by the Managing Director.•
Payment of a termination benefit on termination by the Company, other than for gross misconduct, equal to one month base salary.•
A Ihlenfeldt, Head of Private Wealth Management
Term of agreement - on going, commencing 1 July 2003.•
Base salary, inclusive of superannuation, for the year ended 30 June 2009 of $300,295, to be reviewed annually by the Managing Director.•
Payment of a termination benefit on termination by the Company, other than for gross misconduct, equal to one month base salary.•
I Macoun, Chairman and Managing Director of Pinnacle Investment Management Limited
Term of agreement - on going, commencing 25 August 2006.•
Base salary, inclusive of superannuation, for the year ended 30 June 2009 of $320,000, to be reviewed annually by the Pinnacle•
Investment Management Limited Board.
Payment of a termination benefit on termination by the Company, other than for gross misconduct, equal to one month base salary.•
At the time of his employment, entities associated with I Macoun received a loan for the purpose of funding equity investment in•
Pinnacle Investment Management Limited. The loan has limited recourse to the equity and is only repayable in the event of all of the
equity being disposed of.
N A McCulloch, Chief Financial Officer
Term of agreement - on going, commencing 8 January 2007.•
Base salary, inclusive of superannuation, for the year ended 30 June 2009 of $225,000, to be reviewed annually by the Managing Director.•
Payment of a termination benefit on termination by the Company, other than for gross misconduct, equal to one month base salary.•
A D Sweeney, Chief Operating Officer
Term of agreement - on going, commencing 1 March 2009.•
Base salary, inclusive of superannuation, for the year ended 30 June 2009 of $239,800, to be reviewed annually by the Managing Director.•
D Share-based compensation
Options
Options over shares in Wilson HTM Investment Group Ltd are granted under the Wilson HTM Investment Group Employee Option Share
Plan (EOSP) which was approved by shareholders at the 20 April 2007 general meeting. The EOSP is designed to provide long-term
incentives for executives to deliver long-term shareholder returns. Under the plan, participants are granted options which only vest if the
employees are still employed by the Group at the end of the vesting period. Participation in the plan is at the Board’s discretion and no
individual has a contractual right to participate in the plan or to receive any guaranteed benefits.
Directors’ Report
- Continued
Forpersonaluseonly
28. 25
Directors’ReportWilsonHTMInvestmentGroupLtd2009AnnualReport
Rights
Rights to shares in Wilson HTM Investment Group Ltd were offered to eligible executives under the Equity Participation Plan (EPP). The EPP
was established by the Company in 2006 to provide equity incentives to selected executives by providing shares paid for by the provision
of an interest free, non-recourse loan, in trust, subject to service and performance conditions. All performance conditions have been
deemed by the Board to have been met and no longer apply as of 4 April 2007.
No further offers are proposed under this plan.
The terms and conditions of each grant of options or rights affecting remuneration in the previous, this or future reporting periods are as
follows:
Grant date Category Expiry date Exercise price Number of rights / options
8 March 2006 Rights 28 February 2011 $0.67 1,150,000
20 November 2006 Rights 15 November 2011 $0.89 1,815,000
14 May 2007 Options 11 May 2011 $1.33 4,725,000
Options granted under the EOSP carry no dividend or voting rights. Rights granted under the EPP carry full dividend rights.
Details of options and rights over ordinary shares in the Company provided as remuneration to each Director of Wilson HTM Investment
Group Ltd and each of the key management personnel of the Group are set out below. When exercisable, each option is convertible
into one ordinary share of Wilson HTM Investment Group Ltd. Further information on the options and rights is set out in note 46 to the
financial statements.
The plan rules contain a restriction on removing the ‘at risk’ aspect of the instruments granted to executives. Plan participants may not
enter into any transaction designed to remove the ‘at risk’ aspect of an instrument before it vests.
Name Number of options / rights granted during the year Number of options / rights vested during the year
2009 2008 2009 2008
Non-executive Directors of Wilson HTM Investment Group Ltd
C Darvall - - 50,000 50,000
I H Fraser - - 25,000 25,000
P P A Harris - 50,000 50,000
W J McLeland - - 25,000 25,000
S M Skala - - 50,000 50,000
AC Sherry AO - - - -
Executive Directors of Wilson HTM Investment Group Ltd
S M Wilson - 175,000 175,000
G P Lowrey - 262,500 225,000
Key management personnel of the Group
A J Blakemore - - - -
M A Burns - - 125,000 125,000
A Ihlenfeldt - - 212,500 175,000
I Macoun - - 100,000 100,000
N A McCulloch - - 37,500 37,500
A D Sweeney - - 25,000 25,000
D D G Gamble (i) - - 287,500 237,500
D N Groth (i) - - 212,500 175,000
B J Usasz (i) - - 212,500 175,000
M S Walsh (i) - - 237,500 187,500
(i) Following a change in management structure effective 1 March 2009, these employees ceased to be classified as key management personnel. They all continue in senior management roles
within the Group.
Directors’ Report
- Continued
Forpersonaluseonly
29. 26
Directors’ReportWilsonHTMInvestmentGroupLtd2009AnnualReport
The assessed fair value at grant date of rights or options granted to the individuals is allocated equally over the period from grant date to
vesting date, and the amount is included in the remuneration tables above. Fair values at grant date are independently determined using
a Black Scholes option pricing model that takes into account the exercise price, the term of the right or option, the impact of dilution, the
share price at grant date and expected price volatility of the underlying share, the expected dividend yield and the risk free interest rate
for the term of the right or option.
The model inputs for options granted during the year ended 30 June 2007 included:
(a) options are granted for no consideration and vest based on the service conditions set out on page 24. Vested options are exercisable
for a period of one year after vesting
(b) exercise price: $1.33
(c) grant date: 14 May 2007
(d) expiry date: 11 May 2011
(e) share price at grant date: $0.85
(f) expected price volatility of the Company’s shares: 30%
(g) expected dividend yield: 6%
(h) risk-free interest rate: 6.16%
The model inputs for rights granted during the year ended 30 June 2007 included:
(a) interests are granted for consideration of $0.89 per share, have a three year life, and 33% of each tranche vests and is exercisable after
each of the three vesting periods
(b) exercise price: $0.89
(c) grant date: 20 November 2006
(d) share price at grant date: $0.89
(e) expected price volatility of the Company’s shares: 15.8%
(f) expected dividend yield: 7%
(g) risk-free interest rate: 5.91%
The rights granted under the scheme are treated as an equity settled share-based payment. The accounting treatment is to expense the
fair value of the interest over the vesting period with a corresponding increase in share based payments equity reserve.
Directors’ Report
- Continued
Forpersonaluseonly
30. 27
Directors’ReportWilsonHTMInvestmentGroupLtd2009AnnualReport
Directors’ Report
- Continued
Shares provided on exercise of remuneration options
Details of ordinary shares in the Company provided as a result of the exercise of remuneration options to each Director of Wilson HTM
Investment Group Ltd and other key management personnel of the Group are set out below.
Date of exercise
of options
Number of ordinary shares issued on exercise of options
during the year
Name 2009 2008
Directors of Wilson HTM Investment Group Ltd
Non-executive Directors
C Darvall – – –
I H Fraser – – –
P P A Harris – – –
W J McLeland – – –
S M Skala – – –
A C Sherry AO – – –
Executive Directors
S M Wilson 12/05/2009 175,000 –
G P Lowrey 12/05/2009 50,000 –
Key management personnel of the Group
A J Blakemore – – –
M A Burns – – –
A Ihlenfeldt – – –
I Macoun – – –
N A McCulloch 12/05/2009 37,500 –
A D Sweeney – – –
D D G Gamble (i) – – –
D N Groth (i) – – –
B J Usasz (i) – – –
M S Walsh (i) 12/05/2009 50,000 –
(i) Following a change in management structure effective 1 March 2009, these employees ceased to be classified as key management personnel. They all continue in senior management roles
within the Group.
Other Employee Share Plans
Long-term Incentive Share Plan
Shareholders approved the Long-term Incentive Share Plan (LTISP) at the 20 April 2007 general meeting. This plan allows invited
employees, including Directors, to receive Shares as an incentive or as a remuneration (STI , salary or commission) sacrifice. Shares acquired
under the LTISP may be subject to forfeiture conditions and administrative holding blocks. An offer was made in September 2008 under
this plan to invited employees . The gross value of the award is to be offset against future STI and/or commission payments over the next
three years with the applicable shares vesting in line with the frequency of STI or commission payments during this three year period.
Forpersonaluseonly
31. 28
Directors’ReportWilsonHTMInvestmentGroupLtd2009AnnualReport
E Additional information
Options and / or rights
Name Year granted Vested % Next exercise date Last exercise date
Minimum total value of
grant yet to vest $
Maximum total value of
grant yet to vest $
Non-executive Directors
C Darvall 2007 67% 11/05/10 11/05/11 – 1,933
I H Fraser 2007 67% 11/05/10 11/05/11 – 967
P P A Harris 2007 67% 11/05/10 11/05/11 – 1,933
W J McLeland 2007 67% 11/05/10 11/05/11 – 967
S M Skala 2007 67% 11/05/10 11/05/11 – 1,933
A C Sherry AO – – – – – –
Executive Directors of Wilson HTM Investment Group Ltd
S M Wilson 2007 67% 11/05/10 11/05/11 – 6,767
G P Lowrey 2007 33% 20/11/09 11/11/11 – 11,463
2007 67% 11/05/10 11/05/11 – 6,767
2006 67% 08/03/10 28/02/11 – 5,708
Key management personnel of the Group
A J Blakemore – – – – – –
M A Burns 2007 67% 11/05/10 11/05/11 – 4,833
A Ihlenfeldt 2007 33% 20/11/09 15/11/11 – 11,463
2007 67% 11/05/10 11/05/11 – 4,833
2006 67% 08/03/10 28/02/11 – 5,708
I Macoun 2007 67% 11/05/10 11/05/11 – 3,867
N A McCulloch 2007 67% 11/05/10 11/05/11 – 1,450
A D Sweeney 2007 67% 11/05/10 11/05/11 – 967
D D G Gamble (i) 2007 33% 20/11/09 15/11/11 – 15,267
2007 67% 11/05/10 11/05/11 – 7,250
2006 67% 08/03/10 28/02/11 – 5,708
D N Groth (i) 2007 33% 20/11/09 15/11/11 – 11,463
2007 67% 11/05/10 11/05/11 – 4,833
2006 67% 08/03/10 28/02/11 – 5,708
B J Usasz (i) 2007 33% 20/11/09 15/11/11 – 11,463
2007 67% 11/05/10 11/05/11 – 4,833
2006 67% 08/03/10 28/02/11 – 5,708
M S Walsh (i) 2007 33% 20/11/09 15/11/11 – 15,267
2007 67% 11/05/10 11/05/11 – 7,250
(i) Following a change in management structure effective 1 March 2009, these employees ceased to be classified as key management personnel. They all continue in senior management roles
within the Group.
Directors’ Report
- Continued
Forpersonaluseonly
32. 29
Directors’ReportWilsonHTMInvestmentGroupLtd2009AnnualReport
Directors’ Report
- Continued
Share-based compensation: Options
Further details relating to options are set out below.
A B C D E
Name
Remuneration
consisting of options
Value at grant date
$
Value at exercise date
$
Value at lapse date
$
Total of columns B-D
$
Executive Directors of Wilson HTM Investment Group Ltd
S M Wilson 1% – 3,500 – 3,500
G P Lowrey 1% – 1,000 2,500 3,500
Key management personnel of the Group
A J Blakemore % – – – –
M A Burns 1% – – 2,500 2,500
A Ihlenfeldt 1% – – 2,500 2,500
I Macoun 1% – – 2,000 2,000
N A McCulloch 1% – 750 – 750
A D Sweeney 1% – – 500 500
A = The percentage of the value of remuneration consisting of options, based on the value of options expensed during the current year.
B = The value at grant date calculated in accordance with AASB 2 Share-based Payment of options granted during the year as part of remuneration.
C = The value at exercise date of options that were granted as part of remuneration and were exercised during the year, being the intrinsic value of the options at that date.
D = The value at lapse date of options that were granted as part of remuneration and that lapsed during the year.
End of Remuneration Report
Loans to Directors and Executives
Information on loans to Directors and Executives, including amounts, interest rates and repayment terms are set out in note 35 to the
financial statements.
Shares under option
Unissued ordinary shares of Wilson HTM Investment Group Ltd under option at the date of this report are as follows:
Date options granted Expiry date Exercise price of options Number under option
14 May 2007 11 May 2011 $1.33 4,725,000
No option holder has any right under the options to participate in any other share issue of the Company or any other entity.
Insurance of officers
The Company has paid a premium for a contract insuring all Directors and Executive Officers of the Company and related bodies
corporate against all liabilities and expenses arising as a result of work performed in their respective capacities, to the extent permitted by
law. The Directors have not included details of the nature of the liabilities covered or the amount of the premium paid in respect of the
Directors and Executive Officer’ s insurance liability contract, as disclosure is prohibited under the terms of the contract.
The Company has agreed to indemnify each person who is or has been a Director, officer or agent of the Company and/or of its related
bodies corporate against all liabilities to another person (other than the Company or a related body corporate) that may arise from their
position as Director, officer or agent, except where the liability arises out of conduct involving a lack of good faith. The Company is
required to meet the full amount of any such liabilities, including costs and expenses.
No liability has arisen since the end of the previous financial year which the Company would, by operation of the above indemnities, be
required to meet.
Non-audit services
The Company may decide to employ the Auditor on assignments additional to their statutory audit duties where the Auditor’s expertise
and experience with the Company and/or the Group are important.
Details of the amounts paid or payable to the Auditor (PricewaterhouseCoopers) for audit and non-audit services provided during the year
are set out below.
The Board of Directors has considered the position and, in accordance with the advice received from the Audit Compliance &
Risk Management Committee, is satisfied that the provision of the non-audit services is compatible with the general standard of
independence for auditors imposed by the Corporations Act 2001. The Directors are satisfied that the provision of non-audit services by
the Auditor, as set out below, did not compromise the auditor independence requirements of the Corporations Act 2001 for the following
reasons:
Forpersonaluseonly
33. 30
Directors’ReportWilsonHTMInvestmentGroupLtd2009AnnualReport
all non-audit services have been reviewed by the Audit Compliance & Risk Management Committee to ensure they do not impact the•
impartiality and objectivity of the Auditor
none of the services undermine the general principles relating to auditor independence as set out in Professional Statement F1,•
including reviewing or auditing the Auditor’s own work, acting in a management or a decision-making capacity for the Company, acting
as advocate for the Company or jointly sharing economic risk and rewards.
During the year the following fees were paid or payable for services provided by the Auditor of the parent entity, its related practices and
non-related audit firms:
Consolidated
2009
$
2008
$
Assurance services
1. Audit services
PricewaterhouseCoopers Australian firm:
Audit and review of financial reports and other audit work under the Corporations Act 2001* 290,405 232,450
Total remuneration for audit services 290,405 232,450
2. Other assurance services
PricewaterhouseCoopers Australian firm:
Audit of regulatory returns 77,144 95,350
Audit of compliance plans 51,733 40,000
Due diligence services 63,850 –
Other agreed-upon procedures 12,470 26,860
Total remuneration for other assurance services 205,197 162,210
Total remuneration for assurance services 495,602 394,660
Taxation services
PricewaterhouseCoopers Australian firm:
Tax compliance services, including review of company income tax returns 282,336 180,100
Total remuneration for taxation services 282,336 180,100
Advisory services
PricewaterhouseCoopers Australian firm:
Other advisory services 31,806 51,315
Non-PricewaterhouseCoopers firm 61,838 104,103
Total remuneration for advisory services 93,644 155,418
* PricewaterhouseCoopers were auditors of Next Financial Limited for the full year and the amount in the table includes $70,209, which is the proportion of audit fee expense incurred since
Next Financial Limited joined the Group. Total audit fees incurred by Next Financial Limited during the June 2009 year were $280,835.
Auditor’s independence declaration
A copy of the Auditor’s Independence Declaration as required under section 307C of the Corporations Act 2001 is set out on page 31.
Rounding of amounts
The Company is of a kind referred to in Class Order 98/100, issued by the Australian Securities and Investments Commission, relating to the
‘’rounding off’’ of amounts in the Directors’ Report. Amounts in the Directors’ Report have been rounded off in accordance with that Class
Order to the nearest thousand dollars, or in certain cases, to the nearest dollar.
Auditor
PricewaterhouseCoopers continues in office in accordance with section 327 of the Corporations Act 2001.
This report is made in accordance with a resolution of Directors.
Mr S M Wilson
Executive Chairman
Wilson HTM Investment Group Ltd
Sydney
26 August 2009
Directors’ Report
- Continued
Forpersonaluseonly
34. 31
WilsonHTMInvestmentGroupLtd2009AnnualReportAuditor’sIndependenceDeclaration
PricewaterhouseCoopers
ABN 52 780 433 757
Riverside Centre
123 Eagle Street
BRISBANE QLD 4000
GPO Box 150
BRISBANE QLD 4001
DX 77 Brisbane
Australia
Telephone +61 7 3257 5000
Facsimile +61 7 3257 5999
Auditor’s Independence Declaration
As lead auditor for the audit of Wilson HTM Investment Group Ltd for the year ended 30 June 2009, I declare that to the best of my
knowledge and belief, there have been:
(a) no contraventions of the auditor independence requirements of the Corporations Act 2001 in relation to the audit; and
(b) no contraventions of any applicable code of professional conduct in relation to the audit.
This declaration is in respect of Wilson HTM Investment Group Ltd and the entities it controlled during the period.
Timothy J. Allman Brisbane
Partner 26 August 2009
PricewaterhouseCoopers
Auditor’s Independence Declaration
Liability limited by a scheme approved under Professional Standards Legislation
Forpersonaluseonly