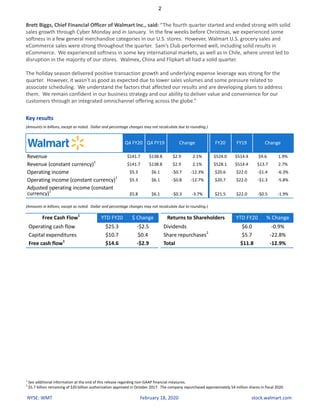
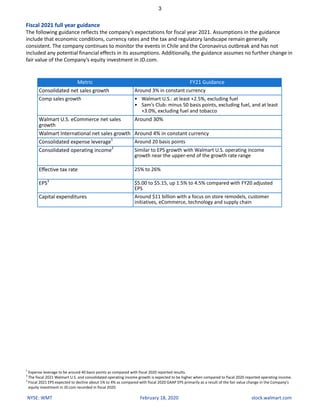
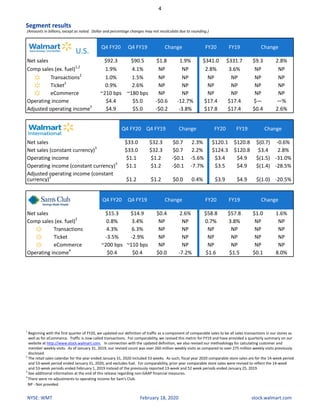
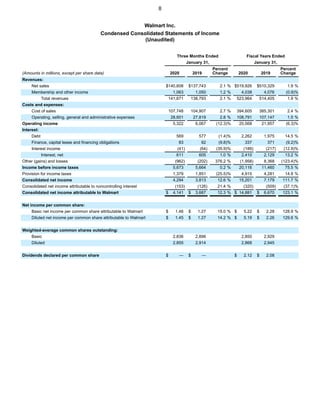
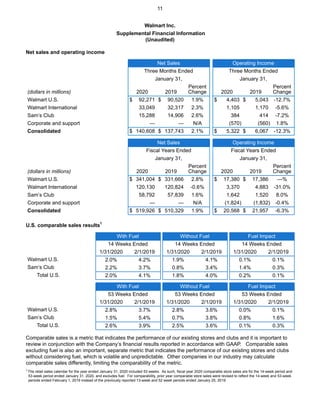
SlideShare a Scribd company logo
1 of 16
Download to read offline
NYSE: WMT February 18, 2020 stock.walmart.com
Walmart U.S. Q4 comp sales1
grew 1.9% and Walmart U.S. eCommerce sales grew 35%,
Q4 FY20 GAAP EPS of $1.45; Adjusted EPS2
of $1.38,
Disruption in Chile and a legal matter lowered GAAP and Adjusted EPS by about $0.05,
Fiscal year 2020 GAAP EPS of $5.19; Adjusted EPS2
of $4.93,
FY21 guidance includes net sales growth of about 3%; U.S. comp sales growth of at least 2.5%; U.S.
eCommerce net sales growth of about 30%; EPS of $5.00 to $5.15
Fourth-quarter highlights
Total revenue was $141.7 billion, an increase of $2.9 billion,
or 2.1%.
“We thank our associates for another good
year. In Q4, we saw strong performance in the
U.S. with eCommerce and Sam’s Club plus
strengthinMexico,IndiaandChina.Westarted
and finished the quarter with momentum,
while sales leading up to Christmas in our U.S.
stores were a little softer than expected. The
new year has started off well, and we look
forward to another strong year. We remain
focused on providing our customers with the
best omnichannel experience from any
retailer. ”
Doug McMillon
President and CEO, Walmart
Walmart U.S. comp sales1
increased on a two-year stacked
basis by 6.0% with continued strength in food and
consumables.
Walmart U.S. eCommerce had strong growth in grocery
pickup and delivery, and walmart.com had its highest
quarterly growth rate of the year.
Sam’s Club comp sales1
increased 0.8%, and eCommerce sales
grew 33%. Reduced tobacco sales negatively affected comp
sales by approximately 300 basis points.
Net sales at Walmart International were $33.0 billion, an
increase of 2.3%. Disruption in Chile negatively affected
operating income by approximately $110 million.
Adjusted EPS2
excludes the effects of four items:
• An unrealized gain of $0.26, net of tax, on the company’s equity investment in JD.com
• A charge of $0.15, net of tax, related to business restructurings
• A tax benefit of $0.11 related to a reduction in corporate income tax rates in India
• A charge of $0.15 related to certain income tax matters
Fiscal 2020 highlights
Total revenue was $524.0 billion, an increase of $9.6 billion, or 1.9%. Excluding currency2
, total revenue was
$528.1 billion, an increase of $13.7 billion, or 2.7%.
Walmart U.S. comp sales1
increased 2.8% and 6.4% on a two-year stacked basis.
Walmart U.S. eCommerce sales grew 37%. Net Promoter Score and the Customer Value Index improved.
Sam’s Club comp sales1
increased 0.7%. Reduced tobacco sales negatively affected comp sales by
approximately 310 basis points. Membership trends were strong.
International net sales increased 2.8% in constant currency2
with strength in Mexico, China and India.
The company generated $25.3 billion in operating cash flow and returned $11.8 billion to shareholders
through dividends and share repurchases.
The company will host its meeting for the investment community today at 8 a.m. EST. The event will be webcast
and can be viewed at the following link: https://corporate.walmart.com/newsroom/events/2020-investment-
community-meeting
1
The retail sales calendar for the year ended January 31, 2020 included 53 weeks. As such, fiscal year 2020 comparable store sales are for the 14-week period
and 53-week period ended January 31, 2020, and excludes fuel. For comparability, prior year comparable store sales were revised to reflect the 14-week
and 53-week periods ended February 1, 2019 instead of the previously reported 13-week and 52 week periods ended January 25, 2019.
2
See additional information at the end of this release regarding non-GAAP financial measures.
2
NYSE: WMT February 18, 2020 stock.walmart.com
Brett Biggs, Chief Financial Officer of Walmart Inc., said: “The fourth quarter started and ended strong with solid
sales growth through Cyber Monday and in January. In the few weeks before Christmas, we experienced some
softness in a few general merchandise categories in our U.S. stores. However, Walmart U.S. grocery sales and
eCommerce sales were strong throughout the quarter. Sam’s Club performed well, including solid results in
eCommerce. We experienced softness in some key international markets, as well as in Chile, where unrest led to
disruption in the majority of our stores. Walmex, China and Flipkart all had a solid quarter.
The holiday season delivered positive transaction growth and underlying expense leverage was strong for the
quarter. However, it wasn’t as good as expected due to lower sales volumes and some pressure related to
associate scheduling. We understand the factors that affected our results and are developing plans to address
them. We remain confident in our business strategy and our ability to deliver value and convenience for our
customers through an integrated omnichannel offering across the globe.”
Key results
(Amounts in billions, except as noted. Dollar and percentage changes may not recalculate due to rounding.)
Q4 FY20 Q4 FY19 Change FY20 FY19 Change
Revenue $141.7 $138.8 $2.9 2.1% $524.0 $514.4 $9.6 1.9%
Revenue (constant currency)1
$141.7 $138.8 $2.9 2.1% $528.1 $514.4 $13.7 2.7%
Operating income $5.3 $6.1 -$0.7 -12.3% $20.6 $22.0 -$1.4 -6.3%
Operating income (constant currency)1
$5.3 $6.1 -$0.8 -12.7% $20.7 $22.0 -$1.3 -5.8%
Adjusted operating income (constant
currency)1
$5.8 $6.1 -$0.3 -3.7% $21.5 $22.0 -$0.5 -1.9%
(Amounts in billions, except as noted. Dollar and percentage changes may not recalculate due to rounding.)
Free Cash Flow1
YTD FY20 $ Change Returns to Shareholders YTD FY20 % Change
Operating cash flow $25.3 -$2.5 Dividends $6.0 -0.9%
Capital expenditures $10.7 $0.4 Share repurchases2
$5.7 -22.8%
Free cash flow1
$14.6 -$2.9 Total $11.8 -12.9%
1
See additional information at the end of this release regarding non-GAAP financial measures.
2
$5.7 billion remaining of $20 billion authorization approved in October 2017. The company repurchased approximately 54 million shares in fiscal 2020.
3
NYSE: WMT February 18, 2020 stock.walmart.com
Fiscal 2021 full year guidance
The following guidance reflects the company’s expectations for fiscal year 2021. Assumptions in the guidance
include that economic conditions, currency rates and the tax and regulatory landscape remain generally
consistent. The company continues to monitor the events in Chile and the Coronavirus outbreak and has not
included any potential financial effects in its assumptions. Additionally, the guidance assumes no further change in
fair value of the Company’s equity investment in JD.com.
Metric FY21 Guidance
Consolidated net sales growth Around 3% in constant currency
Comp sales growth • Walmart U.S.: at least +2.5%, excluding fuel
• Sam’s Club: minus 50 basis points, excluding fuel, and at least
+3.0%, excluding fuel and tobacco
Walmart U.S. eCommerce net sales
growth
Around 30%
Walmart International net sales growth Around 4% in constant currency
Consolidated expense leverage1
Around 20 basis points
Consolidated operating income2
Similar to EPS growth with Walmart U.S. operating income
growth near the upper-end of the growth rate range
Effective tax rate 25% to 26%
EPS3
$5.00 to $5.15, up 1.5% to 4.5% compared with FY20 adjusted
EPS
Capital expenditures Around $11 billion with a focus on store remodels, customer
initiatives, eCommerce, technology and supply chain
1
Expense leverage to be around 40 basis points as compared with fiscal 2020 reported results.
2
The fiscal 2021 Walmart U.S. and consolidated operating income growth is expected to be higher when compared to fiscal 2020 reported operating income.
3
Fiscal 2021 EPS expected to decline about 1% to 4% as compared with fiscal 2020 GAAP EPS primarily as a result of the fair value change in the Company's
equity investment in JD.com recorded in fiscal 2020.
4
NYSE: WMT February 18, 2020 stock.walmart.com
Segment results
(Amounts in billions, except as noted. Dollar and percentage changes may not recalculate due to rounding.)
U.S.
Q4 FY20 Q4 FY19 Change FY20 FY19 Change
Net sales $92.3 $90.5 $1.8 1.9% $341.0 $331.7 $9.3 2.8%
Comp sales (ex. fuel)1,2
1.9% 4.1% NP NP 2.8% 3.6% NP NP
Transactions2
1.0% 1.5% NP NP NP NP NP NP
Ticket2
0.9% 2.6% NP NP NP NP NP NP
eCommerce ~210 bps ~180 bps NP NP NP NP NP NP
Operating income $4.4 $5.0 -$0.6 -12.7% $17.4 $17.4 $— —%
Adjusted operating income3
$4.9 $5.0 -$0.2 -3.8% $17.8 $17.4 $0.4 2.6%
Q4 FY20 Q4 FY19 Change FY20 FY19 Change
Net sales $33.0 $32.3 $0.7 2.3% $120.1 $120.8 $(0.7) -0.6%
Net sales (constant currency)3
$33.0 $32.3 $0.7 2.2% $124.3 $120.8 $3.4 2.8%
Operating income $1.1 $1.2 -$0.1 -5.6% $3.4 $4.9 $(1.5) -31.0%
Operating income (constant currency)3
$1.1 $1.2 -$0.1 -7.7% $3.5 $4.9 $(1.4) -28.5%
Adjusted operating income (constant
currency)3
$1.2 $1.2 $0.0 0.4% $3.9 $4.9 $(1.0) -20.5%
Q4 FY20 Q4 FY19 Change FY20 FY19 Change
Net sales $15.3 $14.9 $0.4 2.6% $58.8 $57.8 $1.0 1.6%
Comp sales (ex. fuel)2
0.8% 3.4% NP NP 0.7% 3.8% NP NP
Transactions 4.3% 6.3% NP NP NP NP NP NP
Ticket -3.5% -2.9% NP NP NP NP NP NP
eCommerce ~200 bps ~110 bps NP NP NP NP NP NP
Operating income4
$0.4 $0.4 $0.0 -7.2% $1.6 $1.5 $0.1 8.0%
1
Beginning with the first quarter of FY20, we updated our definition of traffic as a component of comparable sales to be all sales transactions in our stores as
well as for eCommerce. Traffic is now called transactions. For comparability, we revised this metric for FY19 and have provided a quarterly summary on our
website at http://www.stock.walmart.com. In connection with the updated definition, we also revised our methodology for calculating customer and
member weekly visits. As of January 31, 2019, our revised count was over 260 million weekly visits as compared to over 275 million weekly visits previously
disclosed.
2
The retail sales calendar for the year ended January 31, 2020 included 53 weeks. As such, fiscal year 2020 comparable store sales are for the 14-week period
and 53-week period ended January 31, 2020, and excludes fuel. For comparability, prior year comparable store sales were revised to reflect the 14-week
and 53-week periods ended February 1, 2019 instead of the previously reported 13-week and 52 week periods ended January 25, 2019.
3
See additional information at the end of this release regarding non-GAAP financial measures.
4
There were no adjustments to operating income for Sam’s Club.
NP - Not provided
5
NYSE: WMT February 18, 2020 stock.walmart.com
Additional highlights for fiscal year 2020
• Appointed John Furner as new President and CEO, Walmart. U.S.
• Appointed Kath McLay as new President and CEO, Sam’s Club
• Appointed Suresh Kumar as new Chief Technology Officer and Chief Development Officer
• Announced the appointment of Donna Morris as new Chief People Officer
• Launched free NextDay delivery from Walmart.com
• Walmart U.S. ended the year with nearly 3,200 grocery pickup locations and more than 1,600 delivery
locations
• Launched Delivery Unlimited, a grocery delivery membership option
• Launched Walmart InHome Delivery to help customers save time by having their fresh groceries and everyday
essentials delivered directly into their homes
• Introduced Walmart Voice Order to make basket building for online grocery orders even easier
• Announced new pilot with autonomous vehicle company, Nuro, for grocery delivery
• Announced participation in the USDA’s SNAP online purchasing pilot
• Announced the creation of a new Angus beef supply chain to service 500 U.S. stores
• Announced a case-ready facility as part of the company’s new Angus beef supply chain
• Relaunched fashion boutique ‘Scoop’ as exclusive brand on Walmart.com
• Launched exclusive line of denim on Walmart.com with Sofia Vergara
• Launched exclusive MoDRN brand in the Home category
• Launched exclusive Hello Bello brand in the Baby category with Kristen Bell and Dax Shepard
• Launched exclusive Flower brand in the Home category on Walmart.com with Drew Barrymore
• Launched new personalized baby registry on Walmart.com
• Introduced first online pet pharmacy, Walmartpetrx.com
• Launched Evolution_18, a health & wellness line from Bobbi Brown, in stores and online
• Announced partnership with KIDBOX to deliver personalized kids fashion through Walmart.com
• Announced new wireless experience online and in stores making it easier for customers to upgrade their
mobile device
• Launched shoppable recipes with Buzzfeed’s Tasty app, a first-of-its-kind feature where customers add recipe
ingredients directly to online grocery cart for pickup or delivery
• Launched new intelligent Retail Lab in a live shopping environment to help unlock the possibilities of Artificial
Intelligence
• Acquired natural language processing startup, Aspectiva
• Acquired assets of Polymorph Labs to expand in-house advertising technology
• Launched new Sam’s Garage app nationwide at Sam’s Club
• Launched same-day pickup nationwide at Sam’s Club
• Launched Sam’s Club Care Accelerator with Humana, a pilot program designed to provide members with
quality care on routine preventative and primary care services
• Opened Walmart Health Clinics in Dallas, GA and Calhoun, GA
• Launched Capital One Walmart Rewards credit card program offering 5% cash back at Walmart.com
• Announced an agreement with Green Dot to jointly establish a new fintech accelerator, TailFin Labs, LLC, to
develop tech-enabled solutions that seamlessly integrate omnichannel shopping and financial services
• Announced partnership with Affirm to allow customers to make purchases and pay over time at Walmart
stores and online
• Announced the launch of PhonePe as a payment option at Walmart’s “B2B Cash & Carry” stores in India
• Reported record sales at Flipkart’s ‘The Big Billion Days’ sales event
• Announced the creation of the Walmart Vriddhi Supplier Development Program to train 50,000 Indian small
businesses to “Make in India” Launched same-day pickup at all Sam’s Club locations in Mexico
• Launched new ordering service through WhatsApp for Superama customers in Mexico
• Opened two new eCommerce fulfillment centers in Mexico
• Opened first distribution center in Walmart International with omnichannel management systems in Chile
• Launched grocery pickup and delivery in Montreal through a partnership with Foodora and expanded
partnership with Instacart to communities across Canada
• Opened next generation Sam’s Club in Shanghai
6
NYSE: WMT February 18, 2020 stock.walmart.com
• Launched new Walmart Daojia delivery app in China
• Announced plans to invest $1.2 billion to upgrade logistics network in China
• Launched blockchain traceability platform for Walmart China
• Announced new collaboration with other major companies as part of the FDA’s program to evaluate the use of
blockchain to protect pharmaceutical product integrity
• Received The Carbon Disclosure Projects prestigious ‘A List’ rating for climate change
• Walmart and U.S. Solar announce agreement for 36 community solar gardens
• Electrify America and Walmart announce completion of more than 120 car charging stations at Walmart stores
nationwide
• Walmart Transportation received 2019 SMARTWAY Excellence Award from EPA for environmental performance
and leadership
• Announced that all coffee sourced for Walmart U.S. private brands is certified sustainable through third-party
groups Fair Trade, Rainforest Alliance Certified or UTZ
• Launched new reusable shopping bag campaign in U.S. stores
• Announced new plastic packaging waste reduction commitments
• Introduced increased rewards and protected PTO for U.S. associates
• Added education benefit programs with seven bachelor’s degrees and two career diplomas in health-related
fields through Live Better U, Walmart’s education benefits program
• Added 14 tech degrees and certifications to Live Better U college offering
• Expanded debt-free college to high schoolers and created graduation bonuses
• Opened first supply chain training academy in the U.S.
• Launched Fresh Learning Lab at Sam’s Club, a hands-on training lab for associates to enhance their skills
7
NYSE: WMT February 18, 2020 stock.walmart.com
About Walmart
Walmart Inc. (NYSE: WMT) helps people around the world save money and live better - anytime and anywhere - in
retail stores, online, and through their mobile devices. Each week, over 265 million customers and members visit
approximately 11,500 stores under 56 banners in 27 countries and eCommerce websites. With fiscal year 2020
revenue of $524 billion, Walmart employs over 2.2 million associates worldwide. Walmart continues to be a
leader in sustainability, corporate philanthropy and employment opportunity. Additional information about
Walmart can be found by visiting http://corporate.walmart.com, on Facebook at http://facebook.com/walmart
and on Twitter at http://twitter.com/walmart.
Investor Relations contact
Dan Binder, CFA (479) 258-7172
Media Relations contact
Randy Hargrove (800) 331-0085
Forward-Looking Statements
This release contains statements as to Walmart management's guidance regarding earnings per share, adjusted earnings per share,
consolidated net sales growth, Walmart U.S. eCommerce net sales growth, Walmart International net sales growth, consolidated
operating income, capital expenditures, expense leverage, Walmart's effective tax rate for the fiscal year ending January 31, 2021, and
comparable sales (excluding fuel) for Walmart U.S. and Sam's Club for the 52 weeks ending January 31, 2021 Walmart believes such
statements are "forward-looking statements" as defined in, and are intended to enjoy the protection of the safe harbor for forward-
looking statements within the meaning of Section 21E of the Securities Exchange Act of 1934, as amended. Assumptions on which such
forward-looking statements are based are also forward-looking statements. Our actual results may differ materially from those expressed
in or implied by any of these forward-looking statements as a result of changes in circumstances, assumptions not being realized or other
risks, uncertainties and factors including: economic, capital markets and business conditions; trends and events around the world and in
the markets in which we operate; currency exchange rate fluctuations, changes in market interest rates and market levels of wages;
changes in the size of various markets, including eCommerce markets; unemployment levels; inflation or deflation, generally and in
particular product categories; consumer confidence, disposable income, credit availability, spending levels, shopping patterns, debt levels
and demand for certain merchandise; the effectiveness of the implementation and operation of our strategies, plans, programs and
initiatives; unexpected changes in our objectives and plans; the impact of acquisitions, investments, divestitures, store or club closures,
and other strategic decisions; our ability to successfully integrate acquired businesses, including within the eCommerce space; changes in
the trading prices of certain equity investments we hold; initiatives of competitors, competitors' entry into and expansion in our markets,
and competitive pressures; customer traffic and average ticket in our stores and clubs and on our eCommerce websites; the mix of
merchandise we sell, the cost of goods we sell and the shrinkage we experience; trends in consumer shopping habits around the world
and in the markets in which we operate; our gross profit margins; the financial performance of Walmart and each of its segments,
including the amounts of our cash flow during various periods; changes in the credit ratings assigned to our commercial paper and debt
securities by credit rating agencies; the amount of our net sales and operating expenses denominated in the U.S. dollar and various
foreign currencies; transportation, energy and utility costs; commodity prices and the price of gasoline and diesel fuel; supply chain
disruptions and disruptions in seasonal buying patterns; the availability of goods from suppliers and the cost of goods acquired from
suppliers; consumer acceptance of and response to our stores, clubs, eCommerce platforms, programs, merchandise offerings and
delivery methods; cyber security events affecting us and related costs and impact to the business; developments in, outcomes of, and
costs incurred in legal or regulatory proceedings to which we are a party or are subject, and the liabilities, obligations and expenses, if
any, that we may incur in connection therewith; casualty and accident-related costs and insurance costs; the turnover in our workforce
and labor costs, including healthcare and other benefit costs; consumer enrollment in health and drug insurance programs and such
programs' reimbursement rates and drug formularies; our effective tax rate and the factors affecting our effective tax rate, including
assessments of certain tax contingencies, valuation allowances, changes in law, administrative audit outcomes, impact of discrete items
and the mix of earnings between the U.S. and Walmart's international operations; changes in existing tax, labor and other laws and
regulations and changes in tax rates including the enactment of laws and the adoption and interpretation of administrative rules and
regulations; the imposition of new taxes on imports, new tariffs and changes in existing tariff rates; the imposition of new trade
restrictions and changes in existing trade restrictions; adoption or creation of new, and modification of existing, governmental policies,
programs, initiatives and actions in the markets in which Walmart operates and elsewhere and actions with respect to such policies,
programs and initiatives; changes in accounting estimates or judgments; the level of public assistance payments; natural disasters,
changes in climate, geopolitical events and catastrophic events; and changes in generally accepted accounting principles in the United
States.
Our most recent annual report on Form 10-K and subsequent quarterly reports on Form 10-Q filed with the SEC discuss other risks and
factors that could cause actual results to differ materially from those expressed or implied by any forward-looking statement in the
presentations. We urge you to consider all of the risks, uncertainties and factors identified above or discussed in such reports carefully in
evaluating the forward-looking statements in this release. Walmart cannot assure you that the results reflected in or implied by any
forward-looking statement will be realized or, even if substantially realized, that those results will have the forecasted or expected
consequences and effects for or on our operations or financial performance. The forward-looking statements made in the presentation
are as of the date of this meeting. Walmart undertakes no obligation to update these forward-looking statements to reflect subsequent
events or circumstances.
8
Walmart Inc.
Condensed Consolidated Statements of Income
(Unaudited)
Three Months Ended Fiscal Years Ended
January 31, January 31,
(Amounts in millions, except per share data) 2020 2019
Percent
Change 2020 2019
Percent
Change
Revenues:
Net sales $140,608 $137,743 2.1 % $519,926 $510,329 1.9 %
Membership and other income 1,063 1,050 1.2 % 4,038 4,076 (0.9)%
Total revenues 141,671 138,793 2.1 % 523,964 514,405 1.9 %
Costs and expenses:
Cost of sales 107,748 104,907 2.7 % 394,605 385,301 2.4 %
Operating, selling, general and administrative expenses 28,601 27,819 2.8 % 108,791 107,147 1.5 %
Operating income 5,322 6,067 (12.3)% 20,568 21,957 (6.3)%
Interest:
Debt 569 577 (1.4)% 2,262 1,975 14.5 %
Finance, capital lease and financing obligations 83 92 (9.8)% 337 371 (9.2)%
Interest income (41) (64) (35.9)% (189) (217) (12.9)%
Interest, net 611 605 1.0 % 2,410 2,129 13.2 %
Other (gains) and losses (962) (202) 376.2 % (1,958) 8,368 (123.4)%
Income before income taxes 5,673 5,664 0.2 % 20,116 11,460 75.5 %
Provision for income taxes 1,379 1,851 (25.5)% 4,915 4,281 14.8 %
Consolidated net income 4,294 3,813 12.6 % 15,201 7,179 111.7 %
Consolidated net income attributable to noncontrolling interest (153) (126) 21.4 % (320) (509) (37.1)%
Consolidated net income attributable to Walmart $ 4,141 $ 3,687 12.3 % $ 14,881 $ 6,670 123.1 %
Net income per common share:
Basic net income per common share attributable to Walmart $ 1.46 $ 1.27 15.0 % $ 5.22 $ 2.28 128.9 %
Diluted net income per common share attributable to Walmart $ 1.45 $ 1.27 14.2 % $ 5.19 $ 2.26 129.6 %
Weighted-average common shares outstanding:
Basic 2,836 2,896 2,850 2,929
Diluted 2,855 2,914 2,868 2,945
Dividends declared per common share $ — $ — $ 2.12 $ 2.08
9
Walmart Inc.
Condensed Consolidated Balance Sheets
(Unaudited)
January 31, January 31,
(Amounts in millions) 2020 2019
ASSETS
Current assets:
Cash and cash equivalents $ 9,465 $ 7,722
Receivables, net 6,284 6,283
Inventories 44,435 44,269
Prepaid expenses and other 1,622 3,623
Total current assets 61,806 61,897
Property and equipment, net 105,208 104,317
Operating lease right-of-use assets 17,424 —
Finance lease right-of-use assets, net 4,417 —
Property under capital lease and financing obligations, net — 7,078
Goodwill 31,073 31,181
Other long-term assets 16,567 14,822
Total assets $ 236,495 $ 219,295
LIABILITIES AND EQUITY
Current liabilities:
Short-term borrowings $ 575 $ 5,225
Accounts payable 46,973 47,060
Accrued liabilities 22,296 22,159
Accrued income taxes 280 428
Long-term debt due within one year 5,362 1,876
Operating lease obligations due within one year 1,793 —
Finance lease obligations due within one year 511 —
Capital leases and financing obligations due within one year — 729
Total current liabilities 77,790 77,477
Long-term debt 43,714 43,520
Long-term operating lease obligations 16,171 —
Long-term finance lease obligations 4,307 —
Long-term capital lease and financing obligations — 6,683
Deferred income taxes and other 12,961 11,981
Commitments and contingencies
Equity:
Common stock 284 288
Capital in excess of par value 3,247 2,965
Retained earnings 83,943 80,785
Accumulated other comprehensive loss (12,805) (11,542)
Total Walmart shareholders’ equity 74,669 72,496
Noncontrolling interest 6,883 7,138
Total equity 81,552 79,634
Total liabilities and equity $ 236,495 $ 219,295
Note: The Company adopted ASU 2016-02, Leases (Topic 842), and related amendments as of February 1, 2019 under the modified retrospective
approach and, therefore, has not revised comparative periods.
10
Walmart Inc.
Condensed Consolidated Statements of Cash Flows
(Unaudited)
Fiscal Years Ended
January 31,
(Amounts in millions) 2020 2019
Cash flows from operating activities:
Consolidated net income $ 15,201 $ 7,179
Adjustments to reconcile consolidated net income to net cash provided by operating activities:
Depreciation and amortization 10,987 10,678
Unrealized (gains) and losses (1,886) 3,516
(Gains) and losses for disposal of business operations 15 4,850
Asda Pension Contribution (1,036) —
Deferred income taxes 320 (499)
Other operating activities 1,981 1,734
Changes in certain assets and liabilities, net of effects of acquisitions:
Receivables, net 154 (368)
Inventories (300) (1,311)
Accounts payable (274) 1,831
Accrued liabilities 186 183
Accrued income taxes (93) (40)
Net cash provided by operating activities 25,255 27,753
Cash flows from investing activities:
Payments for property and equipment (10,705) (10,344)
Proceeds from the disposal of property and equipment 321 519
Proceeds from disposal of certain operations 833 876
Payments for business acquisitions, net of cash acquired (56) (14,656)
Other investing activities 479 (431)
Net cash used in investing activities (9,128) (24,036)
Cash flows from financing activities:
Net change in short-term borrowings (4,656) (53)
Proceeds from issuance of long-term debt 5,492 15,872
Repayments of long-term debt (1,907) (3,784)
Dividends paid (6,048) (6,102)
Purchase of Company stock (5,717) (7,410)
Dividends paid to noncontrolling interest (555) (431)
Other financing activities (908) (629)
Net cash used in financing activities (14,299) (2,537)
Effect of exchange rates on cash, cash equivalents and restricted cash (69) (438)
Net increase in cash, cash equivalents and restricted cash 1,759 742
Cash, cash equivalents and restricted cash at beginning of year 7,756 7,014
Cash, cash equivalents and restricted cash at end of year $ 9,515 $ 7,756
11
Walmart Inc.
Supplemental Financial Information
(Unaudited)
Net sales and operating income
Net Sales Operating Income
Three Months Ended Three Months Ended
January 31, January 31,
(dollars in millions) 2020 2019
Percent
Change 2020 2019
Percent
Change
Walmart U.S. $ 92,271 $ 90,520 1.9% $ 4,403 $ 5,043 -12.7%
Walmart International 33,049 32,317 2.3% 1,105 1,170 -5.6%
Sam’s Club 15,288 14,906 2.6% 384 414 -7.2%
Corporate and support — — N/A (570) (560) 1.8%
Consolidated $ 140,608 $ 137,743 2.1% $ 5,322 $ 6,067 -12.3%
Net Sales Operating Income
Fiscal Years Ended Fiscal Years Ended
January 31, January 31,
(dollars in millions) 2020 2019
Percent
Change 2020 2019
Percent
Change
Walmart U.S. $ 341,004 $ 331,666 2.8% $ 17,380 $ 17,386 —%
Walmart International 120,130 120,824 -0.6% 3,370 4,883 -31.0%
Sam’s Club 58,792 57,839 1.6% 1,642 1,520 8.0%
Corporate and support — — N/A (1,824) (1,832) -0.4%
Consolidated $ 519,926 $ 510,329 1.9% $ 20,568 $ 21,957 -6.3%
U.S. comparable sales results1
With Fuel Without Fuel Fuel Impact
14 Weeks Ended 14 Weeks Ended 14 Weeks Ended
1/31/2020 2/1/2019 1/31/2020 2/1/2019 1/31/2020 2/1/2019
Walmart U.S. 2.0% 4.2% 1.9% 4.1% 0.1% 0.1%
Sam’s Club 2.2% 3.7% 0.8% 3.4% 1.4% 0.3%
Total U.S. 2.0% 4.1% 1.8% 4.0% 0.2% 0.1%
With Fuel Without Fuel Fuel Impact
53 Weeks Ended 53 Weeks Ended 53 Weeks Ended
1/31/2020 2/1/2019 1/31/2020 2/1/2019 1/31/2020 2/1/2019
Walmart U.S. 2.8% 3.7% 2.8% 3.6% 0.0% 0.1%
Sam’s Club 1.5% 5.4% 0.7% 3.8% 0.8% 1.6%
Total U.S. 2.6% 3.9% 2.5% 3.6% 0.1% 0.3%
Comparable sales is a metric that indicates the performance of our existing stores and clubs and it is important to
review in conjunction with the Company’s financial results reported in accordance with GAAP. Comparable sales
excluding fuel is also an important, separate metric that indicates the performance of our existing stores and clubs
without considering fuel, which is volatile and unpredictable. Other companies in our industry may calculate
comparable sales differently, limiting the comparability of the metric.
1
The retail sales calendar for the year ended January 31, 2020 included 53 weeks. As such, fiscal year 2020 comparable store sales are for the 14-week period and
53-week period ended January 31, 2020, and excludes fuel. For comparability, prior year comparable store sales were revised to reflect the 14-week and 53-week
periods ended February 1, 2019 instead of the previously reported 13-week and 52 week periods ended January 25, 2019.
12
Walmart Inc.
Reconciliations of and Other Information Regarding Non-GAAP Financial Measures
(Unaudited)
The following information provides reconciliations of certain non-GAAP financial measures presented in the press
release to which this reconciliation is attached to the most directly comparable financial measures calculated and
presented in accordance with generally accepted accounting principles (GAAP). The company has provided the
non-GAAP financial information presented in the press release, which is not calculated or presented in accordance
with GAAP, as information supplemental and in addition to the financial measures presented in the press release
that are calculated and presented in accordance with GAAP. Such non-GAAP financial measures should not be
considered superior to, as a substitute for or alternative to, and should be considered in conjunction with, the GAAP
financial measures presented in the press release. The non-GAAP financial measures in the press release may
differ from similar measures used by other companies.
Constant Currency
In discussing our operating results, the term currency exchange rates refers to the currency exchange rates we use
to convert the operating results for countries where the functional currency is not the U.S. dollar into U.S. dollars or
for countries experiencing hyperinflation. We calculate the effect of changes in currency exchange rates as the
difference between current period activity translated using the current period’s currency exchange rates and the
comparable prior year period’s currency exchange rates. Additionally, no currency exchange rate fluctuations are
calculated for non-USD acquisitions until owned for 12 months.
Throughout our discussion, we refer to the results of this calculation as the impact of currency exchange rate
fluctuations. When we refer to constant currency operating results, this means operating results without the impact
of the currency exchange rate fluctuations. The disclosure of constant currency amounts or results permits
investors to better understand Walmart’s underlying performance without the effects of currency exchange rate
fluctuations.
The table below reflects the calculation of constant currency for total revenues, net sales and operating income for
the three months and fiscal year ended January 31, 2020.
Three Months Ended January 31, Fiscal Year Ended January 31,
Walmart
International Consolidated
Walmart
International Consolidated
(Dollars in millions) 2020
Percent
Change1
2020
Percent
Change1
2020
Percent
Change1
2020
Percent
Change1
Total revenues:
As reported $ 33,426 2.4% $141,671 2.1% $121,432 -0.6% $523,964 1.9%
Currency exchange rate fluctuations -13 N/A -13 N/A 4,169 N/A 4,169 N/A
Constant currency total revenues $ 33,413 2.3% $141,658 2.1% $125,601 2.8% $528,133 2.7%
Net sales:
As reported $ 33,049 2.3% $140,608 2.1% $120,130 -0.6% $519,926 1.9%
Currency exchange rate fluctuations -12 N/A -12 N/A 4,137 N/A 4,137 N/A
Constant currency net sales $ 33,037 2.2% $140,596 2.1% $124,267 2.8% $524,063 2.7%
Operating income:
As reported $ 1,105 -5.6% $ 5,322 -12.3% $ 3,370 -31.0% $ 20,568 -6.3%
Currency exchange rate fluctuations -25 N/A -25 N/A 120 N/A 120 N/A
Constant currency operating income $ 1,080 -7.7% $ 5,297 -12.7% $ 3,490 -28.5% $ 20,688 -5.8%
1
Change versus prior year comparable period.
13
Adjusted operating income
Adjusted operating income is considered a non-GAAP financial measure under the SEC’s rules because it excludes
certain charges included in operating income calculated in accordance with GAAP. Management believes that
adjusted operating income is a meaningful measure to share with investors because it best allows comparison of
the performance with that of the comparable period. In addition, adjusted operating income affords investors a view
of what management considers Walmart’s core earnings performance and the ability to make a more informed
assessment of such core earnings performance as compared with that of the prior year.
When we refer to adjusted operating income in constant currency this means adjusted operating results without the
impact of the currency exchange rate fluctuations. The disclosure of constant currency amounts or results permits
investors to better understand Walmart’s underlying performance without the effects of currency exchange rate
fluctuations. The tables below reflects the calculation of adjusted operating income and adjusted operating income
in constant currency for the three months and fiscal year ended January 31, 2020.
Three months ended January 31,
2020
Percent
Change1
2020
Percent
Change1
2020
Percent
Change1
(Dollars in millions) Walmart US Walmart International Consolidated
Operating income:
Operating income, as reported $ 4,403 (12.7)% $ 1,105 (5.6)% $ 5,322 (12.3)%
Business restructuring charges2
450 96 546
Adjusted operating income 4,853 (3.8)% 1,201 2.6 % 5,868 (3.3)%
Currency exchange rate fluctuations N/A N/A (26) N/A (26) N/A
Adjusted operating income, constant
currency
$ 4,853 (3.8)% $ 1,175 0.4 % $ 5,842 (3.7)%
Fiscal year ended January 31,
2020
Percent
Change1
2020
Percent
Change1
2020
Percent
Change1
(Dollars in millions) Walmart US Walmart International Consolidated
Operating income:
Operating income, as reported $ 17,380 0.0% $ 3,370 (31.0)% $ 20,568 (6.3)%
Business restructuring charges2
450 N/A 389 N/A 839 N/A
Adjusted operating income 17,830 2.6% 3,759 (23.0)% 21,407 (2.5)%
Currency exchange rate fluctuations N/A N/A 124 N/A 124 N/A
Adjusted operating income, constant
currency
$ 17,830 2.6% $ 3,883 (20.5)% $ 21,531 (1.9)%
1
Change versus prior year comparable period.
2
Business restructuring charges primarily consists of (1) $399 million of non-cash impairment charges for certain trade names, acquired
developed technology and property and equipment due to strategic business decisions that resulted in the write down of certain eCommerce
assets in Walmart U.S. and $51 million in related severance costs; and (2) $96 million of non-cash impairment charges related to strategic
business decisions that resulted in the write down of certain assets in Walmart International. Additionally, for the fiscal year ended January 31,
2020, business restructuring charges includes $293 million in non-cash impairment charges in Q3 for the Jabong.com trade name.
14
Free Cash Flow
We define free cash flow as net cash provided by operating activities in a period minus payments for property and
equipment made in that period. We had net cash provided by operating activities of $25.3 billion for the fiscal year
ended January 31, 2020, which decreased when compared to $27.8 billion for the fiscal year ended January 31,
2019 primarily due to the contribution to our Asda pension plan in anticipation of its future settlement, the inclusion
of a full year of Flipkart operations, and the timing of vendor payments. We generated free cash flow of $14.6 billion
for the fiscal year ended January 31, 2020, which decreased when compared to $17.4 billion for the fiscal year
ended January 31, 2019 due to the same reasons as the decline in net cash provided by operating activities, as well
as $0.4 billion in increased capital expenditures.
Free cash flow is considered a non-GAAP financial measure. Management believes, however, that free cash flow,
which measures our ability to generate additional cash from our business operations, is an important financial
measure for use in evaluating the company’s financial performance. Free cash flow should be considered in
addition to, rather than as a substitute for, consolidated net income as a measure of our performance and net cash
provided by operating activities as a measure of our liquidity.
Additionally, Walmart’s definition of free cash flow is limited, in that it does not represent residual cash flows
available for discretionary expenditures, due to the fact that the measure does not deduct the payments required for
debt service and other contractual obligations or payments made for business acquisitions. Therefore, we believe it
is important to view free cash flow as a measure that provides supplemental information to our Consolidated
Statements of Cash Flows.
Although other companies report their free cash flow, numerous methods may exist for calculating a company’s free
cash flow. As a result, the method used by Walmart’s management to calculate our free cash flow may differ from
the methods used by other companies to calculate their free cash flow.
The following table sets forth a reconciliation of free cash flow, a non-GAAP financial measure, to net cash provided
by operating activities, which we believe to be the GAAP financial measure most directly comparable to free cash
flow, as well as information regarding net cash used in investing activities and net cash used in financing activities.
Fiscal Years Ended
January 31,
(Dollars in millions) 2020 2019
Net cash provided by operating activities $ 25,255 $ 27,753
Payments for property and equipment (capital expenditures) (10,705) (10,344)
Free cash flow $ 14,550 $ 17,409
Net cash used in investing activities1
$ (9,128) $ (24,036)
Net cash used in financing activities (14,299) (2,537)
1
“Net cash used in investing activities” includes payments for property and equipment, which is also included in our computation of free cash
flow.
15
Adjusted EPS
Adjusted diluted earnings per share attributable to Walmart (Adjusted EPS) is considered a non-GAAP financial
measure under the SEC’s rules because it excludes certain amounts included in the diluted earnings per share
attributable to Walmart calculated in accordance with GAAP (EPS), the most directly comparable financial measure
calculated in accordance with GAAP. Management believes that Adjusted EPS is a meaningful measure to share
with investors because it best allows comparison of the performance with that of the comparable period. In
addition, Adjusted EPS affords investors a view of what management considers Walmart’s core earnings
performance and the ability to make a more informed assessment of such core earnings performance with that of
the prior year.
We adjust for the unrealized gains and losses on the company’s equity investment in JD.com each quarter because
although the Company’s investment in JD.com was a strategic decision for the company’s retail operations in China,
management’s measurement of that strategy is primarily focused on the Walmart China financial results rather than
the investment value of JD.com. Additionally, management does not forecast changes in fair value of its equity
investments. Accordingly, management adjusts EPS each quarter for the unrealized JD.com investment gains and
losses each quarter.
We have calculated Adjusted EPS for the three months and fiscal year ended January 31, 2020 by adjusting EPS
for the following: (1) unrealized gains and losses on the company’s equity investment in JD.com; (2) a tax benefit on
the revaluation of deferred tax liabilities as a result of an income tax rate reduction in India; (3) certain income tax
matters; (4) certain business restructuring charges which primarily includes non-cash impairment charges on certain
trade names and other long-lived assets.
Three Months Ended January 31, 2020
Diluted earnings per share:
Reported EPS $ 1.45
Adjustments:
Pre-Tax
Impact
Tax
Impact1,5
NCI
Impact2
Net
Impact
Unrealized (gains) and losses on JD.com investment $ (0.33) $ 0.07 $ — $ (0.26)
Business restructuring charges4
0.20 (0.05) — 0.15
Tax benefit from income tax rate reduction in India — (0.14) 0.03 (0.11)
Certain income tax matters3
0.01 0.14 — 0.15
Net adjustments $ (0.07)
Adjusted EPS $ 1.38
Fiscal Year Ended January 31, 20206
Diluted earnings per share:
Reported EPS $ 5.19
Adjustments:
Pre-Tax
Impact
Tax
Impact1,5
NCI
Impact2
Net
Impact
Unrealized (gains) and losses on JD.com investment $ (0.65) $ 0.14 $ — $ (0.51)
Business restructuring charges4
0.30 (0.08) (0.01) $ 0.21
Tax benefit from rate reduction in India — (0.14) 0.03 (0.11)
Certain income tax matters3
0.01 0.14 — $ 0.15
Net adjustments $ (0.26)
Adjusted EPS $ 4.93
1
Calculated based on nature of item, including any realizable deductions, and statutory rate in effect for relevant jurisdictions.
2
Calculated based on the ownership percentages of our noncontrolling interests.
3
Represents a charge related to certain income tax matters and accrued interest unrelated to current period operations.
4
Business restructuring charges primarily consists of non-cash impairment charges for certain trade names, acquired developed technology, and
property and equipment due to decisions that resulted in the write-off of certain assets in Walmart U.S. and Walmart International. Additionally,
for the fiscal year ended January 31, 2020, business restructuring charges includes non-cash impairment charges on the Jabong.com trade
name in Q3.
5
The reported effective tax rate was 24.3% and 24.4% for the three months and fiscal year ended January 31, 2020, respectively. When
adjusted for the above items, the effective tax rate was 24.7% for both the three months and fiscal year ended ended January 31, 2020.
6
Quarterly adjustments or adjusted EPS may not sum to YTD adjustments or YTD adjusted EPS due to rounding.
16
As previously disclosed in our fiscal year ended January 31, 2019 press release, we have calculated Adjusted EPS
for the three months and fiscal year ended January 31, 2019 by adjusting EPS for the following: (1) for the fiscal
year ended January 31, 2019 only, the loss on sale of the majority stake in Walmart Brazil, (2) an adjustment to the
provisional amount recorded in the third quarter of fiscal 2019 related to Tax Reform and (3) unrealized gains and
losses on our JD.com investment. The provisional measurement period related to Tax Reform ended in the fourth
quarter of fiscal 2019.
Three Months Ended January 31, 2019
Diluted earnings per share:
Reported EPS $ 1.27
Adjustments:
Pre-Tax
Impact Tax Impact1
Net Impact
Unrealized (gains) and losses on JD.com investment $ (0.06) $ 0.03 $ (0.03)
Adjustment to provisional amount for Tax Reform — 0.17 0.17
Net adjustments $ 0.14
Adjusted EPS $ 1.41
Fiscal Year Ended January 31, 20192
Diluted earnings per share:
Reported EPS $ 2.26
Adjustments:
Pre-Tax
Impact Tax Impact1
Net Impact
Loss on sale of majority stake in Walmart Brazil $ 1.64 $ (0.10) $ 1.54
Unrealized (gains) and losses on JD.com investment 1.20 (0.25) 0.95
Adjustment to provisional amount for Tax Reform — 0.16 0.16
Net adjustments $ 2.65
Adjusted EPS $ 4.91
1
Calculated based on nature of item, including any realizable deductions, and statutory rate in effect for relevant jurisdictions.
2
Quarterly adjustments or adjusted EPS may not sum to YTD adjustments or YTD adjusted EPS due to rounding.

More Related Content

What's hot

williams 3Q 2008
williams 3Q 2008williams 3Q 2008
williams 3Q 2008finance21
 
P&G Delivers Second Quarter EPS and Organic Sales in Line with Expectations
P&G Delivers Second Quarter EPS and Organic Sales in Line with Expectations P&G Delivers Second Quarter EPS and Organic Sales in Line with Expectations
P&G Delivers Second Quarter EPS and Organic Sales in Line with Expectations finance3
 
P&G Reports Strong Sales and EPS Growth -- Increases Fiscal Year Outlook
P&G Reports Strong Sales and EPS Growth -- Increases Fiscal Year Outlook P&G Reports Strong Sales and EPS Growth -- Increases Fiscal Year Outlook
P&G Reports Strong Sales and EPS Growth -- Increases Fiscal Year Outlook finance3
 
I-Byte Retail and consumer goods Industry
I-Byte Retail and consumer goods IndustryI-Byte Retail and consumer goods Industry
I-Byte Retail and consumer goods IndustryEGBG Services
 
P&G Delivers Double-Digit Sales Growth in First Quarter
P&G Delivers Double-Digit Sales Growth in First QuarterP&G Delivers Double-Digit Sales Growth in First Quarter
P&G Delivers Double-Digit Sales Growth in First Quarterfinance3
 
P&G Reports 8% Net Sales and 22% EPS Growth in the Fourth Quarter
P&G Reports 8% Net Sales and 22% EPS Growth in the Fourth Quarter P&G Reports 8% Net Sales and 22% EPS Growth in the Fourth Quarter
P&G Reports 8% Net Sales and 22% EPS Growth in the Fourth Quarter finance3
 
Wal Mart Store Financial ResultsFebruary 03/07/08
Wal Mart Store Financial ResultsFebruary 	03/07/08Wal Mart Store Financial ResultsFebruary 	03/07/08
Wal Mart Store Financial ResultsFebruary 03/07/08finance1
 
P&G Reports Fourth Quarter EPS of $0.92 and Operating Profit Growth of 13%, b...
P&G Reports Fourth Quarter EPS of $0.92 and Operating Profit Growth of 13%, b...P&G Reports Fourth Quarter EPS of $0.92 and Operating Profit Growth of 13%, b...
P&G Reports Fourth Quarter EPS of $0.92 and Operating Profit Growth of 13%, b...finance3
 
williams 1Q 2008
williams 1Q 2008williams 1Q 2008
williams 1Q 2008finance21
 
P&G Reports First Quarter EPS of $1.03 Up 12% on 9% Sales Growth
P&G Reports First Quarter EPS of $1.03 Up 12% on 9% Sales GrowthP&G Reports First Quarter EPS of $1.03 Up 12% on 9% Sales Growth
P&G Reports First Quarter EPS of $1.03 Up 12% on 9% Sales Growthfinance3
 
P&G Delivers at Top End of Increased Earnings Expectations
P&G Delivers at Top End of Increased Earnings ExpectationsP&G Delivers at Top End of Increased Earnings Expectations
P&G Delivers at Top End of Increased Earnings Expectationsfinance3
 
P&G Reports EPS of $0.92, up 16% Behind 8% Sales Growth
P&G Reports EPS of $0.92, up 16% Behind 8% Sales Growth P&G Reports EPS of $0.92, up 16% Behind 8% Sales Growth
P&G Reports EPS of $0.92, up 16% Behind 8% Sales Growth finance3
 
3m Transcript 2006 1st
3m Transcript 2006 1st3m Transcript 2006 1st
3m Transcript 2006 1stfinance10
 
P&G Beats First Quarter Earnings Expectations on Record Volume and Sales
P&G Beats First Quarter Earnings Expectations on Record Volume and SalesP&G Beats First Quarter Earnings Expectations on Record Volume and Sales
P&G Beats First Quarter Earnings Expectations on Record Volume and Salesfinance3
 
P&G Reports Strong Sales and Earnings Growth, Increases Fiscal Year Outlook
P&G Reports Strong Sales and Earnings Growth, Increases Fiscal Year Outlook P&G Reports Strong Sales and Earnings Growth, Increases Fiscal Year Outlook
P&G Reports Strong Sales and Earnings Growth, Increases Fiscal Year Outlook finance3
 
Q3 2013 Earnings Presentation
Q3 2013 Earnings Presentation Q3 2013 Earnings Presentation
Q3 2013 Earnings Presentation Masco_Investors
 

What's hot (19)

williams 3Q 2008
williams 3Q 2008williams 3Q 2008
williams 3Q 2008
 
P&G Delivers Second Quarter EPS and Organic Sales in Line with Expectations
P&G Delivers Second Quarter EPS and Organic Sales in Line with Expectations P&G Delivers Second Quarter EPS and Organic Sales in Line with Expectations
P&G Delivers Second Quarter EPS and Organic Sales in Line with Expectations
 
P&G Reports Strong Sales and EPS Growth -- Increases Fiscal Year Outlook
P&G Reports Strong Sales and EPS Growth -- Increases Fiscal Year Outlook P&G Reports Strong Sales and EPS Growth -- Increases Fiscal Year Outlook
P&G Reports Strong Sales and EPS Growth -- Increases Fiscal Year Outlook
 
I-Byte Retail and consumer goods Industry
I-Byte Retail and consumer goods IndustryI-Byte Retail and consumer goods Industry
I-Byte Retail and consumer goods Industry
 
P&G Delivers Double-Digit Sales Growth in First Quarter
P&G Delivers Double-Digit Sales Growth in First QuarterP&G Delivers Double-Digit Sales Growth in First Quarter
P&G Delivers Double-Digit Sales Growth in First Quarter
 
P&G Reports 8% Net Sales and 22% EPS Growth in the Fourth Quarter
P&G Reports 8% Net Sales and 22% EPS Growth in the Fourth Quarter P&G Reports 8% Net Sales and 22% EPS Growth in the Fourth Quarter
P&G Reports 8% Net Sales and 22% EPS Growth in the Fourth Quarter
 
yum analyst
yum analystyum analyst
yum analyst
 
Wal Mart Store Financial ResultsFebruary 03/07/08
Wal Mart Store Financial ResultsFebruary 	03/07/08Wal Mart Store Financial ResultsFebruary 	03/07/08
Wal Mart Store Financial ResultsFebruary 03/07/08
 
P&G Reports Fourth Quarter EPS of $0.92 and Operating Profit Growth of 13%, b...
P&G Reports Fourth Quarter EPS of $0.92 and Operating Profit Growth of 13%, b...P&G Reports Fourth Quarter EPS of $0.92 and Operating Profit Growth of 13%, b...
P&G Reports Fourth Quarter EPS of $0.92 and Operating Profit Growth of 13%, b...
 
Q1 2009 Earning Report of Tupperware Corp.
Q1 2009 Earning Report of Tupperware Corp.Q1 2009 Earning Report of Tupperware Corp.
Q1 2009 Earning Report of Tupperware Corp.
 
williams 1Q 2008
williams 1Q 2008williams 1Q 2008
williams 1Q 2008
 
Ebay News 2005 7 20 Earnings
Ebay News 2005 7 20 EarningsEbay News 2005 7 20 Earnings
Ebay News 2005 7 20 Earnings
 
P&G Reports First Quarter EPS of $1.03 Up 12% on 9% Sales Growth
P&G Reports First Quarter EPS of $1.03 Up 12% on 9% Sales GrowthP&G Reports First Quarter EPS of $1.03 Up 12% on 9% Sales Growth
P&G Reports First Quarter EPS of $1.03 Up 12% on 9% Sales Growth
 
P&G Delivers at Top End of Increased Earnings Expectations
P&G Delivers at Top End of Increased Earnings ExpectationsP&G Delivers at Top End of Increased Earnings Expectations
P&G Delivers at Top End of Increased Earnings Expectations
 
P&G Reports EPS of $0.92, up 16% Behind 8% Sales Growth
P&G Reports EPS of $0.92, up 16% Behind 8% Sales Growth P&G Reports EPS of $0.92, up 16% Behind 8% Sales Growth
P&G Reports EPS of $0.92, up 16% Behind 8% Sales Growth
 
3m Transcript 2006 1st
3m Transcript 2006 1st3m Transcript 2006 1st
3m Transcript 2006 1st
 
P&G Beats First Quarter Earnings Expectations on Record Volume and Sales
P&G Beats First Quarter Earnings Expectations on Record Volume and SalesP&G Beats First Quarter Earnings Expectations on Record Volume and Sales
P&G Beats First Quarter Earnings Expectations on Record Volume and Sales
 
P&G Reports Strong Sales and Earnings Growth, Increases Fiscal Year Outlook
P&G Reports Strong Sales and Earnings Growth, Increases Fiscal Year Outlook P&G Reports Strong Sales and Earnings Growth, Increases Fiscal Year Outlook
P&G Reports Strong Sales and Earnings Growth, Increases Fiscal Year Outlook
 
Q3 2013 Earnings Presentation
Q3 2013 Earnings Presentation Q3 2013 Earnings Presentation
Q3 2013 Earnings Presentation
 

Similar to WMT Q4 Earnings Report

Lby 2018 q2 earnings call final
Lby 2018 q2 earnings call  finalLby 2018 q2 earnings call  final
Lby 2018 q2 earnings call finalinvestorslibbey
 
Q1 FY20 Earnings Release
Q1 FY20 Earnings ReleaseQ1 FY20 Earnings Release
Q1 FY20 Earnings ReleaseWalmart
 
Q4 2015 earnings conference call presentation 24 2_16_final
Q4 2015 earnings conference call presentation 24 2_16_finalQ4 2015 earnings conference call presentation 24 2_16_final
Q4 2015 earnings conference call presentation 24 2_16_finalMyers_Investors
 
Earnings-Presentation-FY24-Q2.pdf
Earnings-Presentation-FY24-Q2.pdfEarnings-Presentation-FY24-Q2.pdf
Earnings-Presentation-FY24-Q2.pdfbrobeans
 
Lby 2018 q3 earnings call final4
Lby 2018 q3 earnings call final4Lby 2018 q3 earnings call final4
Lby 2018 q3 earnings call final4investorslibbey
 
pitney bowes 44B330C0-AAF8-412A-8D3C-CD5D3C3E3E07_Q408_Release
pitney bowes 44B330C0-AAF8-412A-8D3C-CD5D3C3E3E07_Q408_Releasepitney bowes 44B330C0-AAF8-412A-8D3C-CD5D3C3E3E07_Q408_Release
pitney bowes 44B330C0-AAF8-412A-8D3C-CD5D3C3E3E07_Q408_Releasefinance47
 
pitney bowes 44B330C0-AAF8-412A-8D3C-CD5D3C3E3E07_Q408_Release
pitney bowes 44B330C0-AAF8-412A-8D3C-CD5D3C3E3E07_Q408_Releasepitney bowes 44B330C0-AAF8-412A-8D3C-CD5D3C3E3E07_Q408_Release
pitney bowes 44B330C0-AAF8-412A-8D3C-CD5D3C3E3E07_Q408_Releasefinance47
 
pitney bowes 44B330C0-AAF8-412A-8D3C-CD5D3C3E3E07_Q408_Release
pitney bowes 44B330C0-AAF8-412A-8D3C-CD5D3C3E3E07_Q408_Releasepitney bowes 44B330C0-AAF8-412A-8D3C-CD5D3C3E3E07_Q408_Release
pitney bowes 44B330C0-AAF8-412A-8D3C-CD5D3C3E3E07_Q408_Releasefinance47
 
pitney bowes 44B330C0-AAF8-412A-8D3C-CD5D3C3E3E07_Q408_Release
pitney bowes  44B330C0-AAF8-412A-8D3C-CD5D3C3E3E07_Q408_Releasepitney bowes  44B330C0-AAF8-412A-8D3C-CD5D3C3E3E07_Q408_Release
pitney bowes 44B330C0-AAF8-412A-8D3C-CD5D3C3E3E07_Q408_Releasefinance47
 
MBA 503 Team Presentation
MBA 503 Team PresentationMBA 503 Team Presentation
MBA 503 Team PresentationTodd_Weston
 
Lby 2018 q1 earnings call final
Lby 2018 q1 earnings call finalLby 2018 q1 earnings call final
Lby 2018 q1 earnings call finalinvestorslibbey
 
20180509 sauc q1 2018 teleconference slides final
20180509 sauc q1 2018 teleconference slides final20180509 sauc q1 2018 teleconference slides final
20180509 sauc q1 2018 teleconference slides finaldrhincorporated
 
I-Bytes Retail & Consumer Goods Industry
I-Bytes Retail & Consumer Goods IndustryI-Bytes Retail & Consumer Goods Industry
I-Bytes Retail & Consumer Goods IndustryEGBG Services
 
Final q3 earnings call slide deck 2 6 1030am
Final q3 earnings call slide deck 2 6 1030amFinal q3 earnings call slide deck 2 6 1030am
Final q3 earnings call slide deck 2 6 1030amacxiom2016ir
 
Fy14 q4earningsreleasefinal wal mart
Fy14 q4earningsreleasefinal wal martFy14 q4earningsreleasefinal wal mart
Fy14 q4earningsreleasefinal wal martFrank Ragol
 
Genworth MI Canada Inc. Second Quarter 2015
Genworth MI Canada Inc. Second Quarter 2015Genworth MI Canada Inc. Second Quarter 2015
Genworth MI Canada Inc. Second Quarter 2015genworth_financial
 
Q1 2015 Earnings Presentation
Q1 2015 Earnings PresentationQ1 2015 Earnings Presentation
Q1 2015 Earnings PresentationMasco_Investors
 
Q1 Earnings Call Slide Deck_FINAL
Q1 Earnings Call Slide Deck_FINALQ1 Earnings Call Slide Deck_FINAL
Q1 Earnings Call Slide Deck_FINALacxiom2016ir
 

Similar to WMT Q4 Earnings Report (20)

Lby 2018 q2 earnings call final
Lby 2018 q2 earnings call  finalLby 2018 q2 earnings call  final
Lby 2018 q2 earnings call final
 
Third Quarter 2015 Results
Third Quarter 2015 ResultsThird Quarter 2015 Results
Third Quarter 2015 Results
 
Q1 FY20 Earnings Release
Q1 FY20 Earnings ReleaseQ1 FY20 Earnings Release
Q1 FY20 Earnings Release
 
Q4 2015 earnings conference call presentation 24 2_16_final
Q4 2015 earnings conference call presentation 24 2_16_finalQ4 2015 earnings conference call presentation 24 2_16_final
Q4 2015 earnings conference call presentation 24 2_16_final
 
Earnings-Presentation-FY24-Q2.pdf
Earnings-Presentation-FY24-Q2.pdfEarnings-Presentation-FY24-Q2.pdf
Earnings-Presentation-FY24-Q2.pdf
 
Lby 2018 q3 earnings call final4
Lby 2018 q3 earnings call final4Lby 2018 q3 earnings call final4
Lby 2018 q3 earnings call final4
 
pitney bowes 44B330C0-AAF8-412A-8D3C-CD5D3C3E3E07_Q408_Release
pitney bowes 44B330C0-AAF8-412A-8D3C-CD5D3C3E3E07_Q408_Releasepitney bowes 44B330C0-AAF8-412A-8D3C-CD5D3C3E3E07_Q408_Release
pitney bowes 44B330C0-AAF8-412A-8D3C-CD5D3C3E3E07_Q408_Release
 
pitney bowes 44B330C0-AAF8-412A-8D3C-CD5D3C3E3E07_Q408_Release
pitney bowes 44B330C0-AAF8-412A-8D3C-CD5D3C3E3E07_Q408_Releasepitney bowes 44B330C0-AAF8-412A-8D3C-CD5D3C3E3E07_Q408_Release
pitney bowes 44B330C0-AAF8-412A-8D3C-CD5D3C3E3E07_Q408_Release
 
pitney bowes 44B330C0-AAF8-412A-8D3C-CD5D3C3E3E07_Q408_Release
pitney bowes 44B330C0-AAF8-412A-8D3C-CD5D3C3E3E07_Q408_Releasepitney bowes 44B330C0-AAF8-412A-8D3C-CD5D3C3E3E07_Q408_Release
pitney bowes 44B330C0-AAF8-412A-8D3C-CD5D3C3E3E07_Q408_Release
 
pitney bowes 44B330C0-AAF8-412A-8D3C-CD5D3C3E3E07_Q408_Release
pitney bowes  44B330C0-AAF8-412A-8D3C-CD5D3C3E3E07_Q408_Releasepitney bowes  44B330C0-AAF8-412A-8D3C-CD5D3C3E3E07_Q408_Release
pitney bowes 44B330C0-AAF8-412A-8D3C-CD5D3C3E3E07_Q408_Release
 
MBA 503 Team Presentation
MBA 503 Team PresentationMBA 503 Team Presentation
MBA 503 Team Presentation
 
Lby 2018 q1 earnings call final
Lby 2018 q1 earnings call finalLby 2018 q1 earnings call final
Lby 2018 q1 earnings call final
 
20180509 sauc q1 2018 teleconference slides final
20180509 sauc q1 2018 teleconference slides final20180509 sauc q1 2018 teleconference slides final
20180509 sauc q1 2018 teleconference slides final
 
I-Bytes Retail & Consumer Goods Industry
I-Bytes Retail & Consumer Goods IndustryI-Bytes Retail & Consumer Goods Industry
I-Bytes Retail & Consumer Goods Industry
 
Mic slides q2_2016_final
Mic slides q2_2016_finalMic slides q2_2016_final
Mic slides q2_2016_final
 
Final q3 earnings call slide deck 2 6 1030am
Final q3 earnings call slide deck 2 6 1030amFinal q3 earnings call slide deck 2 6 1030am
Final q3 earnings call slide deck 2 6 1030am
 
Fy14 q4earningsreleasefinal wal mart
Fy14 q4earningsreleasefinal wal martFy14 q4earningsreleasefinal wal mart
Fy14 q4earningsreleasefinal wal mart
 
Genworth MI Canada Inc. Second Quarter 2015
Genworth MI Canada Inc. Second Quarter 2015Genworth MI Canada Inc. Second Quarter 2015
Genworth MI Canada Inc. Second Quarter 2015
 
Q1 2015 Earnings Presentation
Q1 2015 Earnings PresentationQ1 2015 Earnings Presentation
Q1 2015 Earnings Presentation
 
Q1 Earnings Call Slide Deck_FINAL
Q1 Earnings Call Slide Deck_FINALQ1 Earnings Call Slide Deck_FINAL
Q1 Earnings Call Slide Deck_FINAL
 

Recently uploaded

Organizational Structure Running A Successful Business
Organizational Structure Running A Successful BusinessOrganizational Structure Running A Successful Business
Organizational Structure Running A Successful BusinessSeta Wicaksana
 
The CMO Survey - Highlights and Insights Report - Spring 2024
The CMO Survey - Highlights and Insights Report - Spring 2024The CMO Survey - Highlights and Insights Report - Spring 2024
The CMO Survey - Highlights and Insights Report - Spring 2024christinemoorman
 
Digital Transformation in the PLM domain - distrib.pdf
Digital Transformation in the PLM domain - distrib.pdfDigital Transformation in the PLM domain - distrib.pdf
Digital Transformation in the PLM domain - distrib.pdfJos Voskuil
 
2024 Numerator Consumer Study of Cannabis Usage
2024 Numerator Consumer Study of Cannabis Usage2024 Numerator Consumer Study of Cannabis Usage
2024 Numerator Consumer Study of Cannabis UsageNeil Kimberley
 
NewBase 19 April 2024 Energy News issue - 1717 by Khaled Al Awadi.pdf
NewBase  19 April  2024  Energy News issue - 1717 by Khaled Al Awadi.pdfNewBase  19 April  2024  Energy News issue - 1717 by Khaled Al Awadi.pdf
NewBase 19 April 2024 Energy News issue - 1717 by Khaled Al Awadi.pdfKhaled Al Awadi
 
Annual General Meeting Presentation Slides
Annual General Meeting Presentation SlidesAnnual General Meeting Presentation Slides
Annual General Meeting Presentation SlidesKeppelCorporation
 
Sales & Marketing Alignment: How to Synergize for Success
Sales & Marketing Alignment: How to Synergize for SuccessSales & Marketing Alignment: How to Synergize for Success
Sales & Marketing Alignment: How to Synergize for SuccessAggregage
 
Call Girls In Sikandarpur Gurgaon ❤️8860477959_Russian 100% Genuine Escorts I...
Call Girls In Sikandarpur Gurgaon ❤️8860477959_Russian 100% Genuine Escorts I...Call Girls In Sikandarpur Gurgaon ❤️8860477959_Russian 100% Genuine Escorts I...
Call Girls In Sikandarpur Gurgaon ❤️8860477959_Russian 100% Genuine Escorts I...lizamodels9
 
Case study on tata clothing brand zudio in detail
Case study on tata clothing brand zudio in detailCase study on tata clothing brand zudio in detail
Case study on tata clothing brand zudio in detailAriel592675
 
Contemporary Economic Issues Facing the Filipino Entrepreneur (1).pptx
Contemporary Economic Issues Facing the Filipino Entrepreneur (1).pptxContemporary Economic Issues Facing the Filipino Entrepreneur (1).pptx
Contemporary Economic Issues Facing the Filipino Entrepreneur (1).pptxMarkAnthonyAurellano
 
8447779800, Low rate Call girls in Kotla Mubarakpur Delhi NCR
8447779800, Low rate Call girls in Kotla Mubarakpur Delhi NCR8447779800, Low rate Call girls in Kotla Mubarakpur Delhi NCR
8447779800, Low rate Call girls in Kotla Mubarakpur Delhi NCRashishs7044
 
FULL ENJOY Call girls in Paharganj Delhi | 8377087607
FULL ENJOY Call girls in Paharganj Delhi | 8377087607FULL ENJOY Call girls in Paharganj Delhi | 8377087607
FULL ENJOY Call girls in Paharganj Delhi | 8377087607dollysharma2066
 
Cash Payment 9602870969 Escort Service in Udaipur Call Girls
Cash Payment 9602870969 Escort Service in Udaipur Call GirlsCash Payment 9602870969 Escort Service in Udaipur Call Girls
Cash Payment 9602870969 Escort Service in Udaipur Call GirlsApsara Of India
 
Youth Involvement in an Innovative Coconut Value Chain by Mwalimu Menza
Youth Involvement in an Innovative Coconut Value Chain by Mwalimu MenzaYouth Involvement in an Innovative Coconut Value Chain by Mwalimu Menza
Youth Involvement in an Innovative Coconut Value Chain by Mwalimu Menzaictsugar
 
8447779800, Low rate Call girls in Uttam Nagar Delhi NCR
8447779800, Low rate Call girls in Uttam Nagar Delhi NCR8447779800, Low rate Call girls in Uttam Nagar Delhi NCR
8447779800, Low rate Call girls in Uttam Nagar Delhi NCRashishs7044
 
Kenya’s Coconut Value Chain by Gatsby Africa
Kenya’s Coconut Value Chain by Gatsby AfricaKenya’s Coconut Value Chain by Gatsby Africa
Kenya’s Coconut Value Chain by Gatsby Africaictsugar
 
Islamabad Escorts | Call 03274100048 | Escort Service in Islamabad
Islamabad Escorts | Call 03274100048 | Escort Service in IslamabadIslamabad Escorts | Call 03274100048 | Escort Service in Islamabad
Islamabad Escorts | Call 03274100048 | Escort Service in IslamabadAyesha Khan
 
VIP Kolkata Call Girl Howrah 👉 8250192130 Available With Room
VIP Kolkata Call Girl Howrah 👉 8250192130  Available With RoomVIP Kolkata Call Girl Howrah 👉 8250192130  Available With Room
VIP Kolkata Call Girl Howrah 👉 8250192130 Available With Roomdivyansh0kumar0
 
Lean: From Theory to Practice — One City’s (and Library’s) Lean Story… Abridged
Lean: From Theory to Practice — One City’s (and Library’s) Lean Story… AbridgedLean: From Theory to Practice — One City’s (and Library’s) Lean Story… Abridged
Lean: From Theory to Practice — One City’s (and Library’s) Lean Story… AbridgedKaiNexus
 
Vip Female Escorts Noida 9711199171 Greater Noida Escorts Service
Vip Female Escorts Noida 9711199171 Greater Noida Escorts ServiceVip Female Escorts Noida 9711199171 Greater Noida Escorts Service
Vip Female Escorts Noida 9711199171 Greater Noida Escorts Serviceankitnayak356677
 

Recently uploaded (20)

Organizational Structure Running A Successful Business
Organizational Structure Running A Successful BusinessOrganizational Structure Running A Successful Business
Organizational Structure Running A Successful Business
 
The CMO Survey - Highlights and Insights Report - Spring 2024
The CMO Survey - Highlights and Insights Report - Spring 2024The CMO Survey - Highlights and Insights Report - Spring 2024
The CMO Survey - Highlights and Insights Report - Spring 2024
 
Digital Transformation in the PLM domain - distrib.pdf
Digital Transformation in the PLM domain - distrib.pdfDigital Transformation in the PLM domain - distrib.pdf
Digital Transformation in the PLM domain - distrib.pdf
 
2024 Numerator Consumer Study of Cannabis Usage
2024 Numerator Consumer Study of Cannabis Usage2024 Numerator Consumer Study of Cannabis Usage
2024 Numerator Consumer Study of Cannabis Usage
 
NewBase 19 April 2024 Energy News issue - 1717 by Khaled Al Awadi.pdf
NewBase  19 April  2024  Energy News issue - 1717 by Khaled Al Awadi.pdfNewBase  19 April  2024  Energy News issue - 1717 by Khaled Al Awadi.pdf
NewBase 19 April 2024 Energy News issue - 1717 by Khaled Al Awadi.pdf
 
Annual General Meeting Presentation Slides
Annual General Meeting Presentation SlidesAnnual General Meeting Presentation Slides
Annual General Meeting Presentation Slides
 
Sales & Marketing Alignment: How to Synergize for Success
Sales & Marketing Alignment: How to Synergize for SuccessSales & Marketing Alignment: How to Synergize for Success
Sales & Marketing Alignment: How to Synergize for Success
 
Call Girls In Sikandarpur Gurgaon ❤️8860477959_Russian 100% Genuine Escorts I...
Call Girls In Sikandarpur Gurgaon ❤️8860477959_Russian 100% Genuine Escorts I...Call Girls In Sikandarpur Gurgaon ❤️8860477959_Russian 100% Genuine Escorts I...
Call Girls In Sikandarpur Gurgaon ❤️8860477959_Russian 100% Genuine Escorts I...
 
Case study on tata clothing brand zudio in detail
Case study on tata clothing brand zudio in detailCase study on tata clothing brand zudio in detail
Case study on tata clothing brand zudio in detail
 
Contemporary Economic Issues Facing the Filipino Entrepreneur (1).pptx
Contemporary Economic Issues Facing the Filipino Entrepreneur (1).pptxContemporary Economic Issues Facing the Filipino Entrepreneur (1).pptx
Contemporary Economic Issues Facing the Filipino Entrepreneur (1).pptx
 
8447779800, Low rate Call girls in Kotla Mubarakpur Delhi NCR
8447779800, Low rate Call girls in Kotla Mubarakpur Delhi NCR8447779800, Low rate Call girls in Kotla Mubarakpur Delhi NCR
8447779800, Low rate Call girls in Kotla Mubarakpur Delhi NCR
 
FULL ENJOY Call girls in Paharganj Delhi | 8377087607
FULL ENJOY Call girls in Paharganj Delhi | 8377087607FULL ENJOY Call girls in Paharganj Delhi | 8377087607
FULL ENJOY Call girls in Paharganj Delhi | 8377087607
 
Cash Payment 9602870969 Escort Service in Udaipur Call Girls
Cash Payment 9602870969 Escort Service in Udaipur Call GirlsCash Payment 9602870969 Escort Service in Udaipur Call Girls
Cash Payment 9602870969 Escort Service in Udaipur Call Girls
 
Youth Involvement in an Innovative Coconut Value Chain by Mwalimu Menza
Youth Involvement in an Innovative Coconut Value Chain by Mwalimu MenzaYouth Involvement in an Innovative Coconut Value Chain by Mwalimu Menza
Youth Involvement in an Innovative Coconut Value Chain by Mwalimu Menza
 
8447779800, Low rate Call girls in Uttam Nagar Delhi NCR
8447779800, Low rate Call girls in Uttam Nagar Delhi NCR8447779800, Low rate Call girls in Uttam Nagar Delhi NCR
8447779800, Low rate Call girls in Uttam Nagar Delhi NCR
 
Kenya’s Coconut Value Chain by Gatsby Africa
Kenya’s Coconut Value Chain by Gatsby AfricaKenya’s Coconut Value Chain by Gatsby Africa
Kenya’s Coconut Value Chain by Gatsby Africa
 
Islamabad Escorts | Call 03274100048 | Escort Service in Islamabad
Islamabad Escorts | Call 03274100048 | Escort Service in IslamabadIslamabad Escorts | Call 03274100048 | Escort Service in Islamabad
Islamabad Escorts | Call 03274100048 | Escort Service in Islamabad
 
VIP Kolkata Call Girl Howrah 👉 8250192130 Available With Room
VIP Kolkata Call Girl Howrah 👉 8250192130  Available With RoomVIP Kolkata Call Girl Howrah 👉 8250192130  Available With Room
VIP Kolkata Call Girl Howrah 👉 8250192130 Available With Room
 
Lean: From Theory to Practice — One City’s (and Library’s) Lean Story… Abridged
Lean: From Theory to Practice — One City’s (and Library’s) Lean Story… AbridgedLean: From Theory to Practice — One City’s (and Library’s) Lean Story… Abridged
Lean: From Theory to Practice — One City’s (and Library’s) Lean Story… Abridged
 
Vip Female Escorts Noida 9711199171 Greater Noida Escorts Service
Vip Female Escorts Noida 9711199171 Greater Noida Escorts ServiceVip Female Escorts Noida 9711199171 Greater Noida Escorts Service
Vip Female Escorts Noida 9711199171 Greater Noida Escorts Service
 

WMT Q4 Earnings Report

  • 1. NYSE: WMT February 18, 2020 stock.walmart.com Walmart U.S. Q4 comp sales1 grew 1.9% and Walmart U.S. eCommerce sales grew 35%, Q4 FY20 GAAP EPS of $1.45; Adjusted EPS2 of $1.38, Disruption in Chile and a legal matter lowered GAAP and Adjusted EPS by about $0.05, Fiscal year 2020 GAAP EPS of $5.19; Adjusted EPS2 of $4.93, FY21 guidance includes net sales growth of about 3%; U.S. comp sales growth of at least 2.5%; U.S. eCommerce net sales growth of about 30%; EPS of $5.00 to $5.15 Fourth-quarter highlights Total revenue was $141.7 billion, an increase of $2.9 billion, or 2.1%. “We thank our associates for another good year. In Q4, we saw strong performance in the U.S. with eCommerce and Sam’s Club plus strengthinMexico,IndiaandChina.Westarted and finished the quarter with momentum, while sales leading up to Christmas in our U.S. stores were a little softer than expected. The new year has started off well, and we look forward to another strong year. We remain focused on providing our customers with the best omnichannel experience from any retailer. ” Doug McMillon President and CEO, Walmart Walmart U.S. comp sales1 increased on a two-year stacked basis by 6.0% with continued strength in food and consumables. Walmart U.S. eCommerce had strong growth in grocery pickup and delivery, and walmart.com had its highest quarterly growth rate of the year. Sam’s Club comp sales1 increased 0.8%, and eCommerce sales grew 33%. Reduced tobacco sales negatively affected comp sales by approximately 300 basis points. Net sales at Walmart International were $33.0 billion, an increase of 2.3%. Disruption in Chile negatively affected operating income by approximately $110 million. Adjusted EPS2 excludes the effects of four items: • An unrealized gain of $0.26, net of tax, on the company’s equity investment in JD.com • A charge of $0.15, net of tax, related to business restructurings • A tax benefit of $0.11 related to a reduction in corporate income tax rates in India • A charge of $0.15 related to certain income tax matters Fiscal 2020 highlights Total revenue was $524.0 billion, an increase of $9.6 billion, or 1.9%. Excluding currency2 , total revenue was $528.1 billion, an increase of $13.7 billion, or 2.7%. Walmart U.S. comp sales1 increased 2.8% and 6.4% on a two-year stacked basis. Walmart U.S. eCommerce sales grew 37%. Net Promoter Score and the Customer Value Index improved. Sam’s Club comp sales1 increased 0.7%. Reduced tobacco sales negatively affected comp sales by approximately 310 basis points. Membership trends were strong. International net sales increased 2.8% in constant currency2 with strength in Mexico, China and India. The company generated $25.3 billion in operating cash flow and returned $11.8 billion to shareholders through dividends and share repurchases. The company will host its meeting for the investment community today at 8 a.m. EST. The event will be webcast and can be viewed at the following link: https://corporate.walmart.com/newsroom/events/2020-investment- community-meeting 1 The retail sales calendar for the year ended January 31, 2020 included 53 weeks. As such, fiscal year 2020 comparable store sales are for the 14-week period and 53-week period ended January 31, 2020, and excludes fuel. For comparability, prior year comparable store sales were revised to reflect the 14-week and 53-week periods ended February 1, 2019 instead of the previously reported 13-week and 52 week periods ended January 25, 2019. 2 See additional information at the end of this release regarding non-GAAP financial measures.
  • 2. 2 NYSE: WMT February 18, 2020 stock.walmart.com Brett Biggs, Chief Financial Officer of Walmart Inc., said: “The fourth quarter started and ended strong with solid sales growth through Cyber Monday and in January. In the few weeks before Christmas, we experienced some softness in a few general merchandise categories in our U.S. stores. However, Walmart U.S. grocery sales and eCommerce sales were strong throughout the quarter. Sam’s Club performed well, including solid results in eCommerce. We experienced softness in some key international markets, as well as in Chile, where unrest led to disruption in the majority of our stores. Walmex, China and Flipkart all had a solid quarter. The holiday season delivered positive transaction growth and underlying expense leverage was strong for the quarter. However, it wasn’t as good as expected due to lower sales volumes and some pressure related to associate scheduling. We understand the factors that affected our results and are developing plans to address them. We remain confident in our business strategy and our ability to deliver value and convenience for our customers through an integrated omnichannel offering across the globe.” Key results (Amounts in billions, except as noted. Dollar and percentage changes may not recalculate due to rounding.) Q4 FY20 Q4 FY19 Change FY20 FY19 Change Revenue $141.7 $138.8 $2.9 2.1% $524.0 $514.4 $9.6 1.9% Revenue (constant currency)1 $141.7 $138.8 $2.9 2.1% $528.1 $514.4 $13.7 2.7% Operating income $5.3 $6.1 -$0.7 -12.3% $20.6 $22.0 -$1.4 -6.3% Operating income (constant currency)1 $5.3 $6.1 -$0.8 -12.7% $20.7 $22.0 -$1.3 -5.8% Adjusted operating income (constant currency)1 $5.8 $6.1 -$0.3 -3.7% $21.5 $22.0 -$0.5 -1.9% (Amounts in billions, except as noted. Dollar and percentage changes may not recalculate due to rounding.) Free Cash Flow1 YTD FY20 $ Change Returns to Shareholders YTD FY20 % Change Operating cash flow $25.3 -$2.5 Dividends $6.0 -0.9% Capital expenditures $10.7 $0.4 Share repurchases2 $5.7 -22.8% Free cash flow1 $14.6 -$2.9 Total $11.8 -12.9% 1 See additional information at the end of this release regarding non-GAAP financial measures. 2 $5.7 billion remaining of $20 billion authorization approved in October 2017. The company repurchased approximately 54 million shares in fiscal 2020.
  • 3. 3 NYSE: WMT February 18, 2020 stock.walmart.com Fiscal 2021 full year guidance The following guidance reflects the company’s expectations for fiscal year 2021. Assumptions in the guidance include that economic conditions, currency rates and the tax and regulatory landscape remain generally consistent. The company continues to monitor the events in Chile and the Coronavirus outbreak and has not included any potential financial effects in its assumptions. Additionally, the guidance assumes no further change in fair value of the Company’s equity investment in JD.com. Metric FY21 Guidance Consolidated net sales growth Around 3% in constant currency Comp sales growth • Walmart U.S.: at least +2.5%, excluding fuel • Sam’s Club: minus 50 basis points, excluding fuel, and at least +3.0%, excluding fuel and tobacco Walmart U.S. eCommerce net sales growth Around 30% Walmart International net sales growth Around 4% in constant currency Consolidated expense leverage1 Around 20 basis points Consolidated operating income2 Similar to EPS growth with Walmart U.S. operating income growth near the upper-end of the growth rate range Effective tax rate 25% to 26% EPS3 $5.00 to $5.15, up 1.5% to 4.5% compared with FY20 adjusted EPS Capital expenditures Around $11 billion with a focus on store remodels, customer initiatives, eCommerce, technology and supply chain 1 Expense leverage to be around 40 basis points as compared with fiscal 2020 reported results. 2 The fiscal 2021 Walmart U.S. and consolidated operating income growth is expected to be higher when compared to fiscal 2020 reported operating income. 3 Fiscal 2021 EPS expected to decline about 1% to 4% as compared with fiscal 2020 GAAP EPS primarily as a result of the fair value change in the Company's equity investment in JD.com recorded in fiscal 2020.
  • 4. 4 NYSE: WMT February 18, 2020 stock.walmart.com Segment results (Amounts in billions, except as noted. Dollar and percentage changes may not recalculate due to rounding.) U.S. Q4 FY20 Q4 FY19 Change FY20 FY19 Change Net sales $92.3 $90.5 $1.8 1.9% $341.0 $331.7 $9.3 2.8% Comp sales (ex. fuel)1,2 1.9% 4.1% NP NP 2.8% 3.6% NP NP Transactions2 1.0% 1.5% NP NP NP NP NP NP Ticket2 0.9% 2.6% NP NP NP NP NP NP eCommerce ~210 bps ~180 bps NP NP NP NP NP NP Operating income $4.4 $5.0 -$0.6 -12.7% $17.4 $17.4 $— —% Adjusted operating income3 $4.9 $5.0 -$0.2 -3.8% $17.8 $17.4 $0.4 2.6% Q4 FY20 Q4 FY19 Change FY20 FY19 Change Net sales $33.0 $32.3 $0.7 2.3% $120.1 $120.8 $(0.7) -0.6% Net sales (constant currency)3 $33.0 $32.3 $0.7 2.2% $124.3 $120.8 $3.4 2.8% Operating income $1.1 $1.2 -$0.1 -5.6% $3.4 $4.9 $(1.5) -31.0% Operating income (constant currency)3 $1.1 $1.2 -$0.1 -7.7% $3.5 $4.9 $(1.4) -28.5% Adjusted operating income (constant currency)3 $1.2 $1.2 $0.0 0.4% $3.9 $4.9 $(1.0) -20.5% Q4 FY20 Q4 FY19 Change FY20 FY19 Change Net sales $15.3 $14.9 $0.4 2.6% $58.8 $57.8 $1.0 1.6% Comp sales (ex. fuel)2 0.8% 3.4% NP NP 0.7% 3.8% NP NP Transactions 4.3% 6.3% NP NP NP NP NP NP Ticket -3.5% -2.9% NP NP NP NP NP NP eCommerce ~200 bps ~110 bps NP NP NP NP NP NP Operating income4 $0.4 $0.4 $0.0 -7.2% $1.6 $1.5 $0.1 8.0% 1 Beginning with the first quarter of FY20, we updated our definition of traffic as a component of comparable sales to be all sales transactions in our stores as well as for eCommerce. Traffic is now called transactions. For comparability, we revised this metric for FY19 and have provided a quarterly summary on our website at http://www.stock.walmart.com. In connection with the updated definition, we also revised our methodology for calculating customer and member weekly visits. As of January 31, 2019, our revised count was over 260 million weekly visits as compared to over 275 million weekly visits previously disclosed. 2 The retail sales calendar for the year ended January 31, 2020 included 53 weeks. As such, fiscal year 2020 comparable store sales are for the 14-week period and 53-week period ended January 31, 2020, and excludes fuel. For comparability, prior year comparable store sales were revised to reflect the 14-week and 53-week periods ended February 1, 2019 instead of the previously reported 13-week and 52 week periods ended January 25, 2019. 3 See additional information at the end of this release regarding non-GAAP financial measures. 4 There were no adjustments to operating income for Sam’s Club. NP - Not provided
  • 5. 5 NYSE: WMT February 18, 2020 stock.walmart.com Additional highlights for fiscal year 2020 • Appointed John Furner as new President and CEO, Walmart. U.S. • Appointed Kath McLay as new President and CEO, Sam’s Club • Appointed Suresh Kumar as new Chief Technology Officer and Chief Development Officer • Announced the appointment of Donna Morris as new Chief People Officer • Launched free NextDay delivery from Walmart.com • Walmart U.S. ended the year with nearly 3,200 grocery pickup locations and more than 1,600 delivery locations • Launched Delivery Unlimited, a grocery delivery membership option • Launched Walmart InHome Delivery to help customers save time by having their fresh groceries and everyday essentials delivered directly into their homes • Introduced Walmart Voice Order to make basket building for online grocery orders even easier • Announced new pilot with autonomous vehicle company, Nuro, for grocery delivery • Announced participation in the USDA’s SNAP online purchasing pilot • Announced the creation of a new Angus beef supply chain to service 500 U.S. stores • Announced a case-ready facility as part of the company’s new Angus beef supply chain • Relaunched fashion boutique ‘Scoop’ as exclusive brand on Walmart.com • Launched exclusive line of denim on Walmart.com with Sofia Vergara • Launched exclusive MoDRN brand in the Home category • Launched exclusive Hello Bello brand in the Baby category with Kristen Bell and Dax Shepard • Launched exclusive Flower brand in the Home category on Walmart.com with Drew Barrymore • Launched new personalized baby registry on Walmart.com • Introduced first online pet pharmacy, Walmartpetrx.com • Launched Evolution_18, a health & wellness line from Bobbi Brown, in stores and online • Announced partnership with KIDBOX to deliver personalized kids fashion through Walmart.com • Announced new wireless experience online and in stores making it easier for customers to upgrade their mobile device • Launched shoppable recipes with Buzzfeed’s Tasty app, a first-of-its-kind feature where customers add recipe ingredients directly to online grocery cart for pickup or delivery • Launched new intelligent Retail Lab in a live shopping environment to help unlock the possibilities of Artificial Intelligence • Acquired natural language processing startup, Aspectiva • Acquired assets of Polymorph Labs to expand in-house advertising technology • Launched new Sam’s Garage app nationwide at Sam’s Club • Launched same-day pickup nationwide at Sam’s Club • Launched Sam’s Club Care Accelerator with Humana, a pilot program designed to provide members with quality care on routine preventative and primary care services • Opened Walmart Health Clinics in Dallas, GA and Calhoun, GA • Launched Capital One Walmart Rewards credit card program offering 5% cash back at Walmart.com • Announced an agreement with Green Dot to jointly establish a new fintech accelerator, TailFin Labs, LLC, to develop tech-enabled solutions that seamlessly integrate omnichannel shopping and financial services • Announced partnership with Affirm to allow customers to make purchases and pay over time at Walmart stores and online • Announced the launch of PhonePe as a payment option at Walmart’s “B2B Cash & Carry” stores in India • Reported record sales at Flipkart’s ‘The Big Billion Days’ sales event • Announced the creation of the Walmart Vriddhi Supplier Development Program to train 50,000 Indian small businesses to “Make in India” Launched same-day pickup at all Sam’s Club locations in Mexico • Launched new ordering service through WhatsApp for Superama customers in Mexico • Opened two new eCommerce fulfillment centers in Mexico • Opened first distribution center in Walmart International with omnichannel management systems in Chile • Launched grocery pickup and delivery in Montreal through a partnership with Foodora and expanded partnership with Instacart to communities across Canada • Opened next generation Sam’s Club in Shanghai
  • 6. 6 NYSE: WMT February 18, 2020 stock.walmart.com • Launched new Walmart Daojia delivery app in China • Announced plans to invest $1.2 billion to upgrade logistics network in China • Launched blockchain traceability platform for Walmart China • Announced new collaboration with other major companies as part of the FDA’s program to evaluate the use of blockchain to protect pharmaceutical product integrity • Received The Carbon Disclosure Projects prestigious ‘A List’ rating for climate change • Walmart and U.S. Solar announce agreement for 36 community solar gardens • Electrify America and Walmart announce completion of more than 120 car charging stations at Walmart stores nationwide • Walmart Transportation received 2019 SMARTWAY Excellence Award from EPA for environmental performance and leadership • Announced that all coffee sourced for Walmart U.S. private brands is certified sustainable through third-party groups Fair Trade, Rainforest Alliance Certified or UTZ • Launched new reusable shopping bag campaign in U.S. stores • Announced new plastic packaging waste reduction commitments • Introduced increased rewards and protected PTO for U.S. associates • Added education benefit programs with seven bachelor’s degrees and two career diplomas in health-related fields through Live Better U, Walmart’s education benefits program • Added 14 tech degrees and certifications to Live Better U college offering • Expanded debt-free college to high schoolers and created graduation bonuses • Opened first supply chain training academy in the U.S. • Launched Fresh Learning Lab at Sam’s Club, a hands-on training lab for associates to enhance their skills
  • 7. 7 NYSE: WMT February 18, 2020 stock.walmart.com About Walmart Walmart Inc. (NYSE: WMT) helps people around the world save money and live better - anytime and anywhere - in retail stores, online, and through their mobile devices. Each week, over 265 million customers and members visit approximately 11,500 stores under 56 banners in 27 countries and eCommerce websites. With fiscal year 2020 revenue of $524 billion, Walmart employs over 2.2 million associates worldwide. Walmart continues to be a leader in sustainability, corporate philanthropy and employment opportunity. Additional information about Walmart can be found by visiting http://corporate.walmart.com, on Facebook at http://facebook.com/walmart and on Twitter at http://twitter.com/walmart. Investor Relations contact Dan Binder, CFA (479) 258-7172 Media Relations contact Randy Hargrove (800) 331-0085 Forward-Looking Statements This release contains statements as to Walmart management's guidance regarding earnings per share, adjusted earnings per share, consolidated net sales growth, Walmart U.S. eCommerce net sales growth, Walmart International net sales growth, consolidated operating income, capital expenditures, expense leverage, Walmart's effective tax rate for the fiscal year ending January 31, 2021, and comparable sales (excluding fuel) for Walmart U.S. and Sam's Club for the 52 weeks ending January 31, 2021 Walmart believes such statements are "forward-looking statements" as defined in, and are intended to enjoy the protection of the safe harbor for forward- looking statements within the meaning of Section 21E of the Securities Exchange Act of 1934, as amended. Assumptions on which such forward-looking statements are based are also forward-looking statements. Our actual results may differ materially from those expressed in or implied by any of these forward-looking statements as a result of changes in circumstances, assumptions not being realized or other risks, uncertainties and factors including: economic, capital markets and business conditions; trends and events around the world and in the markets in which we operate; currency exchange rate fluctuations, changes in market interest rates and market levels of wages; changes in the size of various markets, including eCommerce markets; unemployment levels; inflation or deflation, generally and in particular product categories; consumer confidence, disposable income, credit availability, spending levels, shopping patterns, debt levels and demand for certain merchandise; the effectiveness of the implementation and operation of our strategies, plans, programs and initiatives; unexpected changes in our objectives and plans; the impact of acquisitions, investments, divestitures, store or club closures, and other strategic decisions; our ability to successfully integrate acquired businesses, including within the eCommerce space; changes in the trading prices of certain equity investments we hold; initiatives of competitors, competitors' entry into and expansion in our markets, and competitive pressures; customer traffic and average ticket in our stores and clubs and on our eCommerce websites; the mix of merchandise we sell, the cost of goods we sell and the shrinkage we experience; trends in consumer shopping habits around the world and in the markets in which we operate; our gross profit margins; the financial performance of Walmart and each of its segments, including the amounts of our cash flow during various periods; changes in the credit ratings assigned to our commercial paper and debt securities by credit rating agencies; the amount of our net sales and operating expenses denominated in the U.S. dollar and various foreign currencies; transportation, energy and utility costs; commodity prices and the price of gasoline and diesel fuel; supply chain disruptions and disruptions in seasonal buying patterns; the availability of goods from suppliers and the cost of goods acquired from suppliers; consumer acceptance of and response to our stores, clubs, eCommerce platforms, programs, merchandise offerings and delivery methods; cyber security events affecting us and related costs and impact to the business; developments in, outcomes of, and costs incurred in legal or regulatory proceedings to which we are a party or are subject, and the liabilities, obligations and expenses, if any, that we may incur in connection therewith; casualty and accident-related costs and insurance costs; the turnover in our workforce and labor costs, including healthcare and other benefit costs; consumer enrollment in health and drug insurance programs and such programs' reimbursement rates and drug formularies; our effective tax rate and the factors affecting our effective tax rate, including assessments of certain tax contingencies, valuation allowances, changes in law, administrative audit outcomes, impact of discrete items and the mix of earnings between the U.S. and Walmart's international operations; changes in existing tax, labor and other laws and regulations and changes in tax rates including the enactment of laws and the adoption and interpretation of administrative rules and regulations; the imposition of new taxes on imports, new tariffs and changes in existing tariff rates; the imposition of new trade restrictions and changes in existing trade restrictions; adoption or creation of new, and modification of existing, governmental policies, programs, initiatives and actions in the markets in which Walmart operates and elsewhere and actions with respect to such policies, programs and initiatives; changes in accounting estimates or judgments; the level of public assistance payments; natural disasters, changes in climate, geopolitical events and catastrophic events; and changes in generally accepted accounting principles in the United States. Our most recent annual report on Form 10-K and subsequent quarterly reports on Form 10-Q filed with the SEC discuss other risks and factors that could cause actual results to differ materially from those expressed or implied by any forward-looking statement in the presentations. We urge you to consider all of the risks, uncertainties and factors identified above or discussed in such reports carefully in evaluating the forward-looking statements in this release. Walmart cannot assure you that the results reflected in or implied by any forward-looking statement will be realized or, even if substantially realized, that those results will have the forecasted or expected consequences and effects for or on our operations or financial performance. The forward-looking statements made in the presentation are as of the date of this meeting. Walmart undertakes no obligation to update these forward-looking statements to reflect subsequent events or circumstances.
  • 8. 8 Walmart Inc. Condensed Consolidated Statements of Income (Unaudited) Three Months Ended Fiscal Years Ended January 31, January 31, (Amounts in millions, except per share data) 2020 2019 Percent Change 2020 2019 Percent Change Revenues: Net sales $140,608 $137,743 2.1 % $519,926 $510,329 1.9 % Membership and other income 1,063 1,050 1.2 % 4,038 4,076 (0.9)% Total revenues 141,671 138,793 2.1 % 523,964 514,405 1.9 % Costs and expenses: Cost of sales 107,748 104,907 2.7 % 394,605 385,301 2.4 % Operating, selling, general and administrative expenses 28,601 27,819 2.8 % 108,791 107,147 1.5 % Operating income 5,322 6,067 (12.3)% 20,568 21,957 (6.3)% Interest: Debt 569 577 (1.4)% 2,262 1,975 14.5 % Finance, capital lease and financing obligations 83 92 (9.8)% 337 371 (9.2)% Interest income (41) (64) (35.9)% (189) (217) (12.9)% Interest, net 611 605 1.0 % 2,410 2,129 13.2 % Other (gains) and losses (962) (202) 376.2 % (1,958) 8,368 (123.4)% Income before income taxes 5,673 5,664 0.2 % 20,116 11,460 75.5 % Provision for income taxes 1,379 1,851 (25.5)% 4,915 4,281 14.8 % Consolidated net income 4,294 3,813 12.6 % 15,201 7,179 111.7 % Consolidated net income attributable to noncontrolling interest (153) (126) 21.4 % (320) (509) (37.1)% Consolidated net income attributable to Walmart $ 4,141 $ 3,687 12.3 % $ 14,881 $ 6,670 123.1 % Net income per common share: Basic net income per common share attributable to Walmart $ 1.46 $ 1.27 15.0 % $ 5.22 $ 2.28 128.9 % Diluted net income per common share attributable to Walmart $ 1.45 $ 1.27 14.2 % $ 5.19 $ 2.26 129.6 % Weighted-average common shares outstanding: Basic 2,836 2,896 2,850 2,929 Diluted 2,855 2,914 2,868 2,945 Dividends declared per common share $ — $ — $ 2.12 $ 2.08
  • 9. 9 Walmart Inc. Condensed Consolidated Balance Sheets (Unaudited) January 31, January 31, (Amounts in millions) 2020 2019 ASSETS Current assets: Cash and cash equivalents $ 9,465 $ 7,722 Receivables, net 6,284 6,283 Inventories 44,435 44,269 Prepaid expenses and other 1,622 3,623 Total current assets 61,806 61,897 Property and equipment, net 105,208 104,317 Operating lease right-of-use assets 17,424 — Finance lease right-of-use assets, net 4,417 — Property under capital lease and financing obligations, net — 7,078 Goodwill 31,073 31,181 Other long-term assets 16,567 14,822 Total assets $ 236,495 $ 219,295 LIABILITIES AND EQUITY Current liabilities: Short-term borrowings $ 575 $ 5,225 Accounts payable 46,973 47,060 Accrued liabilities 22,296 22,159 Accrued income taxes 280 428 Long-term debt due within one year 5,362 1,876 Operating lease obligations due within one year 1,793 — Finance lease obligations due within one year 511 — Capital leases and financing obligations due within one year — 729 Total current liabilities 77,790 77,477 Long-term debt 43,714 43,520 Long-term operating lease obligations 16,171 — Long-term finance lease obligations 4,307 — Long-term capital lease and financing obligations — 6,683 Deferred income taxes and other 12,961 11,981 Commitments and contingencies Equity: Common stock 284 288 Capital in excess of par value 3,247 2,965 Retained earnings 83,943 80,785 Accumulated other comprehensive loss (12,805) (11,542) Total Walmart shareholders’ equity 74,669 72,496 Noncontrolling interest 6,883 7,138 Total equity 81,552 79,634 Total liabilities and equity $ 236,495 $ 219,295 Note: The Company adopted ASU 2016-02, Leases (Topic 842), and related amendments as of February 1, 2019 under the modified retrospective approach and, therefore, has not revised comparative periods.
  • 10. 10 Walmart Inc. Condensed Consolidated Statements of Cash Flows (Unaudited) Fiscal Years Ended January 31, (Amounts in millions) 2020 2019 Cash flows from operating activities: Consolidated net income $ 15,201 $ 7,179 Adjustments to reconcile consolidated net income to net cash provided by operating activities: Depreciation and amortization 10,987 10,678 Unrealized (gains) and losses (1,886) 3,516 (Gains) and losses for disposal of business operations 15 4,850 Asda Pension Contribution (1,036) — Deferred income taxes 320 (499) Other operating activities 1,981 1,734 Changes in certain assets and liabilities, net of effects of acquisitions: Receivables, net 154 (368) Inventories (300) (1,311) Accounts payable (274) 1,831 Accrued liabilities 186 183 Accrued income taxes (93) (40) Net cash provided by operating activities 25,255 27,753 Cash flows from investing activities: Payments for property and equipment (10,705) (10,344) Proceeds from the disposal of property and equipment 321 519 Proceeds from disposal of certain operations 833 876 Payments for business acquisitions, net of cash acquired (56) (14,656) Other investing activities 479 (431) Net cash used in investing activities (9,128) (24,036) Cash flows from financing activities: Net change in short-term borrowings (4,656) (53) Proceeds from issuance of long-term debt 5,492 15,872 Repayments of long-term debt (1,907) (3,784) Dividends paid (6,048) (6,102) Purchase of Company stock (5,717) (7,410) Dividends paid to noncontrolling interest (555) (431) Other financing activities (908) (629) Net cash used in financing activities (14,299) (2,537) Effect of exchange rates on cash, cash equivalents and restricted cash (69) (438) Net increase in cash, cash equivalents and restricted cash 1,759 742 Cash, cash equivalents and restricted cash at beginning of year 7,756 7,014 Cash, cash equivalents and restricted cash at end of year $ 9,515 $ 7,756
  • 11. 11 Walmart Inc. Supplemental Financial Information (Unaudited) Net sales and operating income Net Sales Operating Income Three Months Ended Three Months Ended January 31, January 31, (dollars in millions) 2020 2019 Percent Change 2020 2019 Percent Change Walmart U.S. $ 92,271 $ 90,520 1.9% $ 4,403 $ 5,043 -12.7% Walmart International 33,049 32,317 2.3% 1,105 1,170 -5.6% Sam’s Club 15,288 14,906 2.6% 384 414 -7.2% Corporate and support — — N/A (570) (560) 1.8% Consolidated $ 140,608 $ 137,743 2.1% $ 5,322 $ 6,067 -12.3% Net Sales Operating Income Fiscal Years Ended Fiscal Years Ended January 31, January 31, (dollars in millions) 2020 2019 Percent Change 2020 2019 Percent Change Walmart U.S. $ 341,004 $ 331,666 2.8% $ 17,380 $ 17,386 —% Walmart International 120,130 120,824 -0.6% 3,370 4,883 -31.0% Sam’s Club 58,792 57,839 1.6% 1,642 1,520 8.0% Corporate and support — — N/A (1,824) (1,832) -0.4% Consolidated $ 519,926 $ 510,329 1.9% $ 20,568 $ 21,957 -6.3% U.S. comparable sales results1 With Fuel Without Fuel Fuel Impact 14 Weeks Ended 14 Weeks Ended 14 Weeks Ended 1/31/2020 2/1/2019 1/31/2020 2/1/2019 1/31/2020 2/1/2019 Walmart U.S. 2.0% 4.2% 1.9% 4.1% 0.1% 0.1% Sam’s Club 2.2% 3.7% 0.8% 3.4% 1.4% 0.3% Total U.S. 2.0% 4.1% 1.8% 4.0% 0.2% 0.1% With Fuel Without Fuel Fuel Impact 53 Weeks Ended 53 Weeks Ended 53 Weeks Ended 1/31/2020 2/1/2019 1/31/2020 2/1/2019 1/31/2020 2/1/2019 Walmart U.S. 2.8% 3.7% 2.8% 3.6% 0.0% 0.1% Sam’s Club 1.5% 5.4% 0.7% 3.8% 0.8% 1.6% Total U.S. 2.6% 3.9% 2.5% 3.6% 0.1% 0.3% Comparable sales is a metric that indicates the performance of our existing stores and clubs and it is important to review in conjunction with the Company’s financial results reported in accordance with GAAP. Comparable sales excluding fuel is also an important, separate metric that indicates the performance of our existing stores and clubs without considering fuel, which is volatile and unpredictable. Other companies in our industry may calculate comparable sales differently, limiting the comparability of the metric. 1 The retail sales calendar for the year ended January 31, 2020 included 53 weeks. As such, fiscal year 2020 comparable store sales are for the 14-week period and 53-week period ended January 31, 2020, and excludes fuel. For comparability, prior year comparable store sales were revised to reflect the 14-week and 53-week periods ended February 1, 2019 instead of the previously reported 13-week and 52 week periods ended January 25, 2019.
  • 12. 12 Walmart Inc. Reconciliations of and Other Information Regarding Non-GAAP Financial Measures (Unaudited) The following information provides reconciliations of certain non-GAAP financial measures presented in the press release to which this reconciliation is attached to the most directly comparable financial measures calculated and presented in accordance with generally accepted accounting principles (GAAP). The company has provided the non-GAAP financial information presented in the press release, which is not calculated or presented in accordance with GAAP, as information supplemental and in addition to the financial measures presented in the press release that are calculated and presented in accordance with GAAP. Such non-GAAP financial measures should not be considered superior to, as a substitute for or alternative to, and should be considered in conjunction with, the GAAP financial measures presented in the press release. The non-GAAP financial measures in the press release may differ from similar measures used by other companies. Constant Currency In discussing our operating results, the term currency exchange rates refers to the currency exchange rates we use to convert the operating results for countries where the functional currency is not the U.S. dollar into U.S. dollars or for countries experiencing hyperinflation. We calculate the effect of changes in currency exchange rates as the difference between current period activity translated using the current period’s currency exchange rates and the comparable prior year period’s currency exchange rates. Additionally, no currency exchange rate fluctuations are calculated for non-USD acquisitions until owned for 12 months. Throughout our discussion, we refer to the results of this calculation as the impact of currency exchange rate fluctuations. When we refer to constant currency operating results, this means operating results without the impact of the currency exchange rate fluctuations. The disclosure of constant currency amounts or results permits investors to better understand Walmart’s underlying performance without the effects of currency exchange rate fluctuations. The table below reflects the calculation of constant currency for total revenues, net sales and operating income for the three months and fiscal year ended January 31, 2020. Three Months Ended January 31, Fiscal Year Ended January 31, Walmart International Consolidated Walmart International Consolidated (Dollars in millions) 2020 Percent Change1 2020 Percent Change1 2020 Percent Change1 2020 Percent Change1 Total revenues: As reported $ 33,426 2.4% $141,671 2.1% $121,432 -0.6% $523,964 1.9% Currency exchange rate fluctuations -13 N/A -13 N/A 4,169 N/A 4,169 N/A Constant currency total revenues $ 33,413 2.3% $141,658 2.1% $125,601 2.8% $528,133 2.7% Net sales: As reported $ 33,049 2.3% $140,608 2.1% $120,130 -0.6% $519,926 1.9% Currency exchange rate fluctuations -12 N/A -12 N/A 4,137 N/A 4,137 N/A Constant currency net sales $ 33,037 2.2% $140,596 2.1% $124,267 2.8% $524,063 2.7% Operating income: As reported $ 1,105 -5.6% $ 5,322 -12.3% $ 3,370 -31.0% $ 20,568 -6.3% Currency exchange rate fluctuations -25 N/A -25 N/A 120 N/A 120 N/A Constant currency operating income $ 1,080 -7.7% $ 5,297 -12.7% $ 3,490 -28.5% $ 20,688 -5.8% 1 Change versus prior year comparable period.
  • 13. 13 Adjusted operating income Adjusted operating income is considered a non-GAAP financial measure under the SEC’s rules because it excludes certain charges included in operating income calculated in accordance with GAAP. Management believes that adjusted operating income is a meaningful measure to share with investors because it best allows comparison of the performance with that of the comparable period. In addition, adjusted operating income affords investors a view of what management considers Walmart’s core earnings performance and the ability to make a more informed assessment of such core earnings performance as compared with that of the prior year. When we refer to adjusted operating income in constant currency this means adjusted operating results without the impact of the currency exchange rate fluctuations. The disclosure of constant currency amounts or results permits investors to better understand Walmart’s underlying performance without the effects of currency exchange rate fluctuations. The tables below reflects the calculation of adjusted operating income and adjusted operating income in constant currency for the three months and fiscal year ended January 31, 2020. Three months ended January 31, 2020 Percent Change1 2020 Percent Change1 2020 Percent Change1 (Dollars in millions) Walmart US Walmart International Consolidated Operating income: Operating income, as reported $ 4,403 (12.7)% $ 1,105 (5.6)% $ 5,322 (12.3)% Business restructuring charges2 450 96 546 Adjusted operating income 4,853 (3.8)% 1,201 2.6 % 5,868 (3.3)% Currency exchange rate fluctuations N/A N/A (26) N/A (26) N/A Adjusted operating income, constant currency $ 4,853 (3.8)% $ 1,175 0.4 % $ 5,842 (3.7)% Fiscal year ended January 31, 2020 Percent Change1 2020 Percent Change1 2020 Percent Change1 (Dollars in millions) Walmart US Walmart International Consolidated Operating income: Operating income, as reported $ 17,380 0.0% $ 3,370 (31.0)% $ 20,568 (6.3)% Business restructuring charges2 450 N/A 389 N/A 839 N/A Adjusted operating income 17,830 2.6% 3,759 (23.0)% 21,407 (2.5)% Currency exchange rate fluctuations N/A N/A 124 N/A 124 N/A Adjusted operating income, constant currency $ 17,830 2.6% $ 3,883 (20.5)% $ 21,531 (1.9)% 1 Change versus prior year comparable period. 2 Business restructuring charges primarily consists of (1) $399 million of non-cash impairment charges for certain trade names, acquired developed technology and property and equipment due to strategic business decisions that resulted in the write down of certain eCommerce assets in Walmart U.S. and $51 million in related severance costs; and (2) $96 million of non-cash impairment charges related to strategic business decisions that resulted in the write down of certain assets in Walmart International. Additionally, for the fiscal year ended January 31, 2020, business restructuring charges includes $293 million in non-cash impairment charges in Q3 for the Jabong.com trade name.
  • 14. 14 Free Cash Flow We define free cash flow as net cash provided by operating activities in a period minus payments for property and equipment made in that period. We had net cash provided by operating activities of $25.3 billion for the fiscal year ended January 31, 2020, which decreased when compared to $27.8 billion for the fiscal year ended January 31, 2019 primarily due to the contribution to our Asda pension plan in anticipation of its future settlement, the inclusion of a full year of Flipkart operations, and the timing of vendor payments. We generated free cash flow of $14.6 billion for the fiscal year ended January 31, 2020, which decreased when compared to $17.4 billion for the fiscal year ended January 31, 2019 due to the same reasons as the decline in net cash provided by operating activities, as well as $0.4 billion in increased capital expenditures. Free cash flow is considered a non-GAAP financial measure. Management believes, however, that free cash flow, which measures our ability to generate additional cash from our business operations, is an important financial measure for use in evaluating the company’s financial performance. Free cash flow should be considered in addition to, rather than as a substitute for, consolidated net income as a measure of our performance and net cash provided by operating activities as a measure of our liquidity. Additionally, Walmart’s definition of free cash flow is limited, in that it does not represent residual cash flows available for discretionary expenditures, due to the fact that the measure does not deduct the payments required for debt service and other contractual obligations or payments made for business acquisitions. Therefore, we believe it is important to view free cash flow as a measure that provides supplemental information to our Consolidated Statements of Cash Flows. Although other companies report their free cash flow, numerous methods may exist for calculating a company’s free cash flow. As a result, the method used by Walmart’s management to calculate our free cash flow may differ from the methods used by other companies to calculate their free cash flow. The following table sets forth a reconciliation of free cash flow, a non-GAAP financial measure, to net cash provided by operating activities, which we believe to be the GAAP financial measure most directly comparable to free cash flow, as well as information regarding net cash used in investing activities and net cash used in financing activities. Fiscal Years Ended January 31, (Dollars in millions) 2020 2019 Net cash provided by operating activities $ 25,255 $ 27,753 Payments for property and equipment (capital expenditures) (10,705) (10,344) Free cash flow $ 14,550 $ 17,409 Net cash used in investing activities1 $ (9,128) $ (24,036) Net cash used in financing activities (14,299) (2,537) 1 “Net cash used in investing activities” includes payments for property and equipment, which is also included in our computation of free cash flow.
  • 15. 15 Adjusted EPS Adjusted diluted earnings per share attributable to Walmart (Adjusted EPS) is considered a non-GAAP financial measure under the SEC’s rules because it excludes certain amounts included in the diluted earnings per share attributable to Walmart calculated in accordance with GAAP (EPS), the most directly comparable financial measure calculated in accordance with GAAP. Management believes that Adjusted EPS is a meaningful measure to share with investors because it best allows comparison of the performance with that of the comparable period. In addition, Adjusted EPS affords investors a view of what management considers Walmart’s core earnings performance and the ability to make a more informed assessment of such core earnings performance with that of the prior year. We adjust for the unrealized gains and losses on the company’s equity investment in JD.com each quarter because although the Company’s investment in JD.com was a strategic decision for the company’s retail operations in China, management’s measurement of that strategy is primarily focused on the Walmart China financial results rather than the investment value of JD.com. Additionally, management does not forecast changes in fair value of its equity investments. Accordingly, management adjusts EPS each quarter for the unrealized JD.com investment gains and losses each quarter. We have calculated Adjusted EPS for the three months and fiscal year ended January 31, 2020 by adjusting EPS for the following: (1) unrealized gains and losses on the company’s equity investment in JD.com; (2) a tax benefit on the revaluation of deferred tax liabilities as a result of an income tax rate reduction in India; (3) certain income tax matters; (4) certain business restructuring charges which primarily includes non-cash impairment charges on certain trade names and other long-lived assets. Three Months Ended January 31, 2020 Diluted earnings per share: Reported EPS $ 1.45 Adjustments: Pre-Tax Impact Tax Impact1,5 NCI Impact2 Net Impact Unrealized (gains) and losses on JD.com investment $ (0.33) $ 0.07 $ — $ (0.26) Business restructuring charges4 0.20 (0.05) — 0.15 Tax benefit from income tax rate reduction in India — (0.14) 0.03 (0.11) Certain income tax matters3 0.01 0.14 — 0.15 Net adjustments $ (0.07) Adjusted EPS $ 1.38 Fiscal Year Ended January 31, 20206 Diluted earnings per share: Reported EPS $ 5.19 Adjustments: Pre-Tax Impact Tax Impact1,5 NCI Impact2 Net Impact Unrealized (gains) and losses on JD.com investment $ (0.65) $ 0.14 $ — $ (0.51) Business restructuring charges4 0.30 (0.08) (0.01) $ 0.21 Tax benefit from rate reduction in India — (0.14) 0.03 (0.11) Certain income tax matters3 0.01 0.14 — $ 0.15 Net adjustments $ (0.26) Adjusted EPS $ 4.93 1 Calculated based on nature of item, including any realizable deductions, and statutory rate in effect for relevant jurisdictions. 2 Calculated based on the ownership percentages of our noncontrolling interests. 3 Represents a charge related to certain income tax matters and accrued interest unrelated to current period operations. 4 Business restructuring charges primarily consists of non-cash impairment charges for certain trade names, acquired developed technology, and property and equipment due to decisions that resulted in the write-off of certain assets in Walmart U.S. and Walmart International. Additionally, for the fiscal year ended January 31, 2020, business restructuring charges includes non-cash impairment charges on the Jabong.com trade name in Q3. 5 The reported effective tax rate was 24.3% and 24.4% for the three months and fiscal year ended January 31, 2020, respectively. When adjusted for the above items, the effective tax rate was 24.7% for both the three months and fiscal year ended ended January 31, 2020. 6 Quarterly adjustments or adjusted EPS may not sum to YTD adjustments or YTD adjusted EPS due to rounding.
  • 16. 16 As previously disclosed in our fiscal year ended January 31, 2019 press release, we have calculated Adjusted EPS for the three months and fiscal year ended January 31, 2019 by adjusting EPS for the following: (1) for the fiscal year ended January 31, 2019 only, the loss on sale of the majority stake in Walmart Brazil, (2) an adjustment to the provisional amount recorded in the third quarter of fiscal 2019 related to Tax Reform and (3) unrealized gains and losses on our JD.com investment. The provisional measurement period related to Tax Reform ended in the fourth quarter of fiscal 2019. Three Months Ended January 31, 2019 Diluted earnings per share: Reported EPS $ 1.27 Adjustments: Pre-Tax Impact Tax Impact1 Net Impact Unrealized (gains) and losses on JD.com investment $ (0.06) $ 0.03 $ (0.03) Adjustment to provisional amount for Tax Reform — 0.17 0.17 Net adjustments $ 0.14 Adjusted EPS $ 1.41 Fiscal Year Ended January 31, 20192 Diluted earnings per share: Reported EPS $ 2.26 Adjustments: Pre-Tax Impact Tax Impact1 Net Impact Loss on sale of majority stake in Walmart Brazil $ 1.64 $ (0.10) $ 1.54 Unrealized (gains) and losses on JD.com investment 1.20 (0.25) 0.95 Adjustment to provisional amount for Tax Reform — 0.16 0.16 Net adjustments $ 2.65 Adjusted EPS $ 4.91 1 Calculated based on nature of item, including any realizable deductions, and statutory rate in effect for relevant jurisdictions. 2 Quarterly adjustments or adjusted EPS may not sum to YTD adjustments or YTD adjusted EPS due to rounding.