SlideShare a Scribd company logo
1 of 21
Royal Dutch Shell plc


               1ST QUARTER 2008 UNAUDITED RESULTS

               • Royal Dutch Shell’s first quarter 2008 earnings, on a current cost of supplies (CCS)
                 basis, were $7.8 billion compared to $6.9 billion a year ago. Basic CCS earnings per share
                 increased by 15% versus the same quarter a year ago.
               • A first quarter 2008 dividend has been announced of $0.40 per share, an increase of 11%
                 over the US dollar dividend for the same period in 2007.
               • $1.1 billion or 0.5% of Royal Dutch Shell issued ordinary shares were bought back for
                 cancellation during the quarter.


               Royal Dutch Shell Chief Executive Jeroen van der Veer commented:
               “Good operating performance, combined with increased oil and gas prices, offset
               the impact of downstream conditions in the first quarter 2008. We have delivered
               another competitive set of earnings for Shell's shareholders. Shell has the largest
               capital spending programme in our industry today, to grow the company and play
               our part in ensuring that energy markets remain well supplied. Our strategy is on
               track.”


                    SUMMARY UNAUDITED RESULTS

                                     $ million                                   Quarters
                                                                                                %1
                                                                      Q1 2008 Q4 2007 Q1 2007

                                                                                8,467   7,281
                Income attributable to shareholders                     9,083                   +25
                Less: Estimated CCS adjustment for Oil Products and
                Chemicals (see note 2)                                          1,783     349
                                                                        1,307
                CCS earnings                                                                    +12
                                                                                6,684   6,932
                                                                        7,776

                                                                                 1.36    1.16
                                                                         1.47                   +27
                Basic earnings per share ($)
                                                                                 0.29    0.06
                                                                         0.21
                Less: Estimated CCS adjustment per share ($)
                Basic CCS earnings per share ($)                                 1.07    1.10
                                                                         1.26                   +15

                                                                                 0.36    0.36
                Dividend per ordinary share ($)                          0.40                   +11
               1
                   Q1 on Q1 change


The information in these quarterly results reflects the consolidated financial position and results of Royal
Dutch Shell plc (“Royal Dutch Shell”). All amounts shown throughout this report are unaudited.
Registered Office: England, Company No. 4366849, Shell Centre, London, SE1 7NA, UK
Royal Dutch Shell plc   2


KEY FEATURES OF THE FIRST QUARTER 2008

• First quarter 2008 CCS earnings were $7,776 million or 12% higher than in the same quarter a year
  ago.
• First quarter 2008 reported income was $9,083 million or 25% higher than in the same quarter a year
  ago.
• Basic CCS earnings per share increased by 15% versus the same quarter a year ago.
• Total cash returned to shareholders in the form of dividends and share repurchases in the first
  quarter 2008 was $3.4 billion.
• Cash flow from operating activities was $16.9 billion compared to $11.2 billion in the first quarter
  2007. Excluding net working capital movements, cash flow from operating activities was $14.1 billion
  compared to $11.6 billion a year ago.
• Capital investment for the first quarter 2008 was $8.1 billion. Net capital investment (capital
  investment, less divestment proceeds) for the first quarter 2008 was $7.6 billion.
• Return on average capital employed (ROACE), on a reported income basis (see note 3), was
  24.5%.
• Gearing (see note 5) was 12.7% at the end of the first quarter 2008 versus 14.6% at the end of the first
  quarter 2007.
• Oil and gas production, including oil sands production, for the first quarter 2008 was 3,522 thousand
  barrels of oil equivalent per day (boe/d), compared to 3,509 thousand boe/d in the same quarter last
  year. Excluding the impact of divestments, Canadian royalty changes and production sharing contracts
  (PSC) pricing effects, first quarter 2008 production increased by 1% compared to the same quarter last
  year.
• Liquefied Natural Gas (LNG) equity sales volumes of 3.51 million tonnes were a record and 6%
  higher than in the same quarter a year ago.
• Oil Products refinery availability increased to 92% compared to 85% in the first quarter of 2007.
  Chemicals manufacturing plant availability was 95% compared to 91% in the first quarter 2007. Oil
  Sands upgrader availability was 94%, compared to 93% in the same quarter last year.
• Oil Products sales volumes in the first quarter 2008 increased by 7% compared to the same quarter
  last year. Chemical product sales volumes decreased by 2% compared to the first quarter 2007.


      SUMMARY UNAUDITED RESULTS

                            $ million                                       Quarters
                                                                 Q1 2008 Q4 2007 Q1 2007 %1
 Exploration & Production2                                                  4,867    3,393
                                                                   5,143
 Gas & Power                                                                   631     803
                                                                     948
 Oil Sands2                                                                     82     115
                                                                     249
 Oil Products (CCS basis)                                                      876   1,488
                                                                   1,194
 Chemicals (CCS basis)                                                         348     480
                                                                     201
 Corporate                                                                      (4)    801
                                                                     146
 Minority interest                                                           (116)   (148)
                                                                    (105)

                                                                                 6,684      6,932 +12
 CCS earnings                                                       7,776
 1
     Q1 on Q1 change
 2
     As from the fourth quarter 2007, the earnings of the Oil Sands operations, which were previously
     reported as part of the Exploration & Production segment, are disclosed as a separate business
     segment. For comparison purposes, the Exploration & Production earnings up to the third quarter
     2007 have been reclassified by the amounts reported under the Oil Sands segment.
Royal Dutch Shell plc   3


SUMMARY OF IDENTIFIED ITEMS

Earnings in the first quarter 2008 reflected the following items, which in aggregate amounted to a net
charge of $77 million (compared to a net gain of $371 million in the first quarter 2007), as summarised in
the table below:
• Exploration & Production earnings included a net charge of $66 million, reflecting a gain from
  divestments of $84 million, which was offset by a charge of $150 million related to the mark-to-
  market valuation of certain UK gas contracts. Earnings for the first quarter 2007 included a net gain
  of $104 million reflecting both a gain from divestments of $126 million and a charge of $22 million
  related to the mark-to-market valuation of certain UK gas contracts.
• Gas & Power earnings included a charge of $11 million related to the mark-to-market valuation
  impact of certain gas contracts. Earnings for the first quarter 2007 included a net gain of $39 million,
  reflecting gains of $110 million related to divestments and a charge of $71 million related to the mark-
  to-market valuation of certain gas contracts.
• Oil Products earnings for the first quarter 2007 included a charge of $176 million related to
  impairment of certain assets.
• Corporate earnings for the first quarter 2007 included a gain of $404 million related to the realisation
  of gains on the sale of the equity portfolio held by Shell insurance companies.


    SUMMARY OF IDENTIFIED ITEMS

                     $ million                              Quarters
                                                            Q4 2007     Q1 2007
                                                Q1 2008
 Segment earnings impact of identified items:
                                                                 715         104
                                                     (66)
  Exploration & Production
                                                                  (7)         39
                                                     (11)
  Gas & Power
                                                                   94          -
                                                        -
  Oil Sands
                                                                 177       (176)
                                                        -
  Oil Products (CCS basis)
                                                                 (46)          -
                                                        -
  Chemicals (CCS basis)
                                                                   30        404
                                                        -
  Corporate
                                                                    -          -
                                                        -
  Minority interest
                                                                 963         371
 CCS earnings impact                                 (77)


These items generally relate to events with an impact of greater than $50 million on Shell earnings and
are shown to provide additional insight into the segment earnings, CCS earnings and income attributable
to shareholders. Further additional comments on the business segments are provided in the section
‘Earnings by business segment’ on page 4 and onwards.
Royal Dutch Shell plc   4


EARNINGS BY BUSINESS SEGMENT

    EXPLORATION & PRODUCTION

                          $ million                                             Quarters
                                                                                                        %2
                                                                             Q4 2007 Q1 2007
                                                                Q1 2008

 Segment earnings 3                                                               4,867        3,393 +52
                                                                     5,143

 Crude oil production (thousand b/d) 1                                            1,798        1,865 -6
                                                                     1,756
 Natural gas production available for sale (million scf/d)                        9,185        8,981 +9
                                                                     9,755
 Barrels of oil equivalent (thousand boe/d) 1                                     3,381        3,413 +1
                                                                     3,438
1
  Excludes oil sands bitumen production
2
  Q1 on Q1 change
3
  As from the fourth quarter 2007, the earnings of the Oil Sands operations, which were previously reported as
  part of the Exploration & Production segment, are disclosed as a separate business segment. For comparison
  purposes, the Exploration & Production earnings up to the third quarter 2007 have been reclassified by the
  amounts reported under the Oil Sands segment.


First quarter Exploration & Production segment earnings were $5,143 million compared to $3,393
million a year ago. Earnings included a net charge of $66 million related to identified items, compared to
a net gain of $104 million in the first quarter 2007 (see page 3 for details).
Earnings, when compared to the first quarter 2007, reflected higher gas production volumes and the
benefit of higher oil and gas prices on revenues, which were partly offset by lower oil production
volumes mainly in the USA and Europe and by higher exploration expenses.
Global liquids realisations were 66% higher than in the first quarter 2007, following marker crudes Brent
and WTI increases of 67% and 69% respectively. Global gas realisations were 25% higher than a year
ago. Outside the USA gas realisations increased by 24% whereas in the USA gas realisations increased by
32%.
First quarter 2008 production (excluding oil sands bitumen production) was 3,438 thousand barrels of oil
equivalent per day (boe/d) compared to 3,413 thousand boe/d a year ago. Crude oil production was
down 6% and natural gas production was up 9% compared to the first quarter 2007.
Production compared to the first quarter 2007 included additional volumes principally from Ormen
Lange (Shell share 17%) in Norway, West Salym (Shell share 50%) in Russia, Changbei (Shell share 50%)
in China, Deimos (Shell share 71.5%) in the USA, Stybarrow (indirect Shell share 17.1%) in Australia,
Chipmunk, Cliffdale and Orion (Shell share 100%) in Canada and Starling (Shell share 28%) in the
United Kingdom.


First quarter portfolio developments

In Australia, Shell reached an agreement with Woodside for the sale of various interests in North West
Shelf assets, with current production of approximately 8 thousand boe/d, for some $0.3 billion.
In the USA, Shell was awarded 141 blocks and was the apparent high bidder on another 134 blocks, with
high bids totalling $2.1 billion, offshore Alaska in the Chukchi Sea.
In Kazakhstan, the international members of the Kashagan consortium agreed to sell their participating
interests proportionally, allowing KazMunaiGas’s stake to increase to match that of the four major
shareholders. Assuming conclusion of the deal, Shell’s interest will change from 18.5% to 16.8%.
In Nigeria, Shell reached an agreement, amounting to some $0.6 billion, for the sale of offshore
deepwater blocks OML 134 and OML 125, with current production of approximately 7 thousand boe/d.
Royal Dutch Shell plc   5


      GAS & POWER

                       $ million                            Quarters
                                                                              %1
                                                         Q4 2007 Q1 2007
                                             Q1 2008

                                                             631       803
                                                   948                        +18
 Segment earnings

 Equity LNG sales volume (million tonnes)                    3.34      3.30
                                                  3.51                         +6
 1
     Q1 on Q1 change


First quarter Gas & Power segment earnings were $948 million compared to $803 million a year ago.
First quarter 2008 earnings included a charge of $11 million related to an identified item, compared to a
net gain of $39 million in the first quarter 2007 (see page 3 for details).
Earnings, when compared to the first quarter 2007, reflected strong LNG and gas to liquids (GTL)
product prices, increased LNG volumes, higher income from LNG cargo diversion opportunities and
continued strong operational performance.
LNG equity sales volumes of 3.51 million tonnes were 6% higher than in the same quarter a year ago.
Sales were higher in all five operating LNG ventures, with the largest increase coming from Nigeria
LNG (Shell interest 26%).
Marketing and trading earnings, non-LNG related, were similar to the same quarter a year ago.


First quarter portfolio developments

In China, during the first quarter, binding sales and purchase agreements were progressed with Qatargas
4 and PetroChina, leading to the long-term supply of LNG from Qatar to China, totalling 3 million
tonnes per annum over 25 years. Agreements were signed on April 10, 2008.


      OIL SANDS

                        $ million                          Quarters
                                                                              %1
                                               Q1 2008 Q4 2007 Q1 2007

                                                               82      115 +117
                                                    249
 Segment earnings

 Bitumen production (thousand b/d)                             55       96 -13
                                                       84

 Sales volumes (thousand b/d)                                  97      142
                                                    144                       +1

 Upgrader availability (%)                                     79       93
                                                       94
1
     Q1 on Q1 change


First quarter Oil Sands segment earnings were $249 million compared to $115 million in the same
quarter last year.
Earnings, when compared to the first quarter 2007, reflected the impact of higher oil prices on revenues
and a refund of royalty charges, which were partly offset by lower production volumes and higher costs.
Royal Dutch Shell plc   6


The royalty calculation methodology applicable to the Athabasca Oil Sands Project (AOSP) was revised
during the quarter, allowing the inclusion of additional eligible costs to the project. Due to this revision
the project cost payout timeframe for royalty calculation purposes was extended beyond July 2007 when
payout of the project was initially achieved. The royalty rate for the project was revised back to 1%
(from 25% since July 2007) until achievement of the project cost payout. As a consequence, the
adjustment related to prior quarters' bitumen production had an impact of 12 thousand barrels per day
on the first quarter 2008.
Bitumen production decreased by 13% compared to the same quarter last year. Excluding the effect of
the royalty revision, net production decreased by 25% due to operational issues at the mine related to
extreme cold weather conditions and unplanned maintenance at the Scotford Upgrader. Upgrader
availability increased to 94% compared to 93% in the first quarter 2007.


     OIL PRODUCTS

                        $ million                           Quarters
                                                                               %1
                                                 Q1 2008 Q4 2007 Q1 2007

                                                              2,556    1,802
 Segment earnings                                   2,367
 Less: Estimated CCS adjustment (see note 2)                  1,680      314
                                                    1,173
 Segment CCS earnings                                           876    1,488
                                                    1,194                       -20

 Refinery intake (thousand b/d)                               3,812    3,608
                                                    3,694                       +2

 Total Oil Products sales (thousand b/d)                      6,842    6,406
                                                    6,831                       +7

 Refinery availability (%)                                       94       85
                                                       92
1
    Q1 on Q1 change


First quarter Oil Products segment earnings were $2,367 million compared to $1,802 million for the
same period last year.
First quarter Oil Products CCS segment earnings were $1,194 million compared to $1,488 million in the
first quarter 2007. Earnings for the first quarter 2007 included a charge of $176 million related to
identified items (see page 3 for details).
CCS earnings, when compared to the first quarter 2007, were mainly impacted by lower realised refining
margins and higher operating costs, which were partly offset by higher marketing margins. In addition,
trading contributions increased compared to those in the first quarter 2007.
Industry refining margins declined worldwide compared to the same period a year ago. Refinery
availability increased to 92% compared to 85% in the first quarter of 2007 mainly due to lower planned
maintenance activities.
Marketing earnings, compared to the same period a year ago, increased mainly due to higher retail, B2B
and finished lubricants margins, which were partly offset by lower lubricants base oil margins.
Oil Products (marketing and trading) sales volumes increased by 7% compared to the same quarter last
year. Marketing sales volumes were 1% higher than in the first quarter 2007 and excluding the impact of
divestments 2% higher mainly because of increased aviation and retail sales.

First quarter portfolio developments

In France, on March 31, 2008, Shell concluded the sale of the Petit Couronne and Reichstett
Vendenheim refineries, with a combined capacity of some 220 thousand barrels per day.
Also in France, on April 1, 2008, Shell concluded the sale of the Berre-l’Etang refining and
petrochemical complex, with a refining capacity of 80 thousand barrels per day.
The combined cash proceeds expected from the above-mentioned sales amount to approximately $1.8
billion, which will be received after the end of the first quarter 2008.
Royal Dutch Shell plc   7


     CHEMICALS

                       $ million                             Quarters
                                                                                     %1
                                                  Q1 2008 Q4 2007 Q1 2007

                                                                501           527
                                                       348
 Segment earnings
 Less: Estimated CCS adjustment (see note 2)                    153            47
                                                       147
 Segment CCS earnings                                           348           480 -58
                                                       201

 Sales volumes (thousand tonnes)                               5,633         5,567
                                                     5,459                           -2

 Manufacturing plant availability (%)                             93           91
                                                        95
1
    Q1 on Q1 change


First quarter Chemicals segment earnings were $348 million compared to $527 million for the same
period last year.
First quarter Chemicals CCS segment earnings were $201 million compared to $480 million in the same
quarter last year.
CCS earnings, when compared to the first quarter 2007, reflected lower margins, higher operating costs
and lower income from equity-accounted investments. In addition, earnings were impacted by reduced
trading contributions.
Chemicals manufacturing plant availability increased to 95%, some 4 percent-points higher than in the
first quarter 2007.


     CORPORATE

                      $ million                               Quarters
                                                              Q4 2007          Q1 2007
                                                 Q1 2008

                                                                       (4)            801
 Segment earnings                                       146


First quarter Corporate segment earnings were $146 million compared to $801 million for the same
period last year. Earnings for the first quarter 2007 included a gain of $404 million related to an identified
item (see page 3 for details).
Earnings, when compared to the first quarter 2007, reflected lower interest income and currency
exchange rate results, reduced tax credits and higher shareholder costs.
Royal Dutch Shell plc   8


      PRICE AND MARGIN INFORMATION

      OIL & GAS

                                                                                               Quarters
                                                                                               Q4 2007 Q1 2007
                                                                                  Q1 2008
Realised oil prices – Exploration & Production1 (period average)                                $/bbl
WOUSA                                                                                             82.11   55.27
                                                                                      90.40
USA                                                                                               88.92   51.91
                                                                                      92.55
Global                                                                                            82.96   54.73
                                                                                      90.72

Realised oil prices – Oil Sands
                                                                                                 $/bbl
(period average)
Canada                                                                                              71.45        51.02
                                                                                      85.08

                                                                                           $/thousand scf
Realised gas prices (period average)
Europe                                                                                            8.15             7.84
                                                                                       9.00
WOUSA (including Europe)                                                                          5.64             4.71
                                                                                       5.85
USA                                                                                               7.45             7.20
                                                                                       9.52
Global                                                                                            6.00             5.21
                                                                                       6.52

Oil and gas marker industry prices (period average)
Brent ($/bbl)                                                                                      88.35          57.76
                                                                                      96.66
                                                                                                                  58.05
WTI ($/bbl)                                                                                        90.47
                                                                                      97.86
                                                                                                                  57.84
Edmonton Par ($/bbl)                                                                               89.00
                                                                                      97.91
                                                                                                                   7.15
Henry Hub ($/MMBtu)                                                                                 6.93
                                                                                       8.55
                                                                                                                  22.31
UK National Balancing Point (pence/therm)                                                          46.86
                                                                                      53.05
Japanese Crude Cocktail – JCC ($/bbl)2                                                                            57.56
                                                                                                   82.80
                                                                                      91.15

      REFINING & CRACKER INDUSTRY MARGINS3

                                                                                               Quarters
                                                                                               Q4 2007       Q1 2007
                                                                                  Q1 2008
                                                                                                $/bbl
Refining marker industry gross margins (period average)
ANS US West Coast coking margin                                                                   10.60           22.16
                                                                                       8.75
                                                                                                                  12.87
WTS US Gulf Coast coking margin                                                                    9.65
                                                                                       8.70
                                                                                                                   3.70
Rotterdam Brent complex                                                                            4.35
                                                                                       3.55
                                                                                                                   3.06
Singapore 80/20 Arab light/Tapis complex                                                           1.95
                                                                                       1.80
                                                                                               $/tonne
Cracker industry margins (period average)
US Ethane                                                                                       334.00          332.00
                                                                                    261.00
                                                                                                                525.00
Western Europe naphtha                                                                          279.00
                                                                                    411.00
                                                                                                  14.00         518.00
North East Asia naphtha                                                             117.00
1
    As from the fourth quarter 2007, the Oil Sands operations, which were previously reported as part of the
     Exploration & Production segment, are disclosed as a separate business segment. For comparison purposes, the
     Exploration & Production realised oil prices up to the third quarter 2007 have been reclassified.
2
    JCC prices for the first quarter are based on available market data up to the end of January 2008. Prices for this
     period will be updated when full market data is available.
3
    The refining and cracker industry margins shown above do not represent actual Shell realised margins for the
     periods. These are estimated industry margins based on available market information at the end of the quarter.
Royal Dutch Shell plc   9


    OIL & GAS – OPERATIONAL DATA

                                                                                      Quarters
                                                                                                            %1
                                                                                    Q4 2007      Q1 2007
                                                                    Q1 2008
                                                                               thousand b/d
Crude oil production
Europe                                                                                   395         447
                                                                           416
Africa                                                                                   352         339
                                                                           322
Asia Pacific                                                                             227         231
                                                                           208
Middle East, Russia, CIS                                                                 438         422
                                                                           428
USA                                                                                      310         343
                                                                           301
Other Western Hemisphere                                                                  76           83
                                                                            81
Total crude oil production excluding oil sands                                         1,798        1,865 -6
                                                                         1,756
Bitumen production – oil sands                                                            55           96
                                                                            84
Total crude oil production including oil sands                                         1,853        1,961 -6
                                                                         1,840

                                                                               million scf/d2
Natural gas production available for sale

Europe                                                                                 4,569        4,110
                                                                         4,894
Africa                                                                                   594         519
                                                                           619
Asia Pacific                                                                           2,166        2,455
                                                                         2,438
Middle East, Russia, CIS                                                                 239         260
                                                                           232
USA                                                                                    1,138        1,162
                                                                         1,105
Other Western Hemisphere                                                                 479         475
                                                                           467
                                                                                       9,185        8,981 +9
                                                                         9,755

                                                                              thousand boe/d3
Total production in barrels of oil equivalent


Europe                                                                                 1,183        1,156
                                                                         1,260
Africa                                                                                   454         428
                                                                           429
Asia Pacific                                                                             600         654
                                                                           628
Middle East, Russia, CIS                                                                 479         467
                                                                           468
USA                                                                                      506         543
                                                                           492
Other Western Hemisphere                                                                 159          165
                                                                           161
Total production excluding oil sands                                                   3,381        3,413 +1
                                                                         3,438
Bitumen production – oil sands                                                            55           96
                                                                            84
Total production including oil sands                                                   3,436        3,509 0
                                                                         3,522
1
  Q1 on Q1 change
2
  scf/d = standard cubic feet per day; 1 standard cubic foot = 0.0283 cubic metre
3
  Natural gas converted to oil equivalent at 5.8 million scf/d = thousand boe/d
Royal Dutch Shell plc   10


    OIL PRODUCTS AND CHEMICALS – OPERATIONAL DATA
                                                                                    Quarters
                                                                                               Q1 2007 %1
                                                                                 Q4 2007
                                                                    Q1 2008
                                                                              thousand b/d
Refinery processing intake
Europe                                                                              1,803           1,590
                                                                         1,741
Other Eastern Hemisphere                                                              821             759
                                                                           756
USA                                                                                   869             893
                                                                           845
Other Western Hemisphere                                                              319             366
                                                                           352
                                                                                    3,812           3,608 +2
                                                                         3,694


Oil sales
Gasolines                                                                             2,051         2,263
                                                                         2,083
Kerosenes                                                                               802             720
                                                                           814
Gas/diesel oils                                                                       2,429         2,114
                                                                         2,337
Fuel oil                                                                                769             679
                                                                           839
Other products                                                                          791             630
                                                                           758

                                                                                      6,842         6,406 +7
Total oil products *                                                     6,831


*Comprising:
Europe                                                                                1,983         1,832
                                                                         1,959
Other Eastern Hemisphere                                                              1,369         1,245
                                                                         1,245
USA                                                                                   1,485         1,401
                                                                         1,396
Other Western Hemisphere                                                                678             653
                                                                           755
Export sales                                                                          1,327         1,275
                                                                         1,476


Chemical sales volumes by main product category 2**                           thousand tonnes
Base chemicals                                                                        3,164         3,280
                                                                         3,119
First-line derivatives                                                                2,467         2,282
                                                                         2,338
Other                                                                                     2             5
                                                                             2
                                                                                      5,633         5,567 -2
                                                                         5,459


**Comprising:
Europe                                                                                2,190         2,273
                                                                         2,289
Other Eastern Hemisphere                                                              1,457         1,253
                                                                         1,228
USA                                                                                   1,802         1,871
                                                                         1,784
Other Western Hemisphere                                                                184             170
                                                                           158
1
  Q1 on Q1 change
2
  Excluding volumes sold by equity-accounted investments, chemical feedstock trading and by-products.
Royal Dutch Shell plc   11


NOTE
All amounts shown throughout this Report are unaudited.
Second quarter results are expected to be announced on July 31, 2008 and third quarter results are expected to be
announced on October 30, 2008.
In this document “Shell”, “Shell group” and “Royal Dutch Shell” are sometimes used for convenience where
references are made to Royal Dutch Shell and its subsidiaries in general. Likewise, the words “we”, “us” and “our”
are also used to refer to subsidiaries in general or to those who work for them. These expressions are also used
where no useful purpose is served by identifying the particular company or companies. ‘‘Subsidiaries’’, “Shell
subsidiaries” and “Shell companies” as used in this document refer to companies in which Royal Dutch Shell either
directly or indirectly has control, by having either a majority of the voting rights or the right to exercise a
controlling influence. The companies in which Shell has significant influence but not control are referred to as
“associated companies” or “associates” and companies in which Shell has joint control are referred to as “jointly
controlled entities”. In this document, associates and jointly controlled entities are also referred to as “equity-
accounted investments”.
This document contains forward-looking statements concerning the financial condition, results of operations and
businesses of Royal Dutch Shell. All statements other than statements of historical fact are, or may be deemed to be,
forward-looking statements. Forward-looking statements are statements of future expectations that are based on
management’s current expectations and assumptions and involve known and unknown risks and uncertainties that
could cause actual results, performance or events to differ materially from those expressed or implied in these
statements. Forward-looking statements include, among other things, statements concerning the potential exposure
of Royal Dutch Shell to market risks and statements expressing management’s expectations, beliefs, estimates,
forecasts, projections and assumptions. These forward-looking statements are identified by their use of terms and
phrases such as “anticipate”, “believe”, “could”, “estimate”, “expect”, “intend”, “may”, “plan”, “objectives”,
“outlook”, “probably”, “project”, “will”, “seek”, “target”, “risks”, “goals”, “should” and similar terms and
phrases. There are a number of factors that could affect the future operations of Royal Dutch Shell and could cause
those results to differ materially from those expressed in the forward-looking statements included in this document,
including (without limitation): (a) price fluctuations in crude oil and natural gas; (b) changes in demand for Shell’s
products; (c) currency fluctuations; (d) drilling and production results; (e) reserve estimates; (f) loss of market and
industry competition; (g) environmental and physical risks; (h) risks associated with the identification of suitable
potential acquisition properties and targets, and successful negotiation and completion of such transactions; (i) the
risk of doing business in developing countries and countries subject to international sanctions; (j) legislative, fiscal
and regulatory developments including potential litigation and regulatory effects arising from recategorisation of
reserves; (k) economic and financial market conditions in various countries and regions; (l) political risks,
including the risks of expropriation and renegotiation of the terms of contracts with governmental entities, delays or
advancements in the approval of projects and delays in the reimbursement for shared costs; and (m) changes in
trading conditions. All forward-looking statements contained in this document are expressly qualified in their
entirety by the cautionary statements contained or referred to in this section. Readers should not place undue
reliance on forward-looking statements. Each forward-looking statement speaks only as of the date of this
document, April 29, 2008. Neither Royal Dutch Shell nor any of its subsidiaries undertake any obligation to publicly
update or revise any forward-looking statement as a result of new information, future events or other information.
In light of these risks, results could differ materially from those stated, implied or inferred from the forward-looking
statements contained in this document.
Please refer to the Annual Report and Form 20-F for the year ended December 31, 2007 for a description of certain
important factors, risks and uncertainties that may affect Shell's businesses.
Cautionary Note to US Investors:
The United States Securities and Exchange Commission (SEC) permits oil and gas companies, in their filings with
the SEC, to disclose only proved reserves that a company has demonstrated by actual production or conclusive
formation tests to be economically and legally producible under existing economic and operating conditions. We
may use certain terms in this announcement that the SEC's guidelines strictly prohibit us from including in filings
with the SEC. US Investors are urged to consider closely the disclosure in our Form 20-F, File No 001-32575 and
disclosure in our Forms 6-K, File No 001-32575, available on the SEC’s website www.sec.gov. You can also obtain
these forms from the SEC by calling 1-800-SEC-0330.
                                                                                                         April 29, 2008
-12-

APPENDIX: ROYAL DUTCH SHELL FINANCIAL REPORT AND TABLES


      SUMMARISED STATEMENT OF INCOME (SEE NOTE 1)

                           $ million                                     Quarters
                                                               Q1 2008 Q4 2007 Q1 2007 %1
 Revenue2                                                       114,302 106,703 73,480
 Cost of sales                                                                90,603      60,666
                                                                  96,780
                                                                              16,100      12,814 +37
 Gross profit                                                     17,522

 Selling, distribution and administrative expenses                             4,880       3,778
                                                                   3,969
 Exploration                                                                     382         272
                                                                     325
 Share of profit of equity-accounted investments                               2,376       1,808
                                                                   2,425
 Net finance costs and other (income)/expense                                  (174)       (901)
                                                                     (53)
                                                                              13,388      11,473 +37
 Income before taxation                                           15,706

 Taxation                                                                       4,755      4,032
                                                                   6,505
                                                                                8,633      7,441 +24
 Income for the period                                             9,201

 Income attributable to minority interest                                         166        160
                                                                     118
                                                                                8,467      7,281 +25
 Income attributable to shareholders                               9,083
1
    Q1 on Q1 change
2
    Revenue is stated after deducting sales taxes, excise duties and similar levies of $22,920 million in
    Q1 2008, $21,552 million in Q4 2007, and $17,305 million in Q1 2007.


      BASIC EARNINGS PER SHARE (SEE NOTES 1, 2 AND 7)
                                                                              Quarters
                                                                             Q4 2007         Q1 2007
                                                              Q1 2008
    Earnings per share ($)                                                    1.36            1.16
                                                               1.47
    CCS earnings per share ($)                                                1.07            1.10
                                                               1.26


      DILUTED EARNINGS PER SHARE (SEE NOTES 1, 2 AND 7)
                                                                              Quarters
                                                                             Q4 2007         Q1 2007
                                                              Q1 2008
    Earnings per share ($)                                                    1.36            1.15
                                                               1.46
    CCS earnings per share ($)                                                1.07            1.10
                                                               1.25
-13-


     EARNINGS BY BUSINESS SEGMENT (SEE NOTES 2 AND 4)
                             $ million                                                Quarters
                                                                                                             %1
                                                                                   Q4 2007 Q1 2007
                                                                     Q1 2008


Exploration & Production2:
- World outside USA                                                                    3,763         2,541 +39
                                                                          3,540
- USA                                                                                  1,104           852 +88
                                                                          1,603
                                                                                       4,867         3,393 +52
                                                                          5,143

Gas & Power:
- World outside USA                                                                      639           682 +37
                                                                            933
- USA                                                                                     (8)          121 -88
                                                                             15
                                                                                         631           803 +18
                                                                            948


Oil Sands2:                                                                                82          115 +117
                                                                            249

Oil Products (CCS basis):
- World outside USA                                                                      789         1,158 -16
                                                                            978
- USA                                                                                     87           330 -35
                                                                            216
                                                                                         876         1,488 -20
                                                                          1,194

Chemicals (CCS basis):
- World outside USA                                                                      370           469 -35
                                                                            304
- USA                                                                                    (22)           11
                                                                           (103)
                                                                                         348           480 -58
                                                                            201

                                                                                       6,804         6,279 +23
Total operating segments                                                  7,735


Corporate:
- Interest and investment income/(expense)                                                 12          583
                                                                            110
- Currency exchange gains/(losses)                                                         82           46
                                                                            (62)
- Other - including taxation                                                             (98)          172
                                                                             98
                                                                                          (4)          801
                                                                            146


                                                                                       (116)         (148)
Minority interest                                                          (105)
                                                                                       6,684         6,932 +12
CCS earnings                                                              7,776

Estimated CCS adjustment for Oil Products and Chemicals                                1,783           349
                                                                          1,307
                                                                                       8,467         7,281 +25
Income attributable to shareholders of Royal Dutch Shell plc              9,083
1
    Q1 on Q1 change
2
    As from the fourth quarter 2007, the earnings of the Oil Sands operations, which were previously reported as
    part of the Exploration & Production segment, are disclosed as a separate business segment. For comparison
    purposes, the Exploration & Production earnings up to the third quarter 2007 have been reclassified by the
    amounts reported under the Oil Sands segment.
-14-


   SUMMARISED BALANCE SHEET (SEE NOTES 1 AND 6)

                                                                                         $ million
                                                                                       Dec 31, 2007      Mar 31, 2007
                                                                      Mar 31, 2008


Assets
Non-current assets:
Intangible assets                                                                               5,366            5,117
                                                                              5,282
Property, plant and equipment                                                                 101,521          103,624
                                                                            105,806
Investments:
- equity-accounted investments                                                                 29,153           22,001
                                                                             31,198
- financial assets                                                                              3,461            3,538
                                                                              3,333
Deferred tax                                                                                    3,253            3,135
                                                                              3,409
Pre-paid pension costs                                                                          5,559            4,289
                                                                              5,878
Other                                                                                           5,760            5,285
                                                                              6,406
                                                                                              154,073          146,989
                                                                            161,312

Current assets:
Inventories                                                                                    31,503           23,960
                                                                             32,184
Accounts receivable                                                                            74,238           58,998
                                                                             87,507
Cash and cash equivalents                                                                       9,656           11,184
                                                                             14,417
                                                                                              115,397           94,142
                                                                            134,108

                                                                                              269,470          241,131
Total assets                                                                295,420


Liabilities
Non-current liabilities:
Debt                                                                                            12,363          11,978
                                                                              11,378
Deferred tax                                                                                    13,039          13,114
                                                                              13,473
Retirement benefit obligations                                                                   6,165           6,219
                                                                               6,304
Other provisions                                                                                13,658          10,514
                                                                              14,016
Other                                                                                            3,893           4,154
                                                                               4,189
                                                                                                49,118          45,979
                                                                              49,360


Current liabilities:
Debt                                                                                             5,736           5,393
                                                                              5,684
Accounts payable and accrued liabilities                                                        75,697          64,156
                                                                             89,531
Taxes payable                                                                                    9,733           9,835
                                                                             14,412
Retirement benefit obligations                                                                     426             326
                                                                                455
Other provisions                                                                                 2,792           1,932
                                                                              2,815
                                                                                                94,384          81,642
                                                                            112,897

                                                                                              143,502          127,621
Total liabilities                                                           162,257

                                                                                              123,960          105,105
Equity attributable to shareholders of Royal Dutch Shell plc                131,130

Minority interest                                                                               2,008            8,405
                                                                              2,033
                                                                                              125,968          113,510
Total equity                                                                133,163

                                                                                              269,470          241,131
Total liabilities and equity                                                295,420
-15-


   SUMMARISED STATEMENT OF CASH FLOWS (SEE NOTE 1)
                                                                                    Quarters
                            $ million
                                                                                    Q4 2007         Q1 2007
                                                                     Q1 2008


Cash flow from operating activities:
                                                                                          8,633          7,441
Income for the period                                                     9,201
Adjustment for:
- Current taxation                                                                        5,551          4,267
                                                                          6,405
- Interest (income)/expense                                                                   96            198
                                                                            178
- Depreciation, depletion and amortisation                                                3,840          3,260
                                                                          3,146
- (Profit)/loss on sale of assets                                                       (1,799)           (362)
                                                                           (281)
- Decrease/(increase) in net working capital                                            (3,375)           (399)
                                                                          2,784
- Share of profit of equity-accounted investments                                       (2,376)         (1,808)
                                                                         (2,425)
- Dividends received from equity-accounted investments                                    2,282          1,587
                                                                          1,752
- Deferred taxation and other provisions                                                  (726)           (152)
                                                                            322
- Other                                                                                     (24)          (447)
                                                                             94
Cash flow from operating activities (pre-tax)                                           12,102          13,585
                                                                         21,176

Taxation paid                                                                           (6,809)         (2,404)
                                                                         (4,314)

                                                                                          5,293         11,181
Cash flow from operating activities                                      16,862


Cash flow from investing activities:
Capital expenditure                                                                     (8,013)         (5,361)
                                                                         (7,429)
Investments in equity-accounted investments                                               (519)           (370)
                                                                           (616)
Proceeds from sale of assets                                                              1,742             380
                                                                            445
Proceeds from sale of equity-accounted investments                                          561             115
                                                                             61
Proceeds from sale of /(additions to) financial assets                                    (120)             555
                                                                             10
Interest received                                                                           353             285
                                                                            285
                                                                                        (5,996)         (4,396)
Cash flow from investing activities                                      (7,244)


Cash flow from financing activities:
Net increase/(decrease) in debt with maturity period within                                317             341
                                                                           (863)
three months
Other debt: New borrowings                                                                  195          2,762
                                                                            185
              Repayments                                                                  (182)         (1,613)
                                                                           (664)
Interest paid                                                                             (312)           (351)
                                                                           (298)
Change in minority interest                                                                (52)         (3,110)
                                                                              (7)
Net issue/(repurchase) of shares                                                        (1,538)           (486)
                                                                         (1,073)
Dividends paid to:
- Shareholders of Royal Dutch Shell plc                                                 (2,318)         (2,100)
                                                                         (2,329)
- Minority interest                                                                        (17)            (42)
                                                                             (51)
Treasury shares:
- Net sales/(purchases) and dividends received                                             124             (16)
                                                                            200
                                                                                        (3,783)         (4,615)
Cash flow from financing activities                                      (4,900)

Currency translation differences relating to cash and cash                                     50             12
                                                                               43
equivalents
                                                                                        (4,436)          2,182
Increase/(decrease) in cash and cash equivalents                          4,761

                                                                                        14,092           9,002
Cash and cash equivalents at beginning of period                          9,656

                                                                                          9,656         11,184
Cash and cash equivalents at end of period                               14,417
-16-


     CAPITAL INVESTMENT

                               $ million                                                    Quarters
                                                                                            Q4 2007           Q1 2007
                                                                          Q1 2008
Capital expenditure:
Exploration & Production1:
- World outside USA                                                                                 2,704             2,872
                                                                                 2,202
- USA                                                                                               1,321               587
                                                                                 2,530
                                                                                                    4,025             3,459
                                                                                 4,732

Gas & Power:
- World outside USA                                                                                   862               657
                                                                                    823
- USA                                                                                                  11                 1
                                                                                      1
                                                                                                      873               658
                                                                                    824

Oil Sands1                                                                                            649               368
                                                                                    711

Oil Products:
- World outside USA                                                                                 1,257               474
                                                                                    456
- USA                                                                                                 123               195
                                                                                     61
                                                                                                    1,380               669
                                                                                    517

Chemicals:
- World outside USA                                                                                   419               153
                                                                                    374
- USA                                                                                                 103                83
                                                                                     34
                                                                                                      522               236
                                                                                    408

                                                                                                      193                45
Corporate                                                                            37

                                                                                                    7,642             5,435
Total capital expenditure                                                        7,229

Exploration expense
- World outside USA                                                                                   193               127
                                                                                    135
- USA                                                                                                 170                42
                                                                                     80
                                                                                                      363               169
                                                                                    215

New equity in equity-accounted investments
- World outside USA                                                                                   237               247
                                                                                    365
- USA                                                                                                  40                17
                                                                                      5
                                                                                                      277               264
                                                                                    370

                                                                                                      242               106
New loans to equity-accounted investments                                           246

                                                                                                    8,524             5,974
Total capital investment*                                                        8,060

*Comprising:
- Exploration & Production1                                                                         4,630             3,892
                                                                                 5,439
- Gas & Power                                                                                       1,091               732
                                                                                   925
- Oil Sands1                                                                                          649               368
                                                                                   711
- Oil Products                                                                                      1,438               699
                                                                                   536
- Chemicals                                                                                           523               238
                                                                                   412
- Corporate                                                                                           193                45
                                                                                    37
                                                                                                    8,524             5,974
                                                                                 8,060
1
    As from the fourth quarter 2007, the results of the Oil Sands operations, which were previously reported as part of the
    Exploration & Production segment, are disclosed as a separate business segment. For comparison purposes, the Exploration
    & Production results up to the third quarter 2007 have been reclassified by the amounts reported under the Oil Sands
    segment.
-17-


      ADDITIONAL SEGMENTAL INFORMATION1

                                $ million                                                      Quarters
                                                                                               Q4 2007           Q1 2007
                                                                            Q1 2008
Exploration & Production3
Segment earnings                                                                                      4,867              3,393
                                                                                    5,143
Including:
- Exploration                                                                                           382                272
                                                                                      325
- Depreciation, depletion & amortisation                                                              2,848              2,288
                                                                                    2,165
- Share of profit of equity-accounted investments                                                     1,278                913
                                                                                    1,212

Cash flow from operations                                                                             5,135              6,110
                                                                                  10,329
Less: Net working capital movements2                                                                    829            (1,086)
                                                                                     923
Cash flow from operations excluding net working capital
                                                                                                      4,306              7,196
                                                                                    9,406
movements

Capital employed                                                                                     47,682            52,088
                                                                                  47,927

Gas & Power
Segment earnings                                                                                         631               803
                                                                                      948
Including:
- Depreciation, depletion & amortisation                                                                  85                74
                                                                                       81
- Share of profit of equity-accounted investments                                                        533               420
                                                                                      584

Cash flow from operations                                                                                295               587
                                                                                    1,917
Less: Net working capital movements2                                                                   (379)             (169)
                                                                                      902
Cash flow from operations excluding net working capital
                                                                                                         674               756
                                                                                    1,015
movements

Capital employed                                                                                     19,383            18,453
                                                                                  19,305

Oil Sands3
Segment earnings                                                                                          82               115
                                                                                      249
Including:
- Depreciation, depletion & amortisation                                                                  42                39
                                                                                       44

Cash flow from operations                                                                                208               486
                                                                                     298
Less: Net working capital movements2                                                                     145               411
                                                                                    (102)
Cash flow from operations excluding net working capital
                                                                                                          63                75
                                                                                      400
movements

Capital employed                                                                                      4,603              3,175
                                                                                    5,292

1
    Corporate segment information has not been included in the above table. Please refer to the ‘Earnings by business segment’
    section for additional information. The above data does not consider Minority interest impacts on the segments.
2
    Excluding working capital movements related to taxation.
3
    As from the fourth quarter 2007, the results of the Oil Sands operations, which were previously reported as part of the
    Exploration & Production segment, are disclosed as a separate business segment. For comparison purposes, the Exploration
    & Production results up to the third quarter 2007 have been reclassified by the amounts reported under the Oil Sands
    segment.
-18-


      ADDITIONAL SEGMENTAL INFORMATION1 (continued)

                                $ million                                                      Quarters
                                                                                               Q4 2007           Q1 2007
                                                                            Q1 2008
Oil Products
Segment CCS earnings                                                                                    876              1,488
                                                                                    1,194
Including:
- Depreciation, depletion & amortisation                                                                607                656
                                                                                      608
- Share of profit of equity-accounted investments                                                       328                280
                                                                                      267

Cash flow from operations                                                                            (1,605)             2,123
                                                                                    2,362
Less: Net working capital movements2                                                                 (3,929)             (319)
                                                                                     (435)
Cash flow from operations excluding net working capital
                                                                                                      2,324              2,442
                                                                                    2,797
movements

Capital employed                                                                                     54,515            43,716
                                                                                  55,768

Chemicals
Segment CCS earnings                                                                                    348                480
                                                                                      201
Including:
- Depreciation, depletion & amortisation                                                                207                155
                                                                                      162
- Share of profit of equity-accounted investments                                                       165                188
                                                                                      158

Cash flow from operations                                                                                688               116
                                                                                      386
Less: Net working capital movements2                                                                   (123)             (514)
                                                                                       (9)
Cash flow from operations excluding net working capital
                                                                                                        811                630
                                                                                      395
movements

Capital employed                                                                                     10,571              9,187
                                                                                  11,233

1
    Corporate segment information has not been included in the above table. Please refer to the ‘Earnings by business segment’
    section for additional information. The above data does not consider Minority interest impacts on the segments.
2
    Excluding working capital movements related to taxation.
-19-

NOTES
1. Accounting policies and basis of presentation
The quarterly financial statements are prepared in accordance with International Financial Reporting
Standards (IFRS) and are also in accordance with IFRS as adopted by the European Union.
The Oil Sands operations, which were previously reported within the Exploration & Production segment,
are reported as a separate segment with effect from the fourth quarter 2007. Prior period financial
statements have been reclassified accordingly.
The accounting policies are unchanged from those set out in Note 2 to the Consolidated Financial
Statements of Royal Dutch Shell plc in the Annual Report and Form 20-F for the year ended December
31, 2007 on pages 117 to 121.

2. Earnings on an estimated current cost of supplies (CCS) basis
To facilitate a better understanding of underlying business performance, the financial results are also
analysed on an estimated current cost of supplies (CCS) basis as applied for the Oil Products and
Chemicals segment earnings. Earnings on an estimated current cost of supplies basis provides useful
information concerning the effect of changes in the cost of supplies on Royal Dutch Shell’s results of
operations and is a measure to manage the performance of the Oil Products and Chemicals segments but
is not a measure of financial performance under IFRS.
On this basis, Oil Products and Chemicals segment cost of sales of the volumes sold during the period
are based on the cost of supplies during the same period after making allowance for the estimated tax
effect, instead of the first-in, first-out (FIFO) method of inventory accounting. Earnings calculated on
this basis do not represent an application of the last-in, first-out (LIFO) inventory basis and do not
reflect any inventory drawdown effects.
3. Return on average capital employed (ROACE)
ROACE is defined as the sum of the current and previous three quarters’ income adjusted for interest
expense, after tax, as a percentage of the average capital employed for the period.
Components of the calculation are:
                              $ million                                                      Q1 2007
                                                                            Q1 2008
 Income (four quarters)                                                                           26,736
                                                                                 33,686
 Interest expense after tax                                                                          664
                                                                                    726
 ROACE numerator                                                                                  27,400
                                                                                 34,412

 Capital employed - opening                                                                      115,503
                                                                                130,881
 Capital employed - closing                                                                      130,881
                                                                                150,225
 Capital employed - average                                                                      123,192
                                                                                140,553

 ROACE                                                                                             22.2%
                                                                                  24.5%


ROACE in previous quarters has been shown on a Shell share basis. As a consequence of the significant
reduction of minority interest during 2007, ROACE calculations are now presented on a 100%-basis.
Prior period ROACE calculations have been adjusted for comparison purposes.

4. Earnings by business segment
Operating segment results are presented before deduction of minority interest and also exclude interest
and other income of a non-operational nature, interest expense, non-trading currency exchange effects
and tax on these items, which are included in the Corporate results. Operating segment results are after
tax and include equity-accounted investments.
-20-

5. Gearing
The numerator and denominator in the gearing calculation, as demonstrated below, used by Shell are
calculated by adding to reported debt and equity certain off-balance sheet obligations as at the beginning
of the year such as operating lease commitments and unfunded retirement benefits (if applicable) which
Shell believes to be in the nature of incremental debt, and deducting cash and cash equivalents judged to
be in excess of amounts required for operational purposes.


                                $ million                                                                         Mar 31, 2007
                                                                                            Mar 31, 2008
 Non-current debt                                                                                                        11,978
                                                                                                    11,378
 Current debt                                                                                                             5,393
                                                                                                     5,684
 Total debt                                                                                                              17,371
                                                                                                    17,062

 Add: Net present value of operating lease obligations                                                                         11,319
                                                                                                    14,387
       Unfunded retirement benefit obligations (after tax)                                                                          -
                                                                                                         -
 Less: Cash and cash equivalents in excess of operational requirements                                                          9,284
                                                                                                    12,117
 Adjusted debt                                                                                                                 19,406
                                                                                                    19,332

 Total equity                                                                                                                113,510
                                                                                                   133,163

 Total capital                                                                                                               132,916
                                                                                                   152,495

 Gearing ratio (adjusted debt as a percentage of total capital)                                                                 14.6%
                                                                                                        12.7%


6. Equity
Total equity comprises equity attributable to shareholders of Royal Dutch Shell and to the minority
interest. Other reserves comprise the capital redemption reserve, share premium reserve, merger reserve,
share-based compensation reserve, cumulative currency translation differences, unrealised gains/(losses)
on securities and unrealised gains/(losses) on cash flow hedges.


                                    Ordinary
                                                  Treasury         Other         Retained                    Minority
                                      share
            $ million                                                                           Total                       Total equity
                                                   shares         reserves       earnings                    interest
                                     capital
                                           536       (2,392)         14,148       111,668                        2,008
  At December 31, 2007                                                                          123,960                        125,968
                                             -             -              -         9,083                          118
  Income for the period                                                                           9,083                          9,201
  Income/(expense) recognised
                                              -              -           1,656              -                     (35)
                                                                                                  1,656                           1,621
  directly in equity
  Capital contributions/
  (repayments) from/to minority               -              -               -              -                       (7)
                                                                                                         -                           (7)
  shareholders
                                              -              -               -      (2,329)                       (51)
  Dividends paid                                                                                 (2,329)                        (2,380)
  Treasury shares: net
  sales/(purchases) and                       -          200                 -              -                           -
                                                                                                    200                             200
  dividends received
  Shares repurchased for
                                            (2)              -               2      (1,327)                             -
                                                                                                 (1,327)                        (1,327)
  cancellation
                                              -            -          (113)             -                            -
  Share-based compensation                                                                         (113)                          (113)
                                            534      (2,192)         15,693       117,095                        2,033
  At March 31, 2008                                                                             131,130                        133,163
Shell Q1 2008 Qra

More Related Content

What's hot

newmont mining oct_30_Q32008EarningsReleasePresentationFinal
newmont mining oct_30_Q32008EarningsReleasePresentationFinalnewmont mining oct_30_Q32008EarningsReleasePresentationFinal
newmont mining oct_30_Q32008EarningsReleasePresentationFinalfinance37
 
celanese q208earning srelease_july_21_2008
celanese q208earning srelease_july_21_2008celanese q208earning srelease_july_21_2008
celanese q208earning srelease_july_21_2008finance44
 
15 09-2008 Almir Guilherme Barbassa - Supply Chain for the Pre-salt Developme...
15 09-2008 Almir Guilherme Barbassa - Supply Chain for the Pre-salt Developme...15 09-2008 Almir Guilherme Barbassa - Supply Chain for the Pre-salt Developme...
15 09-2008 Almir Guilherme Barbassa - Supply Chain for the Pre-salt Developme...Petrobras
 
2007/02/06/01f
2007/02/06/01f2007/02/06/01f
2007/02/06/01ffinance21
 
shaw group 8C04E297-E3DD-4F1E-8BB2-56C5BB51CEDA_SGR_AnnualShareholdersMeeting...
shaw group 8C04E297-E3DD-4F1E-8BB2-56C5BB51CEDA_SGR_AnnualShareholdersMeeting...shaw group 8C04E297-E3DD-4F1E-8BB2-56C5BB51CEDA_SGR_AnnualShareholdersMeeting...
shaw group 8C04E297-E3DD-4F1E-8BB2-56C5BB51CEDA_SGR_AnnualShareholdersMeeting...finance36
 
alcoa 4Q08 Analyst Presentation
alcoa  	4Q08 Analyst Presentation alcoa  	4Q08 Analyst Presentation
alcoa 4Q08 Analyst Presentation finance8
 
Annual report 2008
Annual report 2008Annual report 2008
Annual report 2008canon99in
 
el paso 08_072QEarnings
el paso  08_072QEarningsel paso  08_072QEarnings
el paso 08_072QEarningsfinance49
 
raytheon Q4 Earnings Presentation
raytheon Q4 Earnings Presentationraytheon Q4 Earnings Presentation
raytheon Q4 Earnings Presentationfinance12
 
spectra energy Release050608
spectra energy Release050608spectra energy Release050608
spectra energy Release050608finance49
 
GasLog Q4 2012 results presentation
GasLog Q4 2012 results presentationGasLog Q4 2012 results presentation
GasLog Q4 2012 results presentationTradeWindsnews
 
public serviceenterprise group 1Q08Slides
public serviceenterprise group 1Q08Slidespublic serviceenterprise group 1Q08Slides
public serviceenterprise group 1Q08Slidesfinance20
 
spectra energy Q208RegG
spectra energy Q208RegGspectra energy Q208RegG
spectra energy Q208RegGfinance49
 

What's hot (15)

2007 Results
2007 Results2007 Results
2007 Results
 
newmont mining oct_30_Q32008EarningsReleasePresentationFinal
newmont mining oct_30_Q32008EarningsReleasePresentationFinalnewmont mining oct_30_Q32008EarningsReleasePresentationFinal
newmont mining oct_30_Q32008EarningsReleasePresentationFinal
 
celanese q208earning srelease_july_21_2008
celanese q208earning srelease_july_21_2008celanese q208earning srelease_july_21_2008
celanese q208earning srelease_july_21_2008
 
credit-suisse Supplements
credit-suisse Supplementscredit-suisse Supplements
credit-suisse Supplements
 
15 09-2008 Almir Guilherme Barbassa - Supply Chain for the Pre-salt Developme...
15 09-2008 Almir Guilherme Barbassa - Supply Chain for the Pre-salt Developme...15 09-2008 Almir Guilherme Barbassa - Supply Chain for the Pre-salt Developme...
15 09-2008 Almir Guilherme Barbassa - Supply Chain for the Pre-salt Developme...
 
2007/02/06/01f
2007/02/06/01f2007/02/06/01f
2007/02/06/01f
 
shaw group 8C04E297-E3DD-4F1E-8BB2-56C5BB51CEDA_SGR_AnnualShareholdersMeeting...
shaw group 8C04E297-E3DD-4F1E-8BB2-56C5BB51CEDA_SGR_AnnualShareholdersMeeting...shaw group 8C04E297-E3DD-4F1E-8BB2-56C5BB51CEDA_SGR_AnnualShareholdersMeeting...
shaw group 8C04E297-E3DD-4F1E-8BB2-56C5BB51CEDA_SGR_AnnualShareholdersMeeting...
 
alcoa 4Q08 Analyst Presentation
alcoa  	4Q08 Analyst Presentation alcoa  	4Q08 Analyst Presentation
alcoa 4Q08 Analyst Presentation
 
Annual report 2008
Annual report 2008Annual report 2008
Annual report 2008
 
el paso 08_072QEarnings
el paso  08_072QEarningsel paso  08_072QEarnings
el paso 08_072QEarnings
 
raytheon Q4 Earnings Presentation
raytheon Q4 Earnings Presentationraytheon Q4 Earnings Presentation
raytheon Q4 Earnings Presentation
 
spectra energy Release050608
spectra energy Release050608spectra energy Release050608
spectra energy Release050608
 
GasLog Q4 2012 results presentation
GasLog Q4 2012 results presentationGasLog Q4 2012 results presentation
GasLog Q4 2012 results presentation
 
public serviceenterprise group 1Q08Slides
public serviceenterprise group 1Q08Slidespublic serviceenterprise group 1Q08Slides
public serviceenterprise group 1Q08Slides
 
spectra energy Q208RegG
spectra energy Q208RegGspectra energy Q208RegG
spectra energy Q208RegG
 

Viewers also liked

Cost Effective Outcomes from FPSO Safety Case
Cost Effective Outcomes from FPSO Safety CaseCost Effective Outcomes from FPSO Safety Case
Cost Effective Outcomes from FPSO Safety CaseIQPC
 
MISRA-C-curse-or-cure
MISRA-C-curse-or-cureMISRA-C-curse-or-cure
MISRA-C-curse-or-cureChris Hills
 
MISRA-C as a functional programming with subset of C programming language
MISRA-C as a functional programming with subset of C programming languageMISRA-C as a functional programming with subset of C programming language
MISRA-C as a functional programming with subset of C programming languageKiyoshi Ogawa
 
Misra c-2004
Misra c-2004Misra c-2004
Misra c-2004sand390
 
MISRA Safety Case Guidelines -
MISRA Safety Case Guidelines - MISRA Safety Case Guidelines -
MISRA Safety Case Guidelines - Automotive IQ
 
An Introduction to MISRA C:2012
An Introduction to MISRA C:2012An Introduction to MISRA C:2012
An Introduction to MISRA C:2012PRQA
 
Misra C Software Development Standard
Misra C Software Development StandardMisra C Software Development Standard
Misra C Software Development StandardVittorio Giovara
 
Corrosion Management System and Implementation of IMO PSPC on FPSO
Corrosion Management System and Implementation of IMO PSPC on FPSOCorrosion Management System and Implementation of IMO PSPC on FPSO
Corrosion Management System and Implementation of IMO PSPC on FPSOPutu Indra Mahatrisna
 

Viewers also liked (10)

Cost Effective Outcomes from FPSO Safety Case
Cost Effective Outcomes from FPSO Safety CaseCost Effective Outcomes from FPSO Safety Case
Cost Effective Outcomes from FPSO Safety Case
 
MISRA-C-curse-or-cure
MISRA-C-curse-or-cureMISRA-C-curse-or-cure
MISRA-C-curse-or-cure
 
Misra c
Misra cMisra c
Misra c
 
MISRA-C as a functional programming with subset of C programming language
MISRA-C as a functional programming with subset of C programming languageMISRA-C as a functional programming with subset of C programming language
MISRA-C as a functional programming with subset of C programming language
 
Misra c rules
Misra c rulesMisra c rules
Misra c rules
 
Misra c-2004
Misra c-2004Misra c-2004
Misra c-2004
 
MISRA Safety Case Guidelines -
MISRA Safety Case Guidelines - MISRA Safety Case Guidelines -
MISRA Safety Case Guidelines -
 
An Introduction to MISRA C:2012
An Introduction to MISRA C:2012An Introduction to MISRA C:2012
An Introduction to MISRA C:2012
 
Misra C Software Development Standard
Misra C Software Development StandardMisra C Software Development Standard
Misra C Software Development Standard
 
Corrosion Management System and Implementation of IMO PSPC on FPSO
Corrosion Management System and Implementation of IMO PSPC on FPSOCorrosion Management System and Implementation of IMO PSPC on FPSO
Corrosion Management System and Implementation of IMO PSPC on FPSO
 

Similar to Shell Q1 2008 Qra

public serviceenterprise group 2Q_2008_Webcast_Slides_FINAL
public serviceenterprise group 2Q_2008_Webcast_Slides_FINALpublic serviceenterprise group 2Q_2008_Webcast_Slides_FINAL
public serviceenterprise group 2Q_2008_Webcast_Slides_FINALfinance20
 
first energy 4Q 07
first energy 4Q 07first energy 4Q 07
first energy 4Q 07finance21
 
first energy 4Q 07
first energy 4Q 07first energy 4Q 07
first energy 4Q 07finance21
 
public serviceenterprise group 3Q 2008 slides
public serviceenterprise group 3Q 2008 slidespublic serviceenterprise group 3Q 2008 slides
public serviceenterprise group 3Q 2008 slidesfinance20
 
public serviceenterprise group 3Q 2008 slides
public serviceenterprise group 3Q 2008 slidespublic serviceenterprise group 3Q 2008 slides
public serviceenterprise group 3Q 2008 slidesfinance20
 
marathon oil 1st Quarter 2008
marathon oil 1st Quarter 2008marathon oil 1st Quarter 2008
marathon oil 1st Quarter 2008finance4
 
4 q08 presentation
4 q08 presentation4 q08 presentation
4 q08 presentationEquatorial
 
4 q08 presentation
4 q08 presentation4 q08 presentation
4 q08 presentationEquatorial
 
Pace Oil and Gas Investor Presentation
Pace Oil and Gas Investor PresentationPace Oil and Gas Investor Presentation
Pace Oil and Gas Investor PresentationCompany Spotlight
 
AES 2Q 08 Review
AES 2Q 08 ReviewAES 2Q 08 Review
AES 2Q 08 Reviewfinance19
 
Chevron 2008 2Q Earnings Conference Call Presentation (color)
Chevron 2008 2Q Earnings Conference Call Presentation (color)Chevron 2008 2Q Earnings Conference Call Presentation (color)
Chevron 2008 2Q Earnings Conference Call Presentation (color)finance1
 
energy future holindings 081908_Q208_Investor_Call_Deck_FINAL
energy future holindings 081908_Q208_Investor_Call_Deck_FINALenergy future holindings 081908_Q208_Investor_Call_Deck_FINAL
energy future holindings 081908_Q208_Investor_Call_Deck_FINALfinance29
 
northrop grumman Slide Presentation 2007 4th
northrop grumman Slide Presentation 2007 4thnorthrop grumman Slide Presentation 2007 4th
northrop grumman Slide Presentation 2007 4thfinance8
 
merck 4Q08 Earnings Announcemen
merck 4Q08 Earnings Announcemenmerck 4Q08 Earnings Announcemen
merck 4Q08 Earnings Announcemenfinance11
 
merck » 4Q08 Earnings Release
merck » 	4Q08 Earnings Releasemerck » 	4Q08 Earnings Release
merck » 4Q08 Earnings Releasefinance11
 
fpl group library.corporate-library. corporate-
 fpl group  library.corporate-library. corporate- fpl group  library.corporate-library. corporate-
fpl group library.corporate-library. corporate-finance17
 
Chevron Corp_Events & Presentations_Earnings Release_2008 4Q
Chevron Corp_Events & Presentations_Earnings Release_2008 4QChevron Corp_Events & Presentations_Earnings Release_2008 4Q
Chevron Corp_Events & Presentations_Earnings Release_2008 4QManya Mohan
 
Chevron2008 4Q Earnings Release
Chevron2008  4Q Earnings ReleaseChevron2008  4Q Earnings Release
Chevron2008 4Q Earnings Releasefinance1
 
Shell Q1 2008 Keyfinancials
Shell Q1 2008 KeyfinancialsShell Q1 2008 Keyfinancials
Shell Q1 2008 Keyfinancialsearningsreport
 
raytheon Q4 Earnings Presentation
raytheon Q4 Earnings Presentationraytheon Q4 Earnings Presentation
raytheon Q4 Earnings Presentationfinance12
 

Similar to Shell Q1 2008 Qra (20)

public serviceenterprise group 2Q_2008_Webcast_Slides_FINAL
public serviceenterprise group 2Q_2008_Webcast_Slides_FINALpublic serviceenterprise group 2Q_2008_Webcast_Slides_FINAL
public serviceenterprise group 2Q_2008_Webcast_Slides_FINAL
 
first energy 4Q 07
first energy 4Q 07first energy 4Q 07
first energy 4Q 07
 
first energy 4Q 07
first energy 4Q 07first energy 4Q 07
first energy 4Q 07
 
public serviceenterprise group 3Q 2008 slides
public serviceenterprise group 3Q 2008 slidespublic serviceenterprise group 3Q 2008 slides
public serviceenterprise group 3Q 2008 slides
 
public serviceenterprise group 3Q 2008 slides
public serviceenterprise group 3Q 2008 slidespublic serviceenterprise group 3Q 2008 slides
public serviceenterprise group 3Q 2008 slides
 
marathon oil 1st Quarter 2008
marathon oil 1st Quarter 2008marathon oil 1st Quarter 2008
marathon oil 1st Quarter 2008
 
4 q08 presentation
4 q08 presentation4 q08 presentation
4 q08 presentation
 
4 q08 presentation
4 q08 presentation4 q08 presentation
4 q08 presentation
 
Pace Oil and Gas Investor Presentation
Pace Oil and Gas Investor PresentationPace Oil and Gas Investor Presentation
Pace Oil and Gas Investor Presentation
 
AES 2Q 08 Review
AES 2Q 08 ReviewAES 2Q 08 Review
AES 2Q 08 Review
 
Chevron 2008 2Q Earnings Conference Call Presentation (color)
Chevron 2008 2Q Earnings Conference Call Presentation (color)Chevron 2008 2Q Earnings Conference Call Presentation (color)
Chevron 2008 2Q Earnings Conference Call Presentation (color)
 
energy future holindings 081908_Q208_Investor_Call_Deck_FINAL
energy future holindings 081908_Q208_Investor_Call_Deck_FINALenergy future holindings 081908_Q208_Investor_Call_Deck_FINAL
energy future holindings 081908_Q208_Investor_Call_Deck_FINAL
 
northrop grumman Slide Presentation 2007 4th
northrop grumman Slide Presentation 2007 4thnorthrop grumman Slide Presentation 2007 4th
northrop grumman Slide Presentation 2007 4th
 
merck 4Q08 Earnings Announcemen
merck 4Q08 Earnings Announcemenmerck 4Q08 Earnings Announcemen
merck 4Q08 Earnings Announcemen
 
merck » 4Q08 Earnings Release
merck » 	4Q08 Earnings Releasemerck » 	4Q08 Earnings Release
merck » 4Q08 Earnings Release
 
fpl group library.corporate-library. corporate-
 fpl group  library.corporate-library. corporate- fpl group  library.corporate-library. corporate-
fpl group library.corporate-library. corporate-
 
Chevron Corp_Events & Presentations_Earnings Release_2008 4Q
Chevron Corp_Events & Presentations_Earnings Release_2008 4QChevron Corp_Events & Presentations_Earnings Release_2008 4Q
Chevron Corp_Events & Presentations_Earnings Release_2008 4Q
 
Chevron2008 4Q Earnings Release
Chevron2008  4Q Earnings ReleaseChevron2008  4Q Earnings Release
Chevron2008 4Q Earnings Release
 
Shell Q1 2008 Keyfinancials
Shell Q1 2008 KeyfinancialsShell Q1 2008 Keyfinancials
Shell Q1 2008 Keyfinancials
 
raytheon Q4 Earnings Presentation
raytheon Q4 Earnings Presentationraytheon Q4 Earnings Presentation
raytheon Q4 Earnings Presentation
 

More from earningsreport

Eastman 4Q and Full Year 2008 Earnings
Eastman 4Q and Full Year 2008 Earnings Eastman 4Q and Full Year 2008 Earnings
Eastman 4Q and Full Year 2008 Earnings earningsreport
 
Gentex investor presentation
Gentex investor presentationGentex investor presentation
Gentex investor presentationearningsreport
 
L.B. Foster Reports Fourth Quarter Operating Results
L.B. Foster Reports Fourth Quarter Operating ResultsL.B. Foster Reports Fourth Quarter Operating Results
L.B. Foster Reports Fourth Quarter Operating Resultsearningsreport
 
Data Domain, Inc. Reports Fourth Quarter Financial Results
Data Domain, Inc. Reports Fourth Quarter Financial ResultsData Domain, Inc. Reports Fourth Quarter Financial Results
Data Domain, Inc. Reports Fourth Quarter Financial Resultsearningsreport
 
First Banks Announces 4Q 2008 Results
First Banks Announces 4Q  2008 ResultsFirst Banks Announces 4Q  2008 Results
First Banks Announces 4Q 2008 Resultsearningsreport
 
Questar 3Q-2008 EARNINGS
Questar 3Q-2008 EARNINGSQuestar 3Q-2008 EARNINGS
Questar 3Q-2008 EARNINGSearningsreport
 
Mitsubishi electric 3Q financial results of Fiscal 2009
Mitsubishi electric 3Q financial results of Fiscal 2009Mitsubishi electric 3Q financial results of Fiscal 2009
Mitsubishi electric 3Q financial results of Fiscal 2009earningsreport
 
Maxim 2Q FISCAL 2009 RESULTS
Maxim 2Q FISCAL 2009 RESULTSMaxim 2Q FISCAL 2009 RESULTS
Maxim 2Q FISCAL 2009 RESULTSearningsreport
 
Conexant Q1 2009 financial results
Conexant Q1 2009 financial resultsConexant Q1 2009 financial results
Conexant Q1 2009 financial resultsearningsreport
 
Flagstar Bancorp Q42008 earnings report
Flagstar Bancorp Q42008 earnings reportFlagstar Bancorp Q42008 earnings report
Flagstar Bancorp Q42008 earnings reportearningsreport
 
Capital Product Partners Fourth Quarter 2008 Earnings
Capital Product Partners Fourth Quarter 2008 EarningsCapital Product Partners Fourth Quarter 2008 Earnings
Capital Product Partners Fourth Quarter 2008 Earningsearningsreport
 
Gannett 4Q 2008 earnings release
Gannett 4Q 2008 earnings releaseGannett 4Q 2008 earnings release
Gannett 4Q 2008 earnings releaseearningsreport
 
Exxon mobil 4Q 2008 earnings release
Exxon mobil 4Q 2008 earnings releaseExxon mobil 4Q 2008 earnings release
Exxon mobil 4Q 2008 earnings releaseearningsreport
 
Chevron Q4 2008 earnings release
Chevron Q4 2008 earnings releaseChevron Q4 2008 earnings release
Chevron Q4 2008 earnings releaseearningsreport
 
Horizon Lines Fourth Quarter 2008 Earnings Release
Horizon Lines Fourth Quarter 2008 Earnings ReleaseHorizon Lines Fourth Quarter 2008 Earnings Release
Horizon Lines Fourth Quarter 2008 Earnings Releaseearningsreport
 
Sony Q3 2008 financial results
Sony Q3 2008 financial resultsSony Q3 2008 financial results
Sony Q3 2008 financial resultsearningsreport
 
Peugeot Q3 2008 financial results
Peugeot Q3 2008 financial resultsPeugeot Q3 2008 financial results
Peugeot Q3 2008 financial resultsearningsreport
 
Peugeot Financial Results for the 1st half of 2008
Peugeot  Financial Results for the 1st half of 2008Peugeot  Financial Results for the 1st half of 2008
Peugeot Financial Results for the 1st half of 2008earningsreport
 
Tesco Q3 fianancial results
Tesco Q3 fianancial resultsTesco Q3 fianancial results
Tesco Q3 fianancial resultsearningsreport
 
tesco Annual Report and Financial Statements 2008
tesco Annual Report and Financial Statements 2008tesco Annual Report and Financial Statements 2008
tesco Annual Report and Financial Statements 2008earningsreport
 

More from earningsreport (20)

Eastman 4Q and Full Year 2008 Earnings
Eastman 4Q and Full Year 2008 Earnings Eastman 4Q and Full Year 2008 Earnings
Eastman 4Q and Full Year 2008 Earnings
 
Gentex investor presentation
Gentex investor presentationGentex investor presentation
Gentex investor presentation
 
L.B. Foster Reports Fourth Quarter Operating Results
L.B. Foster Reports Fourth Quarter Operating ResultsL.B. Foster Reports Fourth Quarter Operating Results
L.B. Foster Reports Fourth Quarter Operating Results
 
Data Domain, Inc. Reports Fourth Quarter Financial Results
Data Domain, Inc. Reports Fourth Quarter Financial ResultsData Domain, Inc. Reports Fourth Quarter Financial Results
Data Domain, Inc. Reports Fourth Quarter Financial Results
 
First Banks Announces 4Q 2008 Results
First Banks Announces 4Q  2008 ResultsFirst Banks Announces 4Q  2008 Results
First Banks Announces 4Q 2008 Results
 
Questar 3Q-2008 EARNINGS
Questar 3Q-2008 EARNINGSQuestar 3Q-2008 EARNINGS
Questar 3Q-2008 EARNINGS
 
Mitsubishi electric 3Q financial results of Fiscal 2009
Mitsubishi electric 3Q financial results of Fiscal 2009Mitsubishi electric 3Q financial results of Fiscal 2009
Mitsubishi electric 3Q financial results of Fiscal 2009
 
Maxim 2Q FISCAL 2009 RESULTS
Maxim 2Q FISCAL 2009 RESULTSMaxim 2Q FISCAL 2009 RESULTS
Maxim 2Q FISCAL 2009 RESULTS
 
Conexant Q1 2009 financial results
Conexant Q1 2009 financial resultsConexant Q1 2009 financial results
Conexant Q1 2009 financial results
 
Flagstar Bancorp Q42008 earnings report
Flagstar Bancorp Q42008 earnings reportFlagstar Bancorp Q42008 earnings report
Flagstar Bancorp Q42008 earnings report
 
Capital Product Partners Fourth Quarter 2008 Earnings
Capital Product Partners Fourth Quarter 2008 EarningsCapital Product Partners Fourth Quarter 2008 Earnings
Capital Product Partners Fourth Quarter 2008 Earnings
 
Gannett 4Q 2008 earnings release
Gannett 4Q 2008 earnings releaseGannett 4Q 2008 earnings release
Gannett 4Q 2008 earnings release
 
Exxon mobil 4Q 2008 earnings release
Exxon mobil 4Q 2008 earnings releaseExxon mobil 4Q 2008 earnings release
Exxon mobil 4Q 2008 earnings release
 
Chevron Q4 2008 earnings release
Chevron Q4 2008 earnings releaseChevron Q4 2008 earnings release
Chevron Q4 2008 earnings release
 
Horizon Lines Fourth Quarter 2008 Earnings Release
Horizon Lines Fourth Quarter 2008 Earnings ReleaseHorizon Lines Fourth Quarter 2008 Earnings Release
Horizon Lines Fourth Quarter 2008 Earnings Release
 
Sony Q3 2008 financial results
Sony Q3 2008 financial resultsSony Q3 2008 financial results
Sony Q3 2008 financial results
 
Peugeot Q3 2008 financial results
Peugeot Q3 2008 financial resultsPeugeot Q3 2008 financial results
Peugeot Q3 2008 financial results
 
Peugeot Financial Results for the 1st half of 2008
Peugeot  Financial Results for the 1st half of 2008Peugeot  Financial Results for the 1st half of 2008
Peugeot Financial Results for the 1st half of 2008
 
Tesco Q3 fianancial results
Tesco Q3 fianancial resultsTesco Q3 fianancial results
Tesco Q3 fianancial results
 
tesco Annual Report and Financial Statements 2008
tesco Annual Report and Financial Statements 2008tesco Annual Report and Financial Statements 2008
tesco Annual Report and Financial Statements 2008
 

Recently uploaded

Call Girls Service Nagpur Maya Call 7001035870 Meet With Nagpur Escorts
Call Girls Service Nagpur Maya Call 7001035870 Meet With Nagpur EscortsCall Girls Service Nagpur Maya Call 7001035870 Meet With Nagpur Escorts
Call Girls Service Nagpur Maya Call 7001035870 Meet With Nagpur Escortsranjana rawat
 
OAT_RI_Ep19 WeighingTheRisks_Apr24_TheYellowMetal.pptx
OAT_RI_Ep19 WeighingTheRisks_Apr24_TheYellowMetal.pptxOAT_RI_Ep19 WeighingTheRisks_Apr24_TheYellowMetal.pptx
OAT_RI_Ep19 WeighingTheRisks_Apr24_TheYellowMetal.pptxhiddenlevers
 
call girls in Nand Nagri (DELHI) 🔝 >༒9953330565🔝 genuine Escort Service 🔝✔️✔️
call girls in  Nand Nagri (DELHI) 🔝 >༒9953330565🔝 genuine Escort Service 🔝✔️✔️call girls in  Nand Nagri (DELHI) 🔝 >༒9953330565🔝 genuine Escort Service 🔝✔️✔️
call girls in Nand Nagri (DELHI) 🔝 >༒9953330565🔝 genuine Escort Service 🔝✔️✔️9953056974 Low Rate Call Girls In Saket, Delhi NCR
 
Classical Theory of Macroeconomics by Adam Smith
Classical Theory of Macroeconomics by Adam SmithClassical Theory of Macroeconomics by Adam Smith
Classical Theory of Macroeconomics by Adam SmithAdamYassin2
 
Independent Lucknow Call Girls 8923113531WhatsApp Lucknow Call Girls make you...
Independent Lucknow Call Girls 8923113531WhatsApp Lucknow Call Girls make you...Independent Lucknow Call Girls 8923113531WhatsApp Lucknow Call Girls make you...
Independent Lucknow Call Girls 8923113531WhatsApp Lucknow Call Girls make you...makika9823
 
Q3 2024 Earnings Conference Call and Webcast Slides
Q3 2024 Earnings Conference Call and Webcast SlidesQ3 2024 Earnings Conference Call and Webcast Slides
Q3 2024 Earnings Conference Call and Webcast SlidesMarketing847413
 
fca-bsps-decision-letter-redacted (1).pdf
fca-bsps-decision-letter-redacted (1).pdffca-bsps-decision-letter-redacted (1).pdf
fca-bsps-decision-letter-redacted (1).pdfHenry Tapper
 
VIP Call Girls Service Dilsukhnagar Hyderabad Call +91-8250192130
VIP Call Girls Service Dilsukhnagar Hyderabad Call +91-8250192130VIP Call Girls Service Dilsukhnagar Hyderabad Call +91-8250192130
VIP Call Girls Service Dilsukhnagar Hyderabad Call +91-8250192130Suhani Kapoor
 
Andheri Call Girls In 9825968104 Mumbai Hot Models
Andheri Call Girls In 9825968104 Mumbai Hot ModelsAndheri Call Girls In 9825968104 Mumbai Hot Models
Andheri Call Girls In 9825968104 Mumbai Hot Modelshematsharma006
 
VIP Kolkata Call Girl Serampore 👉 8250192130 Available With Room
VIP Kolkata Call Girl Serampore 👉 8250192130  Available With RoomVIP Kolkata Call Girl Serampore 👉 8250192130  Available With Room
VIP Kolkata Call Girl Serampore 👉 8250192130 Available With Roomdivyansh0kumar0
 
Russian Call Girls In Gtb Nagar (Delhi) 9711199012 💋✔💕😘 Naughty Call Girls Se...
Russian Call Girls In Gtb Nagar (Delhi) 9711199012 💋✔💕😘 Naughty Call Girls Se...Russian Call Girls In Gtb Nagar (Delhi) 9711199012 💋✔💕😘 Naughty Call Girls Se...
Russian Call Girls In Gtb Nagar (Delhi) 9711199012 💋✔💕😘 Naughty Call Girls Se...shivangimorya083
 
Chapter 2.ppt of macroeconomics by mankiw 9th edition
Chapter 2.ppt of macroeconomics by mankiw 9th editionChapter 2.ppt of macroeconomics by mankiw 9th edition
Chapter 2.ppt of macroeconomics by mankiw 9th editionMuhammadHusnain82237
 
VIP Call Girls Service Begumpet Hyderabad Call +91-8250192130
VIP Call Girls Service Begumpet Hyderabad Call +91-8250192130VIP Call Girls Service Begumpet Hyderabad Call +91-8250192130
VIP Call Girls Service Begumpet Hyderabad Call +91-8250192130Suhani Kapoor
 
House of Commons ; CDC schemes overview document
House of Commons ; CDC schemes overview documentHouse of Commons ; CDC schemes overview document
House of Commons ; CDC schemes overview documentHenry Tapper
 
Stock Market Brief Deck for 4/24/24 .pdf
Stock Market Brief Deck for 4/24/24 .pdfStock Market Brief Deck for 4/24/24 .pdf
Stock Market Brief Deck for 4/24/24 .pdfMichael Silva
 
Malad Call Girl in Services 9892124323 | ₹,4500 With Room Free Delivery
Malad Call Girl in Services  9892124323 | ₹,4500 With Room Free DeliveryMalad Call Girl in Services  9892124323 | ₹,4500 With Room Free Delivery
Malad Call Girl in Services 9892124323 | ₹,4500 With Room Free DeliveryPooja Nehwal
 
High Class Call Girls Nagpur Grishma Call 7001035870 Meet With Nagpur Escorts
High Class Call Girls Nagpur Grishma Call 7001035870 Meet With Nagpur EscortsHigh Class Call Girls Nagpur Grishma Call 7001035870 Meet With Nagpur Escorts
High Class Call Girls Nagpur Grishma Call 7001035870 Meet With Nagpur Escortsranjana rawat
 

Recently uploaded (20)

Commercial Bank Economic Capsule - April 2024
Commercial Bank Economic Capsule - April 2024Commercial Bank Economic Capsule - April 2024
Commercial Bank Economic Capsule - April 2024
 
Call Girls Service Nagpur Maya Call 7001035870 Meet With Nagpur Escorts
Call Girls Service Nagpur Maya Call 7001035870 Meet With Nagpur EscortsCall Girls Service Nagpur Maya Call 7001035870 Meet With Nagpur Escorts
Call Girls Service Nagpur Maya Call 7001035870 Meet With Nagpur Escorts
 
OAT_RI_Ep19 WeighingTheRisks_Apr24_TheYellowMetal.pptx
OAT_RI_Ep19 WeighingTheRisks_Apr24_TheYellowMetal.pptxOAT_RI_Ep19 WeighingTheRisks_Apr24_TheYellowMetal.pptx
OAT_RI_Ep19 WeighingTheRisks_Apr24_TheYellowMetal.pptx
 
call girls in Nand Nagri (DELHI) 🔝 >༒9953330565🔝 genuine Escort Service 🔝✔️✔️
call girls in  Nand Nagri (DELHI) 🔝 >༒9953330565🔝 genuine Escort Service 🔝✔️✔️call girls in  Nand Nagri (DELHI) 🔝 >༒9953330565🔝 genuine Escort Service 🔝✔️✔️
call girls in Nand Nagri (DELHI) 🔝 >༒9953330565🔝 genuine Escort Service 🔝✔️✔️
 
Classical Theory of Macroeconomics by Adam Smith
Classical Theory of Macroeconomics by Adam SmithClassical Theory of Macroeconomics by Adam Smith
Classical Theory of Macroeconomics by Adam Smith
 
Independent Lucknow Call Girls 8923113531WhatsApp Lucknow Call Girls make you...
Independent Lucknow Call Girls 8923113531WhatsApp Lucknow Call Girls make you...Independent Lucknow Call Girls 8923113531WhatsApp Lucknow Call Girls make you...
Independent Lucknow Call Girls 8923113531WhatsApp Lucknow Call Girls make you...
 
Q3 2024 Earnings Conference Call and Webcast Slides
Q3 2024 Earnings Conference Call and Webcast SlidesQ3 2024 Earnings Conference Call and Webcast Slides
Q3 2024 Earnings Conference Call and Webcast Slides
 
fca-bsps-decision-letter-redacted (1).pdf
fca-bsps-decision-letter-redacted (1).pdffca-bsps-decision-letter-redacted (1).pdf
fca-bsps-decision-letter-redacted (1).pdf
 
VIP Call Girls Service Dilsukhnagar Hyderabad Call +91-8250192130
VIP Call Girls Service Dilsukhnagar Hyderabad Call +91-8250192130VIP Call Girls Service Dilsukhnagar Hyderabad Call +91-8250192130
VIP Call Girls Service Dilsukhnagar Hyderabad Call +91-8250192130
 
Andheri Call Girls In 9825968104 Mumbai Hot Models
Andheri Call Girls In 9825968104 Mumbai Hot ModelsAndheri Call Girls In 9825968104 Mumbai Hot Models
Andheri Call Girls In 9825968104 Mumbai Hot Models
 
VIP Kolkata Call Girl Serampore 👉 8250192130 Available With Room
VIP Kolkata Call Girl Serampore 👉 8250192130  Available With RoomVIP Kolkata Call Girl Serampore 👉 8250192130  Available With Room
VIP Kolkata Call Girl Serampore 👉 8250192130 Available With Room
 
Russian Call Girls In Gtb Nagar (Delhi) 9711199012 💋✔💕😘 Naughty Call Girls Se...
Russian Call Girls In Gtb Nagar (Delhi) 9711199012 💋✔💕😘 Naughty Call Girls Se...Russian Call Girls In Gtb Nagar (Delhi) 9711199012 💋✔💕😘 Naughty Call Girls Se...
Russian Call Girls In Gtb Nagar (Delhi) 9711199012 💋✔💕😘 Naughty Call Girls Se...
 
Chapter 2.ppt of macroeconomics by mankiw 9th edition
Chapter 2.ppt of macroeconomics by mankiw 9th editionChapter 2.ppt of macroeconomics by mankiw 9th edition
Chapter 2.ppt of macroeconomics by mankiw 9th edition
 
VIP Call Girls Service Begumpet Hyderabad Call +91-8250192130
VIP Call Girls Service Begumpet Hyderabad Call +91-8250192130VIP Call Girls Service Begumpet Hyderabad Call +91-8250192130
VIP Call Girls Service Begumpet Hyderabad Call +91-8250192130
 
House of Commons ; CDC schemes overview document
House of Commons ; CDC schemes overview documentHouse of Commons ; CDC schemes overview document
House of Commons ; CDC schemes overview document
 
Monthly Economic Monitoring of Ukraine No 231, April 2024
Monthly Economic Monitoring of Ukraine No 231, April 2024Monthly Economic Monitoring of Ukraine No 231, April 2024
Monthly Economic Monitoring of Ukraine No 231, April 2024
 
🔝9953056974 🔝Call Girls In Dwarka Escort Service Delhi NCR
🔝9953056974 🔝Call Girls In Dwarka Escort Service Delhi NCR🔝9953056974 🔝Call Girls In Dwarka Escort Service Delhi NCR
🔝9953056974 🔝Call Girls In Dwarka Escort Service Delhi NCR
 
Stock Market Brief Deck for 4/24/24 .pdf
Stock Market Brief Deck for 4/24/24 .pdfStock Market Brief Deck for 4/24/24 .pdf
Stock Market Brief Deck for 4/24/24 .pdf
 
Malad Call Girl in Services 9892124323 | ₹,4500 With Room Free Delivery
Malad Call Girl in Services  9892124323 | ₹,4500 With Room Free DeliveryMalad Call Girl in Services  9892124323 | ₹,4500 With Room Free Delivery
Malad Call Girl in Services 9892124323 | ₹,4500 With Room Free Delivery
 
High Class Call Girls Nagpur Grishma Call 7001035870 Meet With Nagpur Escorts
High Class Call Girls Nagpur Grishma Call 7001035870 Meet With Nagpur EscortsHigh Class Call Girls Nagpur Grishma Call 7001035870 Meet With Nagpur Escorts
High Class Call Girls Nagpur Grishma Call 7001035870 Meet With Nagpur Escorts
 

Shell Q1 2008 Qra

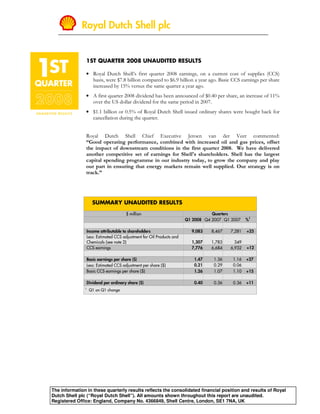
  • 1. Royal Dutch Shell plc 1ST QUARTER 2008 UNAUDITED RESULTS • Royal Dutch Shell’s first quarter 2008 earnings, on a current cost of supplies (CCS) basis, were $7.8 billion compared to $6.9 billion a year ago. Basic CCS earnings per share increased by 15% versus the same quarter a year ago. • A first quarter 2008 dividend has been announced of $0.40 per share, an increase of 11% over the US dollar dividend for the same period in 2007. • $1.1 billion or 0.5% of Royal Dutch Shell issued ordinary shares were bought back for cancellation during the quarter. Royal Dutch Shell Chief Executive Jeroen van der Veer commented: “Good operating performance, combined with increased oil and gas prices, offset the impact of downstream conditions in the first quarter 2008. We have delivered another competitive set of earnings for Shell's shareholders. Shell has the largest capital spending programme in our industry today, to grow the company and play our part in ensuring that energy markets remain well supplied. Our strategy is on track.” SUMMARY UNAUDITED RESULTS $ million Quarters %1 Q1 2008 Q4 2007 Q1 2007 8,467 7,281 Income attributable to shareholders 9,083 +25 Less: Estimated CCS adjustment for Oil Products and Chemicals (see note 2) 1,783 349 1,307 CCS earnings +12 6,684 6,932 7,776 1.36 1.16 1.47 +27 Basic earnings per share ($) 0.29 0.06 0.21 Less: Estimated CCS adjustment per share ($) Basic CCS earnings per share ($) 1.07 1.10 1.26 +15 0.36 0.36 Dividend per ordinary share ($) 0.40 +11 1 Q1 on Q1 change The information in these quarterly results reflects the consolidated financial position and results of Royal Dutch Shell plc (“Royal Dutch Shell”). All amounts shown throughout this report are unaudited. Registered Office: England, Company No. 4366849, Shell Centre, London, SE1 7NA, UK
  • 2. Royal Dutch Shell plc 2 KEY FEATURES OF THE FIRST QUARTER 2008 • First quarter 2008 CCS earnings were $7,776 million or 12% higher than in the same quarter a year ago. • First quarter 2008 reported income was $9,083 million or 25% higher than in the same quarter a year ago. • Basic CCS earnings per share increased by 15% versus the same quarter a year ago. • Total cash returned to shareholders in the form of dividends and share repurchases in the first quarter 2008 was $3.4 billion. • Cash flow from operating activities was $16.9 billion compared to $11.2 billion in the first quarter 2007. Excluding net working capital movements, cash flow from operating activities was $14.1 billion compared to $11.6 billion a year ago. • Capital investment for the first quarter 2008 was $8.1 billion. Net capital investment (capital investment, less divestment proceeds) for the first quarter 2008 was $7.6 billion. • Return on average capital employed (ROACE), on a reported income basis (see note 3), was 24.5%. • Gearing (see note 5) was 12.7% at the end of the first quarter 2008 versus 14.6% at the end of the first quarter 2007. • Oil and gas production, including oil sands production, for the first quarter 2008 was 3,522 thousand barrels of oil equivalent per day (boe/d), compared to 3,509 thousand boe/d in the same quarter last year. Excluding the impact of divestments, Canadian royalty changes and production sharing contracts (PSC) pricing effects, first quarter 2008 production increased by 1% compared to the same quarter last year. • Liquefied Natural Gas (LNG) equity sales volumes of 3.51 million tonnes were a record and 6% higher than in the same quarter a year ago. • Oil Products refinery availability increased to 92% compared to 85% in the first quarter of 2007. Chemicals manufacturing plant availability was 95% compared to 91% in the first quarter 2007. Oil Sands upgrader availability was 94%, compared to 93% in the same quarter last year. • Oil Products sales volumes in the first quarter 2008 increased by 7% compared to the same quarter last year. Chemical product sales volumes decreased by 2% compared to the first quarter 2007. SUMMARY UNAUDITED RESULTS $ million Quarters Q1 2008 Q4 2007 Q1 2007 %1 Exploration & Production2 4,867 3,393 5,143 Gas & Power 631 803 948 Oil Sands2 82 115 249 Oil Products (CCS basis) 876 1,488 1,194 Chemicals (CCS basis) 348 480 201 Corporate (4) 801 146 Minority interest (116) (148) (105) 6,684 6,932 +12 CCS earnings 7,776 1 Q1 on Q1 change 2 As from the fourth quarter 2007, the earnings of the Oil Sands operations, which were previously reported as part of the Exploration & Production segment, are disclosed as a separate business segment. For comparison purposes, the Exploration & Production earnings up to the third quarter 2007 have been reclassified by the amounts reported under the Oil Sands segment.
  • 3. Royal Dutch Shell plc 3 SUMMARY OF IDENTIFIED ITEMS Earnings in the first quarter 2008 reflected the following items, which in aggregate amounted to a net charge of $77 million (compared to a net gain of $371 million in the first quarter 2007), as summarised in the table below: • Exploration & Production earnings included a net charge of $66 million, reflecting a gain from divestments of $84 million, which was offset by a charge of $150 million related to the mark-to- market valuation of certain UK gas contracts. Earnings for the first quarter 2007 included a net gain of $104 million reflecting both a gain from divestments of $126 million and a charge of $22 million related to the mark-to-market valuation of certain UK gas contracts. • Gas & Power earnings included a charge of $11 million related to the mark-to-market valuation impact of certain gas contracts. Earnings for the first quarter 2007 included a net gain of $39 million, reflecting gains of $110 million related to divestments and a charge of $71 million related to the mark- to-market valuation of certain gas contracts. • Oil Products earnings for the first quarter 2007 included a charge of $176 million related to impairment of certain assets. • Corporate earnings for the first quarter 2007 included a gain of $404 million related to the realisation of gains on the sale of the equity portfolio held by Shell insurance companies. SUMMARY OF IDENTIFIED ITEMS $ million Quarters Q4 2007 Q1 2007 Q1 2008 Segment earnings impact of identified items: 715 104 (66) Exploration & Production (7) 39 (11) Gas & Power 94 - - Oil Sands 177 (176) - Oil Products (CCS basis) (46) - - Chemicals (CCS basis) 30 404 - Corporate - - - Minority interest 963 371 CCS earnings impact (77) These items generally relate to events with an impact of greater than $50 million on Shell earnings and are shown to provide additional insight into the segment earnings, CCS earnings and income attributable to shareholders. Further additional comments on the business segments are provided in the section ‘Earnings by business segment’ on page 4 and onwards.
  • 4. Royal Dutch Shell plc 4 EARNINGS BY BUSINESS SEGMENT EXPLORATION & PRODUCTION $ million Quarters %2 Q4 2007 Q1 2007 Q1 2008 Segment earnings 3 4,867 3,393 +52 5,143 Crude oil production (thousand b/d) 1 1,798 1,865 -6 1,756 Natural gas production available for sale (million scf/d) 9,185 8,981 +9 9,755 Barrels of oil equivalent (thousand boe/d) 1 3,381 3,413 +1 3,438 1 Excludes oil sands bitumen production 2 Q1 on Q1 change 3 As from the fourth quarter 2007, the earnings of the Oil Sands operations, which were previously reported as part of the Exploration & Production segment, are disclosed as a separate business segment. For comparison purposes, the Exploration & Production earnings up to the third quarter 2007 have been reclassified by the amounts reported under the Oil Sands segment. First quarter Exploration & Production segment earnings were $5,143 million compared to $3,393 million a year ago. Earnings included a net charge of $66 million related to identified items, compared to a net gain of $104 million in the first quarter 2007 (see page 3 for details). Earnings, when compared to the first quarter 2007, reflected higher gas production volumes and the benefit of higher oil and gas prices on revenues, which were partly offset by lower oil production volumes mainly in the USA and Europe and by higher exploration expenses. Global liquids realisations were 66% higher than in the first quarter 2007, following marker crudes Brent and WTI increases of 67% and 69% respectively. Global gas realisations were 25% higher than a year ago. Outside the USA gas realisations increased by 24% whereas in the USA gas realisations increased by 32%. First quarter 2008 production (excluding oil sands bitumen production) was 3,438 thousand barrels of oil equivalent per day (boe/d) compared to 3,413 thousand boe/d a year ago. Crude oil production was down 6% and natural gas production was up 9% compared to the first quarter 2007. Production compared to the first quarter 2007 included additional volumes principally from Ormen Lange (Shell share 17%) in Norway, West Salym (Shell share 50%) in Russia, Changbei (Shell share 50%) in China, Deimos (Shell share 71.5%) in the USA, Stybarrow (indirect Shell share 17.1%) in Australia, Chipmunk, Cliffdale and Orion (Shell share 100%) in Canada and Starling (Shell share 28%) in the United Kingdom. First quarter portfolio developments In Australia, Shell reached an agreement with Woodside for the sale of various interests in North West Shelf assets, with current production of approximately 8 thousand boe/d, for some $0.3 billion. In the USA, Shell was awarded 141 blocks and was the apparent high bidder on another 134 blocks, with high bids totalling $2.1 billion, offshore Alaska in the Chukchi Sea. In Kazakhstan, the international members of the Kashagan consortium agreed to sell their participating interests proportionally, allowing KazMunaiGas’s stake to increase to match that of the four major shareholders. Assuming conclusion of the deal, Shell’s interest will change from 18.5% to 16.8%. In Nigeria, Shell reached an agreement, amounting to some $0.6 billion, for the sale of offshore deepwater blocks OML 134 and OML 125, with current production of approximately 7 thousand boe/d.
  • 5. Royal Dutch Shell plc 5 GAS & POWER $ million Quarters %1 Q4 2007 Q1 2007 Q1 2008 631 803 948 +18 Segment earnings Equity LNG sales volume (million tonnes) 3.34 3.30 3.51 +6 1 Q1 on Q1 change First quarter Gas & Power segment earnings were $948 million compared to $803 million a year ago. First quarter 2008 earnings included a charge of $11 million related to an identified item, compared to a net gain of $39 million in the first quarter 2007 (see page 3 for details). Earnings, when compared to the first quarter 2007, reflected strong LNG and gas to liquids (GTL) product prices, increased LNG volumes, higher income from LNG cargo diversion opportunities and continued strong operational performance. LNG equity sales volumes of 3.51 million tonnes were 6% higher than in the same quarter a year ago. Sales were higher in all five operating LNG ventures, with the largest increase coming from Nigeria LNG (Shell interest 26%). Marketing and trading earnings, non-LNG related, were similar to the same quarter a year ago. First quarter portfolio developments In China, during the first quarter, binding sales and purchase agreements were progressed with Qatargas 4 and PetroChina, leading to the long-term supply of LNG from Qatar to China, totalling 3 million tonnes per annum over 25 years. Agreements were signed on April 10, 2008. OIL SANDS $ million Quarters %1 Q1 2008 Q4 2007 Q1 2007 82 115 +117 249 Segment earnings Bitumen production (thousand b/d) 55 96 -13 84 Sales volumes (thousand b/d) 97 142 144 +1 Upgrader availability (%) 79 93 94 1 Q1 on Q1 change First quarter Oil Sands segment earnings were $249 million compared to $115 million in the same quarter last year. Earnings, when compared to the first quarter 2007, reflected the impact of higher oil prices on revenues and a refund of royalty charges, which were partly offset by lower production volumes and higher costs.
  • 6. Royal Dutch Shell plc 6 The royalty calculation methodology applicable to the Athabasca Oil Sands Project (AOSP) was revised during the quarter, allowing the inclusion of additional eligible costs to the project. Due to this revision the project cost payout timeframe for royalty calculation purposes was extended beyond July 2007 when payout of the project was initially achieved. The royalty rate for the project was revised back to 1% (from 25% since July 2007) until achievement of the project cost payout. As a consequence, the adjustment related to prior quarters' bitumen production had an impact of 12 thousand barrels per day on the first quarter 2008. Bitumen production decreased by 13% compared to the same quarter last year. Excluding the effect of the royalty revision, net production decreased by 25% due to operational issues at the mine related to extreme cold weather conditions and unplanned maintenance at the Scotford Upgrader. Upgrader availability increased to 94% compared to 93% in the first quarter 2007. OIL PRODUCTS $ million Quarters %1 Q1 2008 Q4 2007 Q1 2007 2,556 1,802 Segment earnings 2,367 Less: Estimated CCS adjustment (see note 2) 1,680 314 1,173 Segment CCS earnings 876 1,488 1,194 -20 Refinery intake (thousand b/d) 3,812 3,608 3,694 +2 Total Oil Products sales (thousand b/d) 6,842 6,406 6,831 +7 Refinery availability (%) 94 85 92 1 Q1 on Q1 change First quarter Oil Products segment earnings were $2,367 million compared to $1,802 million for the same period last year. First quarter Oil Products CCS segment earnings were $1,194 million compared to $1,488 million in the first quarter 2007. Earnings for the first quarter 2007 included a charge of $176 million related to identified items (see page 3 for details). CCS earnings, when compared to the first quarter 2007, were mainly impacted by lower realised refining margins and higher operating costs, which were partly offset by higher marketing margins. In addition, trading contributions increased compared to those in the first quarter 2007. Industry refining margins declined worldwide compared to the same period a year ago. Refinery availability increased to 92% compared to 85% in the first quarter of 2007 mainly due to lower planned maintenance activities. Marketing earnings, compared to the same period a year ago, increased mainly due to higher retail, B2B and finished lubricants margins, which were partly offset by lower lubricants base oil margins. Oil Products (marketing and trading) sales volumes increased by 7% compared to the same quarter last year. Marketing sales volumes were 1% higher than in the first quarter 2007 and excluding the impact of divestments 2% higher mainly because of increased aviation and retail sales. First quarter portfolio developments In France, on March 31, 2008, Shell concluded the sale of the Petit Couronne and Reichstett Vendenheim refineries, with a combined capacity of some 220 thousand barrels per day. Also in France, on April 1, 2008, Shell concluded the sale of the Berre-l’Etang refining and petrochemical complex, with a refining capacity of 80 thousand barrels per day. The combined cash proceeds expected from the above-mentioned sales amount to approximately $1.8 billion, which will be received after the end of the first quarter 2008.
  • 7. Royal Dutch Shell plc 7 CHEMICALS $ million Quarters %1 Q1 2008 Q4 2007 Q1 2007 501 527 348 Segment earnings Less: Estimated CCS adjustment (see note 2) 153 47 147 Segment CCS earnings 348 480 -58 201 Sales volumes (thousand tonnes) 5,633 5,567 5,459 -2 Manufacturing plant availability (%) 93 91 95 1 Q1 on Q1 change First quarter Chemicals segment earnings were $348 million compared to $527 million for the same period last year. First quarter Chemicals CCS segment earnings were $201 million compared to $480 million in the same quarter last year. CCS earnings, when compared to the first quarter 2007, reflected lower margins, higher operating costs and lower income from equity-accounted investments. In addition, earnings were impacted by reduced trading contributions. Chemicals manufacturing plant availability increased to 95%, some 4 percent-points higher than in the first quarter 2007. CORPORATE $ million Quarters Q4 2007 Q1 2007 Q1 2008 (4) 801 Segment earnings 146 First quarter Corporate segment earnings were $146 million compared to $801 million for the same period last year. Earnings for the first quarter 2007 included a gain of $404 million related to an identified item (see page 3 for details). Earnings, when compared to the first quarter 2007, reflected lower interest income and currency exchange rate results, reduced tax credits and higher shareholder costs.
  • 8. Royal Dutch Shell plc 8 PRICE AND MARGIN INFORMATION OIL & GAS Quarters Q4 2007 Q1 2007 Q1 2008 Realised oil prices – Exploration & Production1 (period average) $/bbl WOUSA 82.11 55.27 90.40 USA 88.92 51.91 92.55 Global 82.96 54.73 90.72 Realised oil prices – Oil Sands $/bbl (period average) Canada 71.45 51.02 85.08 $/thousand scf Realised gas prices (period average) Europe 8.15 7.84 9.00 WOUSA (including Europe) 5.64 4.71 5.85 USA 7.45 7.20 9.52 Global 6.00 5.21 6.52 Oil and gas marker industry prices (period average) Brent ($/bbl) 88.35 57.76 96.66 58.05 WTI ($/bbl) 90.47 97.86 57.84 Edmonton Par ($/bbl) 89.00 97.91 7.15 Henry Hub ($/MMBtu) 6.93 8.55 22.31 UK National Balancing Point (pence/therm) 46.86 53.05 Japanese Crude Cocktail – JCC ($/bbl)2 57.56 82.80 91.15 REFINING & CRACKER INDUSTRY MARGINS3 Quarters Q4 2007 Q1 2007 Q1 2008 $/bbl Refining marker industry gross margins (period average) ANS US West Coast coking margin 10.60 22.16 8.75 12.87 WTS US Gulf Coast coking margin 9.65 8.70 3.70 Rotterdam Brent complex 4.35 3.55 3.06 Singapore 80/20 Arab light/Tapis complex 1.95 1.80 $/tonne Cracker industry margins (period average) US Ethane 334.00 332.00 261.00 525.00 Western Europe naphtha 279.00 411.00 14.00 518.00 North East Asia naphtha 117.00 1 As from the fourth quarter 2007, the Oil Sands operations, which were previously reported as part of the Exploration & Production segment, are disclosed as a separate business segment. For comparison purposes, the Exploration & Production realised oil prices up to the third quarter 2007 have been reclassified. 2 JCC prices for the first quarter are based on available market data up to the end of January 2008. Prices for this period will be updated when full market data is available. 3 The refining and cracker industry margins shown above do not represent actual Shell realised margins for the periods. These are estimated industry margins based on available market information at the end of the quarter.
  • 9. Royal Dutch Shell plc 9 OIL & GAS – OPERATIONAL DATA Quarters %1 Q4 2007 Q1 2007 Q1 2008 thousand b/d Crude oil production Europe 395 447 416 Africa 352 339 322 Asia Pacific 227 231 208 Middle East, Russia, CIS 438 422 428 USA 310 343 301 Other Western Hemisphere 76 83 81 Total crude oil production excluding oil sands 1,798 1,865 -6 1,756 Bitumen production – oil sands 55 96 84 Total crude oil production including oil sands 1,853 1,961 -6 1,840 million scf/d2 Natural gas production available for sale Europe 4,569 4,110 4,894 Africa 594 519 619 Asia Pacific 2,166 2,455 2,438 Middle East, Russia, CIS 239 260 232 USA 1,138 1,162 1,105 Other Western Hemisphere 479 475 467 9,185 8,981 +9 9,755 thousand boe/d3 Total production in barrels of oil equivalent Europe 1,183 1,156 1,260 Africa 454 428 429 Asia Pacific 600 654 628 Middle East, Russia, CIS 479 467 468 USA 506 543 492 Other Western Hemisphere 159 165 161 Total production excluding oil sands 3,381 3,413 +1 3,438 Bitumen production – oil sands 55 96 84 Total production including oil sands 3,436 3,509 0 3,522 1 Q1 on Q1 change 2 scf/d = standard cubic feet per day; 1 standard cubic foot = 0.0283 cubic metre 3 Natural gas converted to oil equivalent at 5.8 million scf/d = thousand boe/d
  • 10. Royal Dutch Shell plc 10 OIL PRODUCTS AND CHEMICALS – OPERATIONAL DATA Quarters Q1 2007 %1 Q4 2007 Q1 2008 thousand b/d Refinery processing intake Europe 1,803 1,590 1,741 Other Eastern Hemisphere 821 759 756 USA 869 893 845 Other Western Hemisphere 319 366 352 3,812 3,608 +2 3,694 Oil sales Gasolines 2,051 2,263 2,083 Kerosenes 802 720 814 Gas/diesel oils 2,429 2,114 2,337 Fuel oil 769 679 839 Other products 791 630 758 6,842 6,406 +7 Total oil products * 6,831 *Comprising: Europe 1,983 1,832 1,959 Other Eastern Hemisphere 1,369 1,245 1,245 USA 1,485 1,401 1,396 Other Western Hemisphere 678 653 755 Export sales 1,327 1,275 1,476 Chemical sales volumes by main product category 2** thousand tonnes Base chemicals 3,164 3,280 3,119 First-line derivatives 2,467 2,282 2,338 Other 2 5 2 5,633 5,567 -2 5,459 **Comprising: Europe 2,190 2,273 2,289 Other Eastern Hemisphere 1,457 1,253 1,228 USA 1,802 1,871 1,784 Other Western Hemisphere 184 170 158 1 Q1 on Q1 change 2 Excluding volumes sold by equity-accounted investments, chemical feedstock trading and by-products.
  • 11. Royal Dutch Shell plc 11 NOTE All amounts shown throughout this Report are unaudited. Second quarter results are expected to be announced on July 31, 2008 and third quarter results are expected to be announced on October 30, 2008. In this document “Shell”, “Shell group” and “Royal Dutch Shell” are sometimes used for convenience where references are made to Royal Dutch Shell and its subsidiaries in general. Likewise, the words “we”, “us” and “our” are also used to refer to subsidiaries in general or to those who work for them. These expressions are also used where no useful purpose is served by identifying the particular company or companies. ‘‘Subsidiaries’’, “Shell subsidiaries” and “Shell companies” as used in this document refer to companies in which Royal Dutch Shell either directly or indirectly has control, by having either a majority of the voting rights or the right to exercise a controlling influence. The companies in which Shell has significant influence but not control are referred to as “associated companies” or “associates” and companies in which Shell has joint control are referred to as “jointly controlled entities”. In this document, associates and jointly controlled entities are also referred to as “equity- accounted investments”. This document contains forward-looking statements concerning the financial condition, results of operations and businesses of Royal Dutch Shell. All statements other than statements of historical fact are, or may be deemed to be, forward-looking statements. Forward-looking statements are statements of future expectations that are based on management’s current expectations and assumptions and involve known and unknown risks and uncertainties that could cause actual results, performance or events to differ materially from those expressed or implied in these statements. Forward-looking statements include, among other things, statements concerning the potential exposure of Royal Dutch Shell to market risks and statements expressing management’s expectations, beliefs, estimates, forecasts, projections and assumptions. These forward-looking statements are identified by their use of terms and phrases such as “anticipate”, “believe”, “could”, “estimate”, “expect”, “intend”, “may”, “plan”, “objectives”, “outlook”, “probably”, “project”, “will”, “seek”, “target”, “risks”, “goals”, “should” and similar terms and phrases. There are a number of factors that could affect the future operations of Royal Dutch Shell and could cause those results to differ materially from those expressed in the forward-looking statements included in this document, including (without limitation): (a) price fluctuations in crude oil and natural gas; (b) changes in demand for Shell’s products; (c) currency fluctuations; (d) drilling and production results; (e) reserve estimates; (f) loss of market and industry competition; (g) environmental and physical risks; (h) risks associated with the identification of suitable potential acquisition properties and targets, and successful negotiation and completion of such transactions; (i) the risk of doing business in developing countries and countries subject to international sanctions; (j) legislative, fiscal and regulatory developments including potential litigation and regulatory effects arising from recategorisation of reserves; (k) economic and financial market conditions in various countries and regions; (l) political risks, including the risks of expropriation and renegotiation of the terms of contracts with governmental entities, delays or advancements in the approval of projects and delays in the reimbursement for shared costs; and (m) changes in trading conditions. All forward-looking statements contained in this document are expressly qualified in their entirety by the cautionary statements contained or referred to in this section. Readers should not place undue reliance on forward-looking statements. Each forward-looking statement speaks only as of the date of this document, April 29, 2008. Neither Royal Dutch Shell nor any of its subsidiaries undertake any obligation to publicly update or revise any forward-looking statement as a result of new information, future events or other information. In light of these risks, results could differ materially from those stated, implied or inferred from the forward-looking statements contained in this document. Please refer to the Annual Report and Form 20-F for the year ended December 31, 2007 for a description of certain important factors, risks and uncertainties that may affect Shell's businesses. Cautionary Note to US Investors: The United States Securities and Exchange Commission (SEC) permits oil and gas companies, in their filings with the SEC, to disclose only proved reserves that a company has demonstrated by actual production or conclusive formation tests to be economically and legally producible under existing economic and operating conditions. We may use certain terms in this announcement that the SEC's guidelines strictly prohibit us from including in filings with the SEC. US Investors are urged to consider closely the disclosure in our Form 20-F, File No 001-32575 and disclosure in our Forms 6-K, File No 001-32575, available on the SEC’s website www.sec.gov. You can also obtain these forms from the SEC by calling 1-800-SEC-0330. April 29, 2008
  • 12. -12- APPENDIX: ROYAL DUTCH SHELL FINANCIAL REPORT AND TABLES SUMMARISED STATEMENT OF INCOME (SEE NOTE 1) $ million Quarters Q1 2008 Q4 2007 Q1 2007 %1 Revenue2 114,302 106,703 73,480 Cost of sales 90,603 60,666 96,780 16,100 12,814 +37 Gross profit 17,522 Selling, distribution and administrative expenses 4,880 3,778 3,969 Exploration 382 272 325 Share of profit of equity-accounted investments 2,376 1,808 2,425 Net finance costs and other (income)/expense (174) (901) (53) 13,388 11,473 +37 Income before taxation 15,706 Taxation 4,755 4,032 6,505 8,633 7,441 +24 Income for the period 9,201 Income attributable to minority interest 166 160 118 8,467 7,281 +25 Income attributable to shareholders 9,083 1 Q1 on Q1 change 2 Revenue is stated after deducting sales taxes, excise duties and similar levies of $22,920 million in Q1 2008, $21,552 million in Q4 2007, and $17,305 million in Q1 2007. BASIC EARNINGS PER SHARE (SEE NOTES 1, 2 AND 7) Quarters Q4 2007 Q1 2007 Q1 2008 Earnings per share ($) 1.36 1.16 1.47 CCS earnings per share ($) 1.07 1.10 1.26 DILUTED EARNINGS PER SHARE (SEE NOTES 1, 2 AND 7) Quarters Q4 2007 Q1 2007 Q1 2008 Earnings per share ($) 1.36 1.15 1.46 CCS earnings per share ($) 1.07 1.10 1.25
  • 13. -13- EARNINGS BY BUSINESS SEGMENT (SEE NOTES 2 AND 4) $ million Quarters %1 Q4 2007 Q1 2007 Q1 2008 Exploration & Production2: - World outside USA 3,763 2,541 +39 3,540 - USA 1,104 852 +88 1,603 4,867 3,393 +52 5,143 Gas & Power: - World outside USA 639 682 +37 933 - USA (8) 121 -88 15 631 803 +18 948 Oil Sands2: 82 115 +117 249 Oil Products (CCS basis): - World outside USA 789 1,158 -16 978 - USA 87 330 -35 216 876 1,488 -20 1,194 Chemicals (CCS basis): - World outside USA 370 469 -35 304 - USA (22) 11 (103) 348 480 -58 201 6,804 6,279 +23 Total operating segments 7,735 Corporate: - Interest and investment income/(expense) 12 583 110 - Currency exchange gains/(losses) 82 46 (62) - Other - including taxation (98) 172 98 (4) 801 146 (116) (148) Minority interest (105) 6,684 6,932 +12 CCS earnings 7,776 Estimated CCS adjustment for Oil Products and Chemicals 1,783 349 1,307 8,467 7,281 +25 Income attributable to shareholders of Royal Dutch Shell plc 9,083 1 Q1 on Q1 change 2 As from the fourth quarter 2007, the earnings of the Oil Sands operations, which were previously reported as part of the Exploration & Production segment, are disclosed as a separate business segment. For comparison purposes, the Exploration & Production earnings up to the third quarter 2007 have been reclassified by the amounts reported under the Oil Sands segment.
  • 14. -14- SUMMARISED BALANCE SHEET (SEE NOTES 1 AND 6) $ million Dec 31, 2007 Mar 31, 2007 Mar 31, 2008 Assets Non-current assets: Intangible assets 5,366 5,117 5,282 Property, plant and equipment 101,521 103,624 105,806 Investments: - equity-accounted investments 29,153 22,001 31,198 - financial assets 3,461 3,538 3,333 Deferred tax 3,253 3,135 3,409 Pre-paid pension costs 5,559 4,289 5,878 Other 5,760 5,285 6,406 154,073 146,989 161,312 Current assets: Inventories 31,503 23,960 32,184 Accounts receivable 74,238 58,998 87,507 Cash and cash equivalents 9,656 11,184 14,417 115,397 94,142 134,108 269,470 241,131 Total assets 295,420 Liabilities Non-current liabilities: Debt 12,363 11,978 11,378 Deferred tax 13,039 13,114 13,473 Retirement benefit obligations 6,165 6,219 6,304 Other provisions 13,658 10,514 14,016 Other 3,893 4,154 4,189 49,118 45,979 49,360 Current liabilities: Debt 5,736 5,393 5,684 Accounts payable and accrued liabilities 75,697 64,156 89,531 Taxes payable 9,733 9,835 14,412 Retirement benefit obligations 426 326 455 Other provisions 2,792 1,932 2,815 94,384 81,642 112,897 143,502 127,621 Total liabilities 162,257 123,960 105,105 Equity attributable to shareholders of Royal Dutch Shell plc 131,130 Minority interest 2,008 8,405 2,033 125,968 113,510 Total equity 133,163 269,470 241,131 Total liabilities and equity 295,420
  • 15. -15- SUMMARISED STATEMENT OF CASH FLOWS (SEE NOTE 1) Quarters $ million Q4 2007 Q1 2007 Q1 2008 Cash flow from operating activities: 8,633 7,441 Income for the period 9,201 Adjustment for: - Current taxation 5,551 4,267 6,405 - Interest (income)/expense 96 198 178 - Depreciation, depletion and amortisation 3,840 3,260 3,146 - (Profit)/loss on sale of assets (1,799) (362) (281) - Decrease/(increase) in net working capital (3,375) (399) 2,784 - Share of profit of equity-accounted investments (2,376) (1,808) (2,425) - Dividends received from equity-accounted investments 2,282 1,587 1,752 - Deferred taxation and other provisions (726) (152) 322 - Other (24) (447) 94 Cash flow from operating activities (pre-tax) 12,102 13,585 21,176 Taxation paid (6,809) (2,404) (4,314) 5,293 11,181 Cash flow from operating activities 16,862 Cash flow from investing activities: Capital expenditure (8,013) (5,361) (7,429) Investments in equity-accounted investments (519) (370) (616) Proceeds from sale of assets 1,742 380 445 Proceeds from sale of equity-accounted investments 561 115 61 Proceeds from sale of /(additions to) financial assets (120) 555 10 Interest received 353 285 285 (5,996) (4,396) Cash flow from investing activities (7,244) Cash flow from financing activities: Net increase/(decrease) in debt with maturity period within 317 341 (863) three months Other debt: New borrowings 195 2,762 185 Repayments (182) (1,613) (664) Interest paid (312) (351) (298) Change in minority interest (52) (3,110) (7) Net issue/(repurchase) of shares (1,538) (486) (1,073) Dividends paid to: - Shareholders of Royal Dutch Shell plc (2,318) (2,100) (2,329) - Minority interest (17) (42) (51) Treasury shares: - Net sales/(purchases) and dividends received 124 (16) 200 (3,783) (4,615) Cash flow from financing activities (4,900) Currency translation differences relating to cash and cash 50 12 43 equivalents (4,436) 2,182 Increase/(decrease) in cash and cash equivalents 4,761 14,092 9,002 Cash and cash equivalents at beginning of period 9,656 9,656 11,184 Cash and cash equivalents at end of period 14,417
  • 16. -16- CAPITAL INVESTMENT $ million Quarters Q4 2007 Q1 2007 Q1 2008 Capital expenditure: Exploration & Production1: - World outside USA 2,704 2,872 2,202 - USA 1,321 587 2,530 4,025 3,459 4,732 Gas & Power: - World outside USA 862 657 823 - USA 11 1 1 873 658 824 Oil Sands1 649 368 711 Oil Products: - World outside USA 1,257 474 456 - USA 123 195 61 1,380 669 517 Chemicals: - World outside USA 419 153 374 - USA 103 83 34 522 236 408 193 45 Corporate 37 7,642 5,435 Total capital expenditure 7,229 Exploration expense - World outside USA 193 127 135 - USA 170 42 80 363 169 215 New equity in equity-accounted investments - World outside USA 237 247 365 - USA 40 17 5 277 264 370 242 106 New loans to equity-accounted investments 246 8,524 5,974 Total capital investment* 8,060 *Comprising: - Exploration & Production1 4,630 3,892 5,439 - Gas & Power 1,091 732 925 - Oil Sands1 649 368 711 - Oil Products 1,438 699 536 - Chemicals 523 238 412 - Corporate 193 45 37 8,524 5,974 8,060 1 As from the fourth quarter 2007, the results of the Oil Sands operations, which were previously reported as part of the Exploration & Production segment, are disclosed as a separate business segment. For comparison purposes, the Exploration & Production results up to the third quarter 2007 have been reclassified by the amounts reported under the Oil Sands segment.
  • 17. -17- ADDITIONAL SEGMENTAL INFORMATION1 $ million Quarters Q4 2007 Q1 2007 Q1 2008 Exploration & Production3 Segment earnings 4,867 3,393 5,143 Including: - Exploration 382 272 325 - Depreciation, depletion & amortisation 2,848 2,288 2,165 - Share of profit of equity-accounted investments 1,278 913 1,212 Cash flow from operations 5,135 6,110 10,329 Less: Net working capital movements2 829 (1,086) 923 Cash flow from operations excluding net working capital 4,306 7,196 9,406 movements Capital employed 47,682 52,088 47,927 Gas & Power Segment earnings 631 803 948 Including: - Depreciation, depletion & amortisation 85 74 81 - Share of profit of equity-accounted investments 533 420 584 Cash flow from operations 295 587 1,917 Less: Net working capital movements2 (379) (169) 902 Cash flow from operations excluding net working capital 674 756 1,015 movements Capital employed 19,383 18,453 19,305 Oil Sands3 Segment earnings 82 115 249 Including: - Depreciation, depletion & amortisation 42 39 44 Cash flow from operations 208 486 298 Less: Net working capital movements2 145 411 (102) Cash flow from operations excluding net working capital 63 75 400 movements Capital employed 4,603 3,175 5,292 1 Corporate segment information has not been included in the above table. Please refer to the ‘Earnings by business segment’ section for additional information. The above data does not consider Minority interest impacts on the segments. 2 Excluding working capital movements related to taxation. 3 As from the fourth quarter 2007, the results of the Oil Sands operations, which were previously reported as part of the Exploration & Production segment, are disclosed as a separate business segment. For comparison purposes, the Exploration & Production results up to the third quarter 2007 have been reclassified by the amounts reported under the Oil Sands segment.
  • 18. -18- ADDITIONAL SEGMENTAL INFORMATION1 (continued) $ million Quarters Q4 2007 Q1 2007 Q1 2008 Oil Products Segment CCS earnings 876 1,488 1,194 Including: - Depreciation, depletion & amortisation 607 656 608 - Share of profit of equity-accounted investments 328 280 267 Cash flow from operations (1,605) 2,123 2,362 Less: Net working capital movements2 (3,929) (319) (435) Cash flow from operations excluding net working capital 2,324 2,442 2,797 movements Capital employed 54,515 43,716 55,768 Chemicals Segment CCS earnings 348 480 201 Including: - Depreciation, depletion & amortisation 207 155 162 - Share of profit of equity-accounted investments 165 188 158 Cash flow from operations 688 116 386 Less: Net working capital movements2 (123) (514) (9) Cash flow from operations excluding net working capital 811 630 395 movements Capital employed 10,571 9,187 11,233 1 Corporate segment information has not been included in the above table. Please refer to the ‘Earnings by business segment’ section for additional information. The above data does not consider Minority interest impacts on the segments. 2 Excluding working capital movements related to taxation.
  • 19. -19- NOTES 1. Accounting policies and basis of presentation The quarterly financial statements are prepared in accordance with International Financial Reporting Standards (IFRS) and are also in accordance with IFRS as adopted by the European Union. The Oil Sands operations, which were previously reported within the Exploration & Production segment, are reported as a separate segment with effect from the fourth quarter 2007. Prior period financial statements have been reclassified accordingly. The accounting policies are unchanged from those set out in Note 2 to the Consolidated Financial Statements of Royal Dutch Shell plc in the Annual Report and Form 20-F for the year ended December 31, 2007 on pages 117 to 121. 2. Earnings on an estimated current cost of supplies (CCS) basis To facilitate a better understanding of underlying business performance, the financial results are also analysed on an estimated current cost of supplies (CCS) basis as applied for the Oil Products and Chemicals segment earnings. Earnings on an estimated current cost of supplies basis provides useful information concerning the effect of changes in the cost of supplies on Royal Dutch Shell’s results of operations and is a measure to manage the performance of the Oil Products and Chemicals segments but is not a measure of financial performance under IFRS. On this basis, Oil Products and Chemicals segment cost of sales of the volumes sold during the period are based on the cost of supplies during the same period after making allowance for the estimated tax effect, instead of the first-in, first-out (FIFO) method of inventory accounting. Earnings calculated on this basis do not represent an application of the last-in, first-out (LIFO) inventory basis and do not reflect any inventory drawdown effects. 3. Return on average capital employed (ROACE) ROACE is defined as the sum of the current and previous three quarters’ income adjusted for interest expense, after tax, as a percentage of the average capital employed for the period. Components of the calculation are: $ million Q1 2007 Q1 2008 Income (four quarters) 26,736 33,686 Interest expense after tax 664 726 ROACE numerator 27,400 34,412 Capital employed - opening 115,503 130,881 Capital employed - closing 130,881 150,225 Capital employed - average 123,192 140,553 ROACE 22.2% 24.5% ROACE in previous quarters has been shown on a Shell share basis. As a consequence of the significant reduction of minority interest during 2007, ROACE calculations are now presented on a 100%-basis. Prior period ROACE calculations have been adjusted for comparison purposes. 4. Earnings by business segment Operating segment results are presented before deduction of minority interest and also exclude interest and other income of a non-operational nature, interest expense, non-trading currency exchange effects and tax on these items, which are included in the Corporate results. Operating segment results are after tax and include equity-accounted investments.
  • 20. -20- 5. Gearing The numerator and denominator in the gearing calculation, as demonstrated below, used by Shell are calculated by adding to reported debt and equity certain off-balance sheet obligations as at the beginning of the year such as operating lease commitments and unfunded retirement benefits (if applicable) which Shell believes to be in the nature of incremental debt, and deducting cash and cash equivalents judged to be in excess of amounts required for operational purposes. $ million Mar 31, 2007 Mar 31, 2008 Non-current debt 11,978 11,378 Current debt 5,393 5,684 Total debt 17,371 17,062 Add: Net present value of operating lease obligations 11,319 14,387 Unfunded retirement benefit obligations (after tax) - - Less: Cash and cash equivalents in excess of operational requirements 9,284 12,117 Adjusted debt 19,406 19,332 Total equity 113,510 133,163 Total capital 132,916 152,495 Gearing ratio (adjusted debt as a percentage of total capital) 14.6% 12.7% 6. Equity Total equity comprises equity attributable to shareholders of Royal Dutch Shell and to the minority interest. Other reserves comprise the capital redemption reserve, share premium reserve, merger reserve, share-based compensation reserve, cumulative currency translation differences, unrealised gains/(losses) on securities and unrealised gains/(losses) on cash flow hedges. Ordinary Treasury Other Retained Minority share $ million Total Total equity shares reserves earnings interest capital 536 (2,392) 14,148 111,668 2,008 At December 31, 2007 123,960 125,968 - - - 9,083 118 Income for the period 9,083 9,201 Income/(expense) recognised - - 1,656 - (35) 1,656 1,621 directly in equity Capital contributions/ (repayments) from/to minority - - - - (7) - (7) shareholders - - - (2,329) (51) Dividends paid (2,329) (2,380) Treasury shares: net sales/(purchases) and - 200 - - - 200 200 dividends received Shares repurchased for (2) - 2 (1,327) - (1,327) (1,327) cancellation - - (113) - - Share-based compensation (113) (113) 534 (2,192) 15,693 117,095 2,033 At March 31, 2008 131,130 133,163