
Recommended
Recommended
More Related Content
What's hot
What's hot (20)
Similar to 2010 effects of fish farming on the biological and geochemical properties of muddy
Similar to 2010 effects of fish farming on the biological and geochemical properties of muddy (20)
More from earambulm3
More from earambulm3 (20)
Recently uploaded
Recently uploaded (20)
2010 effects of fish farming on the biological and geochemical properties of muddy
- 1. Effects of fish farming on the biological and geochemical properties of muddy and sandy sediments in the Mediterranean Sea Nafsika Papageorgiou, Ioanna Kalantzi, Ioannis Karakassis * Marine Ecology Laboratory, Biology Department, University of Crete, P.O. Box 2208, GR-71409 Heraklion, Crete, Greece a r t i c l e i n f o Article history: Received 13 March 2009 Received in revised form 16 December 2009 Accepted 17 December 2009 Keywords: Organic enrichment Macrofauna Diversity Fish farming Mediterranean Sea a b s t r a c t The aim of this paper was to test how benthic fauna and biogeochemical properties of sediment will vary in response to similar levels of organic enrichment (induced by fish farming) as a function of bottom-hab- itat type (i.e., mud versus seagrass/coarse sediments), distance from the enrichment source and depth. Our results showed that samples from silty sediments in the vicinity of fish farms have higher TOC and TON values, higher oxygen consumption, higher PO4 release and lower benthic diversity. In this con- text muddy sites are more likely to be identified as impacted/critical, than coarse sediment ones. Ó 2009 Published by Elsevier Ltd. 1. Introduction The most widely documented effect of fish farming is the organ- ic enrichment of the sediment in the vicinity of the net cages (Hall et al., 1990, 1992; Holby and Hall, 1991; Holmer and Kristensen, 1992; Hargrave et al., 1993; Karakassis et al., 1998, 2002). The accumulation of organic matter changes the physical and chemical composition of the sediments and affects the composition and function of benthic communities (Brown et al., 1987; Karakassis and Hatziyanni, 2000; Karakassis et al., 2000). Previous studies in the Mediterranean showed that the severe effects of fish farming waste on macrofauna are limited to up to 25 m from the edge of the cages (Karakassis, 2001; Lampadariou et al., 2005) although the influence of carbon and nitrogen from farm effluents in sea bot- toms around 25 m deep can be detected in a wide area about 1000 m from the cages (Sara et al., 2004). The impacts on the sea- bed beneath the cages were found to range from very significant to relatively negligible depending on sediment type and the local water currents, with silty sediments having a higher potential for degradation (Karakassis, 2001). In general, the changes of the benthic community follow the succession pattern of response to organic enrichment gradient de- scribed by the Pearson and Rosenberg (1978) model. This model suggests that abundance at the start rises gradually but as the or- ganic matter load increases, abundance rises more sharply until it reaches a maximum (the ‘peak of opportunists’), then falls sharply as the oxygen concentration declines. Biomass follows the same pattern but often shows a secondary peak near, but lower than, that of maximal abundance. The maximum number of species coincides with the biomass peak. The benthic response to organic enrichment can be used as a descriptive tool for the sediment state (Gray et al., 2002) and for general monitoring purposes. Recently, the benthic state was used for the characterization of the ecological quality status (EcoQS) of water bodies in the frames of the Euro- pean Water Framework Directive (WFD; 2000/60/EC: Borja et al., 2007; Labrune et al., 2006; Muxika et al., 2007; Quintino et al., 2006; Rosenberg et al., 2004) and in general as a stress indicator of organic enrichment in broad coastal areas receiving organic wastes from human activities (Hyland et al., 2005). The response of benthic communities to organic enrichment depends on the level of the impact, the substrate biogeochemistry and the composition of benthic fauna (Gray, 2002; Hargrave et al., 2008; Pusceddu et al., 2007). There are indications that there is a different response of the biological and geochemical compart- ments of the sediment according to the sediment type (Apostolaki et al., 2007; Holmer et al., 2008; Kalantzi and Karakassis, 2006). Specific types of sea bottoms correspond to well-defined groups of species (Fresi et al., 1983) while different sediment types and organic loadings promote other ecosystem functions because of the complex relationship between benthic fauna and sediment biogeochemistry (Marinelli and Woodin, 2002; Marinelli and Wil- liams, 2003; Waldbusser et al., 2004; Tomassetti and Porrello, 2005). 0141-1136/$ - see front matter Ó 2009 Published by Elsevier Ltd. doi:10.1016/j.marenvres.2009.12.007 * Corresponding author. Address: Marine Ecology Laboratory, Department of Biology, University of Crete, P.O. Box 2208, GR-71409 Heraklion, Crete, Greece. Tel.: +30 2810 394061; fax: +30 2810 394408 E-mail address: karakassis@biology.uoc.gr (I. Karakassis). Marine Environmental Research 69 (2010) 326–336 Contents lists available at ScienceDirect Marine Environmental Research journal homepage: www.elsevier.com/locate/marenvrev
- 2. Given these differences, we planned a survey with a wide spec- trum of biogeochemical variables among different sediment types. As a testing ground we chose muddy and seagrass habitats because of the different biogeochemical characteristics and functions of these areas. Muddy habitats are usually composed of silty reduced sedi- ments with high organic loadings (Hyland et al., 2005). The macro- faunal community is composed of small organisms tolerant to organic enrichment (Pearson and Rosenberg, 1978). In such areas, respiration is performed mainly by bacteria while macrofauna con- tributes 10–30% of the total sediment respiration (Middelburg et al., 2005; Hargrave et al., 2008). On the other hand, Posidonia oceanica meadows provide impor- tant ecosystem functions and services and are important sediment modifiers (Duarte, 2002). The faunal communities in seagrass meadows have been shown to be distinctly different in comparison to those in unvegetated habitats over relatively small spatial scales (Mills and Berkenbusch, 2009). Additionally, organic detritus from P. oceanica is a relevant carbon source for species inhabiting sea- grass meadows and for those sand dwelling species living close to the meadows (Cardona et al., 2007). Fish farm wastes have ma- jor effects on the structure and functioning of P. oceanica meadows (Holmer et al., 2008) a habitat type common for the placing of coastal fish cages in Mediterranean countries (Holmer et al., 2008). The decline of P. oceanica meadows near fish farms is mainly caused by the sedimentation of organic material (Holmer et al., 2007, 2008) and to a certain extent from the direct shading of the meadows beneath the cages (Holmer et al., 2008). The aim of this study was to investigate the hypothesis that there was no difference among sediment types in the gradient pat- terns of (a) benthic macrofaunal communities, (b) concentrations of sediment geochemical variables, (c) intensity of geochemical fluxes (i.e. oxygen consumption and P mineralization). This approach allows investigating simultaneously the effects of organic enrichment on three different types of response variables which could show different response patterns to organic enrich- ment. The knowledge of this information is of importance for envi- ronmental impact assessment and site selection for marine aquaculture. 2. Materials and methods 2.1. Study area The impact of aquaculture as an organic enrichment source of marine sediments and their associated macrobenthic communities was investigated at four Mediterranean fish farms (Sounion, Sitia, Astakos, Cephalonia). The sampling areas were selected from a lar- ger group of sites in an effort to maximize variance in terms of sed- iment type, depth and exposure in the data set. The farm in Sounion is located on the mainland coast of Greece in a shallow ex- posed strait ca 300 m from shore and the net fish cages are located in 13–20 m water depth. The sediment is coarse and is mainly cov- ered with the seagrass P. oceanica, except for a bare zone extending 5–25 m from the edges of the net cages where the seagrasses are highly impacted. The fish farm in Cephalonia is located in a shel- tered, semi-closed bay which is connected with the open sea through a small opening at the southern end. The water depth at the area of the net cages is 18–20 m and the sediment is silty. The Sitia fish farm lies in north–eastern Crete. The sediment con- sists mainly of coarse to fine sand with a silt fraction covered with the seagrass P. oceanica, except for a bare zone extending 80 m from the edges of the net cages where the seagrasses are highly im- pacted. The water depth at the net cages is 14–18 m. The fourth fish farm is situated near the city of Astakos in a closed and shallow bay. The sediment near the net cages is silty and the water depth is 12–15 m. The samplings were performed during the summer sea- son of June–July 2006 (Sounion and Cephalonia) and July 2007 (Si- tia and Astakos) and in the winter season February 2007 (Sounion). 2.2. Sampling strategy The sampling stations were established under the cages (0 m) as well as at 5, 10, 25 and 50 m from the edge of the cages down- stream in the main current direction. A control site with similar depth and substrate type was established in a place not affected by the net cages and located between 400 and 1000 m away from them. Samples were collected during four sampling trips. Macrofauna samples were taken by SCUBA divers using sam- pling cores of 9.5 cm internal diameter penetrating down to 15 cm depth of sediment from the water–sediment interface. Five replicates were taken for each sampling station to determine var- iability within stations. The sediment cores from each station were brought to the laboratory, submerged in an aquarium (50 l) aerated by means of an air pump and kept at in situ temperature. Each core was equipped with a magnet and stirred by a central magnet (Hol- mer et al., 2003). The water column of each core was aerated by an air pump and initial water samples were taken. The cores were sealed with rubber stoppers and incubated for 4 h in darkness be- fore a final sample was taken from each core. Samples were ana- lyzed for oxygen (O2), and phosphate (PO3À 4 ) concentrations. Oxygen was determined by the standard Winkler technique within 4 h. Phosphate was measured spectrophotometrically using molybdenum blue reaction (modified by Murphy and Riley, 1962). Incubation experiments were performed in the dark to re- duce the effect of photosynthetic activity on nutrient and oxygen uptake as well as the effect on several other biogeochemical pro- cesses influenced by light, like nitrification (Thamdrup and Can- field, 2000). At the Sounion and Cephalonia sites, flux measurements were performed only in stations 0, 25 and Control. After the sediment flux experiments were finished, the sediment cores were sieved through a 1000 and 500 lm mesh, and the re- tained sediment containing macrofaunal organisms was preserved in 10% buffered formalin. Samples were sorted and fauna speci- mens were identified to species level where possible and counted. Macrofauna wet biomass (g mÀ2 ) was determined separately for each species and each sample. For the determination of the sediment characteristics, three replicate samples were taken from all stations by SCUBA divers using sampling cores of 4.5 cm internal diameter, which collected sample from a sediment depth of 10 cm. Redox potential (Eh) was measured at the water–sediment interface by means of an electrode standardized with Zobell’s solution (Zobell, 1946). The sediment cores were sectioned in three layers (0–1, 1–3 and 3– 5 cm) and kept frozen. For the analyses of this study we used the surface layer of the sediments (0–1 cm). An additional core for sed- iment granulometry (median grain size MD and silt – clay %) was taken from each station. Total organic carbon (TOC) and nitrogen (TON) in the sediment samples were determined by means of a Perkin Elmer 2400 CHN Elemental Analyzer according to the procedure of Tung and Tanner (2003). The separation of organic from inorganic forms of carbon followed the method reviewed in Verardo (1990). Organic material (loss on ignition, LOI) was determined as the weight loss of the dried sample after combustion for 6 h at 250 °C for labile organic matter (labOM) (Loh, 2005). Sediment contents in chlorophyll (chl-a) were determined according to the method described by Yentsch and Menzel (1963) using a Turner fluorometer (model 112) following extraction with 90% acetone. Phosphorus content (TP) in the sediment was measured according the method de- scribed by Murphy and Riley (1962) and Aspila et al. (1976). N. Papageorgiou et al. / Marine Environmental Research 69 (2010) 326–336 327
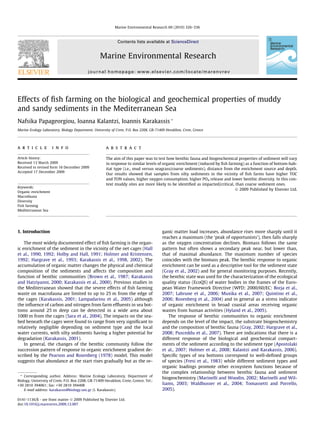
- 3. At stations 0, 25 and control, SCUBA divers deployed benthic sediment traps and retrieved them about 48 h later following the procedure of Holmer et al. (2007). The design of the traps followed that described by Gacia et al. (1999). The traps consisted of 20 ml cylindrical glass centrifugation tubes with an aspect ratio of 5 (16 mm diameter) in order to prevent internal re-suspension. 0 0.5 1 1.5 2 2.5 3 3.5 4 4.5 5 0 5 10 25 50 Control logabundance(indvm -2 ) 0 0.5 1 1.5 2 2.5 3 0 5 10 25 50 Control logbiomass(gm-2 ) 0 0.5 1 1.5 2 2.5 3 3.5 4 0 5 10 25 50 Control Shannondiversity(H') 0 0.1 0.2 0.3 0.4 0.5 0.6 0.7 0.8 0.9 1 0 5 10 25 50 Control Evenness(J') -200 -100 0 100 200 300 400 500 0 5 10 25 50 Control Redoxpotential(mV) 0 5 10 15 20 25 30 35 40 0 5 10 25 50 Control Chl-α(mg/g) 0 1 2 3 4 5 6 0 5 10 25 50 Control TON(mg/g) 0 5 10 15 20 25 30 35 0 5 10 25 50 Control TOC(mg/g) 0 10 20 30 40 50 60 0 5 10 25 50 Control labOM(mg/g) 0 1 2 3 4 5 6 0 5 10 25 50 Control TP(mg/g) -2 -1.5 -1 -0.5 0 0.5 1 1.5 2 2.5 3 3.5 0 5 10 25 50 Control PO4 -3 fluxes(μmolm -2 d -1 ) -200 -150 -100 -50 0 50 100 0 5 10 25 50 Control O2fluxes(μmolm -2 d -1 ) 0 1 2 3 4 5 6 0 5 10 25 50 Control log(Sedrates)(gm-2 d-1 ) Sounio Sitia Sounio W Cephalonia Astakos Fig. 1. Distribution of biogeochemical variables with distance from fish cages for all sites. 328 N. Papageorgiou et al. / Marine Environmental Research 69 (2010) 326–336
- 4. Two arrays, each with five replicated traps, were deployed at each position along the transects. In the laboratory, the contents of the tubes were combined and collected on a combusted, pre-weighed Whatman GF/F filter (final replication 5). Dry weight of total sedi- ment deposition was obtained after drying the filters with the sam- ples at 60 °C to constant weight. Sedimentation rates (Sed rates) were estimated according to Blomqvist and Håkanson (1981) and Hargrave and Burns (1979) as described in detail in Gacia et al. (1999). 2.3. Data analysis Diversity metrics Shannon (H0 – Shannon–Wiener’s: H0 = ÀRPilogePi) and Evenness (J0 – Pielou’s evenness: J0 ¼ H0 ðobservedÞ= H0 max) were calculated from the recorded macrofaunal species- abundance data using the PRIMER software v.6.1.5. (Plymouth Marine Laboratory, UK). One-way analysis of variance (ANOVA) was used to test for differences among stations of the same site while factorial analysis of variance was used to determine differ- ences between the habitat types and between the distances from the cages in the entire data set. Significant effects were further ana- lyzed by post hoc Tukey test for multiple comparisons between groups of samples. Spearman rank correlation analysis was carried out between all pairs of samples for 15 variables, using 11 variables (Log(sedimentation rates), Log(abundance), Log(biomass), Shan- non, Evenness, TOC, TON, labOM, Chl-a, TP and Eh as dependent variables and Ln(distance) from the farm, depth, median grain size and silt & clay percentage as independent variables. Analyses of variance and Forward Stepwise Regression Analyses were per- formed using the STATISTICA v.8.0 software (StatSoft INC). 3. Results The distribution of the geochemical and the biotic variables with distance from the fish cages in all sites is shown in Fig. 1 while tests for significance are shown in Table 1. Abundance showed no consistent pattern between the sites along the distance from the fish cages. For Sounion, Sitia and Sounion W, the abundance signif- icantly decreased in the remote stations while in the Cephalonia and Astakos sites, the abundance significantly increased with dis- tance from the cages. Biomass decreased significantly in the con- trol station of Sounion and Sitia sites but it increased significantly in Cephalonia (Fig. 1). At Astakos and Sounion W, the observed changes of biomass along the stations were not sig- nificant. The Shannon index, H0 (Fig. 1) showed the same pattern with the abundance along the distance from the cages in the differ- ent sites. Changes of J0 with distance from the fish cages at Astakos site were not significant. Redox potential had positive values across all the stations of Sounion in both seasons. At the other three sites, there was a major increase of the redox potential with distance from the cages. In the Control stations of all sites, the redox potential showed only posi- tive values. Chl-a concentration increased significantly in the sta- tions near the cages at Sitia, Cephalonia sites, whereas in the case of Astakos the change was not significant. For Sounion sta- tions, the concentration of Chl-a significantly increased at the intermediate stations. Also, in the case of the Sounion winter sam- pling showed a peak at the control station. TON decreased towards the control station at all sites. In the case of Sounion site (for both seasons), the change in TON concentration was very small between the stations and not significant for the stations of Sounion W. TOC and labOM followed the same pattern of decreasing concentration with increasing distance from the cages. TP also showed a signifi- cant decrease with distance. The sediment oxygen flux decreased towards the control sta- tion. In Cephalonia, the opposite trend was observed but with no significant difference between the stations. At a distance of 25 m at the Sounion site, the O2 fluxes showed a release from the sedi- ment to the water column. PO3À 4 fluxes showed a release from sed- iment to water at most of the stations and sites. Astakos PO3À 4 flux followed the opposite pattern in 5, 50 m distance from the cages and control station. A flow from water column to the sediment was also observed for the remote stations of Sitia and Sounion W. Sedimentation rates significantly decreased with distance from the fish cages in all sites. The results of Spearman rank correlation analysis between all variables in the data set (Table 2) showed that a number of vari- ables were significantly inter-correlated (Shannon, Evenness, TON, TOC, labOM, Chl-a, Eh, TP, PO3À 4 fluxes, O2 fluxes). From those variables, H0 and J0 diversity metrics as well as redox potential and O2 fluxes negatively correlated with the rest of the geochemical variables. Also, sedimentation rates correlated negatively with H0 and J0 measures. The results of the stepwise regression (Table 3) showed that the studied dependent variables may be determined by a combination of the examined independent variables. Most of the dependent vari- ables showed a decrease with distance (Ln distance) from the farm except for the diversity metrics (H0 , J0 ) and the Eh which had a posi- tive relationship with distance from the fish farm. Also, abundance and O2 fluxes were not influenced by the distance from the farm. Bathymetry seems to affect differently the geochemical and the bio- tic variables. While the nutrient loading variables (TON, TOC, Chl-a, TP) related positively to depth, the macrofaunal abundance (Ln[a- bu]), biomass (Ln[bms]), J0 and Eh of the sediments decreased with depth. In addition, H0 , sedimentation rate (Ln [sed rt]), O2 fluxes and PO3À 4 fluxes were not influenced by the bathymetry. Table 1 One-way ANOVA of biogeochemical variables with distance from fish cages for all sites (* p < 0.05, ** p < 0.01, *** p < 0001, ns: not significant). Area Sounion Sitia Sounion W Cephalonia Astakos Variable F Df p F Df p F Df p F Df p F Df p Log abundance 12.00 5 *** 10.96 5 *** 33.88 5 *** 5.76 5 ** 12.77 5 *** Log biomass 16.27 5 *** 19.37 5 *** 1.78 5 ns 11.76 5 *** 1.77 5 ns H0 3.35 5 * 28.38 5 *** 3.67 5 * 26.82 5 *** 16.68 5 *** J0 4.41 5 ** 30.07 5 *** 15.06 5 *** 12.99 5 *** 1.66 5 ns Eh 6.12 5 ** 244.95 5 *** 11.17 5 *** 21.72 5 *** 95.62 5 *** Chl-a 4.79 5 * 4.38 5 * 12.43 5 *** 4.81 5 * 2.25 5 ns TON 4.15 5 * 4.28 5 * 1.50 5 ns 28.10 5 *** 12.42 5 *** TOC 7.06 5 ** 83.60 5 *** 4.47 5 * 33.44 5 *** 15.35 5 *** LabOM 8.55 5 ** 36.76 5 *** 6.56 5 ** 5.63 5 ** 6.48 5 ** TP 310.67 5 *** 222.07 5 *** 3.45 5 * 450.95 5 *** 148.08 5 *** Daily fluxes PO3À 4 0.13 2 ns 0.85 5 ns 2.06 5 ns 4.05 2 * 3.66 5 * Daily fluxes O2 54.37 2 *** 3.14 5 * 3.90 2 * 1.94 2 ns 5.43 5 ** Sedimentation rate 39.69 2 *** 72.66 2 *** 15.49 2 *** 295.03 2 *** N. Papageorgiou et al. / Marine Environmental Research 69 (2010) 326–336 329
- 5. The median grain size seemed to affect negatively most of the studied variables with the exception of Eh. Accordingly, the silt & clay percentage of the sediments showed a negative relation to the biotic variables and a positive one with the geochemical vari- ables, with the exception of Eh. The highest proportion of variance explained by the model was for the geochemical variables TP, Chl-a and Eh (74.6% &, 72%, 71.2%) and the lower variability explained was for the O2 fluxes (12.1%). The cause of the latter could be the smaller amount of samples for the analysis of this variable. To identify the influence of sediment type on different re- sponse variables, we repeated the analyses separately for two major types of habitats: bare sediment of muddy (Astakos, Cephalonia) and seagrass (Sounion, Sitia) habitats. The distribu- tion of the geochemical and the biotic variables with distance from the fish cages in the two habitat types are shown in Fig. 2. The results of factorial analysis of variance (Table 4) showed that the difference between the two studied habitats was signifi- cant for almost all the variables with the exception of TP and PO3À 4 fluxes. Accordingly, spatial differences were significant for all the variables and only Chl-a concentration seemed not to be af- fected by distance. Tukey’s test for habitat  distance (Table 4) showed significant results in the case of six variables (log abundance, log biomass, H0 , labOM, TP, PO3À 4 fluxes). For the biotic variables, there was a signif- icant difference between the two habitat types in the stations near the cages, while for labOM this difference was detected in the re- mote stations. The variables of TP and PO3À 4 fluxes did not show a similar pattern. In the seagrass habitat type, abundance and biomass showed significantly lower values at the control station. Also, lower values of labOM and TP concentration in the sediment were found at the remote stations of the fish cages. PO3À 4 fluxes showed no significant differences among the stations. In the muddy habitat type stations near the cages, abundance, biomass and H0 , showed lower values while the control station had significantly lower values for TP. The labOM and PO3À 4 fluxes showed no significant differences between the stations with the exception of station 5 and station 0, respectively. In the stepwise regression analysis for the habitat types, the ex- plained variance increased for most of the studied variables yet the importance of the independent variables changed between the habitat types (Table 5). In seagrass habitats, depth did not seem to be an important factor affecting the dependent variables (except of the PO3À 4 fluxes) whereas the silt & clay percentage had an effect on the levels of four geochemical variables (TP, Chla, Eh and sedi- mentation rate). To test the overall outcome of our model, we calculated the val- ues of the dependent variables for a given distance (10 m) and depth (25 m) and the average median grain size (Seagrass MD: 0.653. muddy MD:14.342) and silt & clay percentage (Seagrass silt & clay: 14.3%. muddy silt & clay: 77.5%) in the studied habitats (Table 6). Table 2 Results of Spearman rank order correlation analysis, significant correlations (p < 0.005) highlighted in bold. Log (Sed rt) Log (abun) Log (bms) H0 J0 TON TOC LabOM Chl-a Eh TP PO3À 4 fluxes O2 fluxes Log (Sed rt) 0.171 0.254 À0.668 À0.636 0.332 0.054 0.061 0.039 À0.064 0.441 0.311 À0.200 Log (abun) 0.436 À0.066 À0.528 0.047 0.022 0.073 À0.151 0.002 0.408 0.180 0.070 Log (bms) 0.133 À0.039 À0.179 À0.293 À0.253 À0.367 0.213 0.185 À0.099 0.138 H0 0.806 À0.645 À0.550 À0.542 À0.488 0.611 À0.630 À0.412 0.522 J0 À0.546 À0.502 À0.451 À0.360 0.451 À0.713 À0.484 0.309 TON 0.820 0.822 0.757 À0.779 0.737 0.223 À0.697 TOC 0.931 0.814 À0.846 0.809 0.239 À0.613 LabOM 0.741 À0.828 0.803 0.182 À0.613 Chl-a À0.774 0.484 0.023 À0.567 Eh À0.693 À0.212 0.609 TP 0..191 À0.548 PO3À 4 fluxes À0.447 O2 fluxes Table 3 Results of multiple stepwise regression. Dependent variable Constant coefficient Ln (distance) coefficient Depth coefficient Median grain size coefficient Silt & clay coefficient Number of samples % Variance Log (abun) 3.154** À0.068* À0.300* À0.007*** 30 48.5 Log (bms) 3.350** À0.0078 À0.060 À0.413 À0.010* 30 33 Shannon (H0 ) 2.357*** 0.211*** À0.261 À0.008** 30 56 Evenness (J0 ) 0.943*** 0.037*** À0.021* 30 52.6 TON À1.248 À0.203*** 0.204*** 0.011** 30 60.5 TOC À11.234 À1.000 1.701* À4.194 0.068 30 65.4 LabOM 2.753 À1.777* 1.709* À5.936 0.095 30 57.5 TP 2.211 À0.407*** 0.121 À0.509 24 74.6 Chl-a À34.265*** – 2.235*** 0.131*** 30 72 Eh 215.257 21.671* À10.920 92.894* À1.798*** 30 71.7 PO3À 4 fluxes 2.287 À0.138* À0.078 15 31.2 O2 fluxes À30.446 À0.402 15 12.1 Log (Sed rt) 4.648*** À0.079 15 18.8 * p < 0.05. ** p < 0.01. *** p < 0.005. 330 N. Papageorgiou et al. / Marine Environmental Research 69 (2010) 326–336
- 6. The abundance and the sedimentation rates showed no great change between the two different habitats. Biomass and the diver- sity metrics showed a decrease in the muddy habitats while the abiotic variables decreased in the seagrass habitats. In muddy hab- itats, the PO3À 4 increased their flux from sediment to water column while the oxygen flux in the sediment also increased. 0 0.5 1 1.5 2 2.5 3 3.5 4 4.5 5 0 5 10 25 50 Control logabundance(indvm-2 ) 0 0.5 1 1.5 2 2.5 logbiomass(gm-2 ) 0 0.5 1 1.5 2 2.5 3 3.5 4 Shannondiversity(H') 0 0.1 0.2 0.3 0.4 0.5 0.6 0.7 0.8 0.9 1 Evenness(J') -200 -100 0 100 200 300 400 Redoxpotential(mV) 0 5 10 15 20 25 Chl-α(mg/g) 0 0.5 1 1.5 2 2.5 3 3.5 4 TON(mg/g) 0 5 10 15 20 25 30 TOC(mg/g) 0 10 20 30 40 50 60 labOM(mg/g) 0 0.5 1 1.5 2 2.5 3 3.5 4 4.5 5 TP(mg/g) -2 -1.5 -1 -0.5 0 0.5 1 1.5 2 2.5 PO4 -3 fluxes(μmolm -2 d -1 ) -90 -80 -70 -60 -50 -40 -30 -20 -10 0 10 O2fluxes(μmolm -2 d -1 ) 3.6 3.8 4 4.2 4.4 4.6 4.8 5 log(sedrates)(gm-2 d-1 ) Seagrass Muddy 0 5 10 25 50 Control 0 5 10 25 50 Control 0 5 10 25 50 Control 0 5 10 25 50 Control 0 5 10 25 50 Control 0 5 10 25 50 Control 0 5 10 25 50 Control 0 5 10 25 50 Control 0 5 10 25 50 Control 0 5 10 25 50 Control 0 5 10 25 50 Control 0 5 10 25 50 Control Fig. 2. Distribution of biogeochemical variables with distance from fish cages for the studied habitat types. N. Papageorgiou et al. / Marine Environmental Research 69 (2010) 326–336 331
- 7. Table 4 Factorial ANOVA of biogeochemical variables with distance from fish cages (0, 5, 10, 25, 50 m and control) and the two habitat types (S: Seagrass habitat, M: Muddy habitat). Values of Tukey test are significant at p < 0.05 (ns: not significant). Variable Source of variability df F p Tukey post hoc test Habitat Distance Log abundance Habitat 5 44.39 <0.001 Distance 1 4.23 0.001 Habitat  distance 1 15.53 <0.001 Seagrass: (0, 10, 25, 50) > control 0: S > M Muddy: (0, 5) < (25, control) 5: S > M 10: S > M 25: S = M 50: S = M Control: S = M Log Biomass Habitat 5 60.22 <0.001 Distance 1 4.90 <0.001 Habitat  distance 1 10.72 <0.001 Seagrass: (0, 5, 10, 25, 50) > control 0: S > M Muddy: 5 < 50 5: S > M 10: S > M 25: S = M 50: S = M Control: S = M H0 Habitat 5 53.23 <0.001 Distance 1 13.25 <0.001 Habitat  distance 1 4.75 <0.001 Seagrass: 5 < (25, 50) 0: S = M Muddy: (0, 5, 10, 50)<(25, control) 5: S > M 10: S > M 25: S = M 50: S > M Control: S = M J0 Habitat 5 4.24 <0.001 Distance 1 6.45 <0.001 Habitat  distance 1 1.08 0.374 Eh Habitat 5 33.12 <0.001 Distance 1 11.30 <0.001 Habitat  distance 1 1.61 0.171 Chl-a Habitat 5 40.51 <0.001 Distance 1 1.45 0.220 Habitat  distance 1 0.65 0.662 TON Habitat 5 14.28 <0.001 Distance 1 7.77 <0.001 Habitat  distance 1 0.96 0.452 TOC Habitat 5 18.32 <0.001 Distance 1 10.33 <0.001 Habitat  distance 1 1.18 0.332 LabOM Habitat 5 21.89 <0.001 Distance 1 14.31 <0.001 Habitat  distance 1 2.68 0.030 Seagrass: (0, 5, 10) > (50, control) 0: S = M Muddy: 5 > (0, 10, 50, control) 5: S < M 10: S = M 25: S < M 50: S < M Control: S < M TP Habitat 5 2.19 0.144 Distance 1 55.53 <0.001 Habitat  distance 1 5.74 <0.001 Seagrass: (0, 5, 10) > (25, 50, control) 0: S = M Muddy: (0, 5, 10, 25, 50) > control 5: S = M 10: S = M 25: S = M 50: S < M Control: S = M Daily fluxes PO3À 4 Habitat 5 0.70 0.404 Distance 1 5.59 <0.001 Habitat  distance 1 3.26 0.009 Seagrass: ns 0: S = M Muddy: 0 > (5, 25, 50, control) 5: S = M 10: S = M 25: S = M 50: S = M Control: S = M Daily fluxes O2 Habitat 5 6.95 0.010 Distance 1 3.72 0.004 Habitat  distance 1 1.63 0.158 Sedimentation rate Habitat 2 50.37 <0.001 Distance 1 17.09 <0.001 Habitat  distance 1 0.58 0.564 332 N. Papageorgiou et al. / Marine Environmental Research 69 (2010) 326–336
- 8. 4. Discussion Our results showed a gradual decrease of sedimentation rates and nutrient concentrations (TON, TOC, labOM, TP) with distance from the fish cages confirming the results from previous studies (Brown et al., 1987; Weston, 1990; Karakassis et al., 1998, 2000). Although there was a significant influence of distance from the fish cages on benthic fauna (abundance, biomass, diversity measures), there was no consistent pattern between the studied sites. The dif- ferent sediment composition and functioning between the studied sites could prevent a unified response from the macrofauna organ- isms. In general, enhanced sedimentation rates and high nutrient loadings near the cages change the chemical pathways and rates of nutrient cycling, influence the oxygen flow and alter the compo- sition and function of macrofaunal assemblages (Hargrave et al., 2008). The correlations between the biogeochemical variables have been described in a number of studies concerning sediment organ- ic enrichment. Kalantzi and Karakassis (2006) explained the posi- tive correlation between Chl-a and TOC by eutrophication effects at the sediment surface. The negative correlation of diversity met- rics (H0 , J0 ) and organic content in the sediment (TOC, labOM) is ex- plained by the influence of high loadings of organic material to the diversity of macrofaunal organisms (Pearson and Rosenberg, 1978; Hyland et al., 2005). The sedimentation rates were related to the diversity measures. The negative correlation with them indicates the effect of organic enrichment through enhanced sedimentation to the benthic fauna in the vicinity of fish farms. When organic loading is in over-abun- dance, it affects the population densities, species distributions and biomass of the macrofauna and influences their irrigation activity (Albertelli et al., 1999; Hyland et al., 2005; Tomassetti and Porrello, 2005; Heilskov et al., 2006). Oxygen fluxes were negatively corre- lated to most of the geochemical variables indicating their contri- bution to sediment functioning. Higher nutrient loadings could increase the microbial activity and the oxygen consumption in the sediment (Vezzulli et al., 2008). Phosphate fluxes showed a higher release from sediment to water at stations under the cages where the conditions are reduced. In oxidized surface sediments, the PO3À 4 can be absorbed and its flux towards the overlying water is reduced (Sundby et al., 1992; Foellmi, 1996; Giles et al., 2006). The correlation between PO3À 4 and oxygen fluxes confirms this relationship. The stepwise regression models seemed to explain a higher pro- portion of the variance of the geochemical variables than that of biological variables. The model for Shannon and Evenness diversity measures explained a high percentage of variability, while for abundance and biomass the explained variability was lower. For the variable of abundance, the model has not incorporated distance. This can be explained by the non linear distribution of Table 5 Results of multiple stepwise regression for different habitat types. Dependent Variable Constant coefficient Ln (distance) coefficient Depth coefficient Median grain size coefficient Silt & clay coefficient Number of samples % Variance Seagrass habitat Log (abun) 4.396*** À0.117*** 12 70.5 Log (bms) 2.470*** À0.155 À0.396 12 72.8 Shannon (H0 ) 2.250*** 0.161 12 29.4 Evenness (J0 ) 0.588*** 0.047 12 50.3 TON 2.733*** À0.380* 12 46.7 TOC 22.287*** À2.974* 12 46.5 LabOM 37.974*** À4.568*** 12 58.9 TP 4.267*** À0.581*** 0.012 12 72.4 Chl-a 3.537** À0.492 0.034 12 62.2 Eh 727.135 À41.192 137.94* À2.261 12 71 PO3À 4 fluxes 1.182* 0.057 À0.527* À0.016 6 95.7 O2 fluxes À81.334 10.233 6 22.3 Log (Sed rt) 4.161*** 0.008 6 35.2 Muddy habitat Log (abun) 2.299*** 0.046 0.072 12 40 Log (bms) 0.316 0.011 12 14.7 Shannon (H0 ) 2.210** 0.283*** À0.048 12 80 Evenness (J0 ) 1.038*** 0.038* À0.028* 12 60.7 TON À0.800 À0.322*** 0.243*** 4.885 12 82.3 TOC À6.346 À2.072*** 1.858*** 1.298 12 86.3 LabOM 15.791 À2.366 1.55 12 40 TP 1.762 À0.387*** 0.139* 12 85 Chl-a À31.402** À1.925 2.995*** 44.464 12 86.9 Eh 28.784 27.934** À9.128 12 62.2 PO3À 4 fluxes 1.476 À0.223 6 48.6 O2 fluxes À44.97 À3.079 À1.749 367.878 6 93.0 Log (Sed rt) 4.937*** À0.026 À5.909* 6 93.5 * p < 0.05. ** p < 0.01. *** p < 0.005. Table 6 Values of the dependent variables for a given distance (10 m), depth (25 m), median grain size and silt & clay percentage (seagrass: MD: 0.653, silt & clay: 14.3%, muddy: MD:14.342, silt & clay: 77.5%) at the different habitat types. Dependent variable Seagrass habitat Muddy habitat Ln (abun) 4.127 4.205 Ln (bms) 1.855 1.169 Shannon (H0 ) 2.621 1.662 Evenness (J0 ) 0.696 0.425 TON 1.858 4.783 TOC 15.439 35.399 LabOM 27.456 49.093 TP 3.101 4.346 Chl-a 2.892 41.308 Eh À245.017 À135.096 PO3À 4 fluxes 0.740 0.963 O2 fluxes À57.772 À77.023 Ln (Sed rt) 4.276 4.576 N. Papageorgiou et al. / Marine Environmental Research 69 (2010) 326–336 333
- 9. abundance across the enrichment gradient. According to Pearson and Rosenberg (1978), the abundance curve shows a peak at the intermediate levels of the enrichment and therefore cannot be de- scribed by linear models such as the ones of the stepwise regres- sion analysis. The model for redox potential integrates the changes of faunal components to the organic loading. Eh increases with distance and the coarseness of the sediment and decreases with depth and high silt & clay percentage. It is known from previous studies that the concentrations of TON, TOC and labOM decrease with distance from the fish farms (Brown et al., 1987; Weston, 1990; Karakassis et al., 1998, 2000). In our model, the relation of these variables with bathymetry and sediment composition of the studied areas becomes clear. Muddy and fine sediments contain usually higher concentrations of organic loadings while deeper sediments have usually larger amounts of silt and clay (Gray, 1981). Thus the organic content increases with depth or silt percentage and decreases in coarser sediments. From the above, the importance of sediment composition for the struc- ture and functioning of the benthic communities becomes clear. To identify the influence of sediment type on different response variables, we repeated the analyses separately for two major types of habitats: bare sediment of muddy and seagrass habitats. It is worth noting that sedimentation rates as identified by means of sediment traps (Fig. 2), were not significantly different for the two sediment types. In other words the forcing factor of change was rather similar and therefore any changes in the response vari- ables could be attributed to the type of the sediment of the seabed and the associated biological and geochemical processes. The factorial ANOVA results showed a different response to or- ganic enrichment between the two habitat types. For the stations near the fish cages, the seagrass habitat type had higher values of biotic variables (abundance, biomass, H0 ). High loadings of or- ganic material in an already enriched system can result in a shift to a more microbial functioning, while in nutrient poor conditions the input of organic material is a potential food source resulting in increased macrofaunal abundance and biomass. In the case of car- bon and nitrogen geochemical variables (TON, TOC, labOM), their concentration at the remote stations was lower in both habitats because of the reduced influence of the fish farm. Also, the seagrass habitat type showed decreased loadings because of the nutrient poor nature of these sediments. The redox potential and the oxy- gen flux followed the same pattern of change along the stations in the different habitat types with distance from the cages. Because the amount of nutrient loading reaching each station was the same, no significant difference for the phosphate values (TP, PO3À 4 fluxes) was detected between the two habitats. In stepwise regression, the coefficient of abundance with dis- tance showed an increase from seagrass towards muddy habitats, implying a different response of the fauna to organic enrichment. The sediment in the vicinity of intact P. oceanica fields is generally very coarse, nutrient poor and with high mobility and permeabil- ity. While the sediment of the seagrass habitats in the vicinity of the fish farms contains decomposing detritus of P. oceanica plants, have higher nutrient loadings and can have a higher silt & clay per- centage thus increasing the potential food availability and the po- tential shelters (Bostrom et al., 2006). This fact, in combination with the oxic conditions induced by intense currents and high advection in coarse sediments, can raise the macrofaunal abun- dance (Apostolaki et al., 2007; Holmer et al., 2008). The variability of Shannon diversity measure (H0 ) explained by the regression models for the different habitat types increased from 29.4% to 80% for the muddy habitats. The Shannon diversity coefficient with distance increased in muddy habitats, indicating an increase of the distance affected from the fish farms. The muddy sediment habi- tats of this study refer to fine sediments with high silt & clay per- centage. The sediments of this type have increased nutrient loadings and show low permeability and low redox potential. Any further adding of nutrients from fish farming to this type of enriched sediments can shift the system to an anoxic functioning resulting in reduced macrofaunal abundance (Middelburg et al., 2005; Hargrave et al., 2008). Depth seems to be an important factor affecting the dependent variables only in the case of muddy habitats. Most of the variables increased with depth except for the diversity measures, which had a negative coefficient. In the seagrass habitats, hydrodynamic pro- cesses and sediment re-suspension are more important factors in determining the spatial distribution of organic matter (Gowen and Bradbury, 1987). The test of our model (Table 6) showed that although the sedi- mentation rates were similar the responses of biotic and geochem- ical variables of the two sediment types were very different. Important was the fact that for almost the same inputs of sedimen- tation rates, the response of the system was different and propor- tional to the sediment type and function. Although redox potential did not show the expected decrease in muddy habitats, the in- creased nutrient loadings in them confirmed the different toler- ance of the habitats at the same level of organic enrichment. The increased O2 and PO3À 4 fluxes in the muddy habitat type confirmed these results. From the above, it becomes clear that although the spatial ex- tent of the organic enrichment due to fish farming was the same, faunal organisms and geochemical variables showed different pat- terns of response according to the functions of their habitat. It seems that the overall response of biological and geochemical vari- ables to the organic enrichment varied considerably among habitat types as was found through the separate analysis of data from these two categories. This is consistent with the findings of Apos- tolaki et al. (2007) who also carried out sampling and analysis of samples near seagrass meadows and found little change with or- ganic enrichment as well as with those of the meta-analysis by Kal- antzi and Karakassis (2006) who found different responses between fine and coarse sediments to organic enrichment. The overall conclusion is that the effects on the benthic environment are not as easy to detect in coarse sediments through standard monitoring. However, since these habitats are likely to host sea- grass meadows it is possible that organic enrichment in this case could have more important consequences (Holmer et al., 2008). These findings imply that samples from silty sediments in the vicinity of fish farms are likely to show higher TOC and TON values, higher oxygen consumption, higher PO3À 4 release and lower benthic diversity. In this context, they are more likely to be identified as ‘‘impacted”, ‘‘critical” or close to the ‘‘action level” through stan- dard monitoring. On the other hand samples from coarse sediment types are more ‘‘safe” at least in the context of macrofaunal and geochemical monitoring. Moving sea cages offshore will inevitably (at least in the Mediterranean) place them above sites with fine sediments which are more susceptible to organic enrichment, although the increase in depth might at least in part compensate for this increase in impact intensity. Acknowledgments This paper is part of the 03ED600 research project, imple- mented within the framework of the ‘‘Reinforcement Program of Human Research Manpower” (PENED) and co-financed by National and Community Funds (25% from the Greek Ministry of Develop- ment-General Secretariat of Research and Technology and 75% from EU-European Social Fund). Also this study was partly sup- ported by the European 6th Framework Program (ECASA project, Project No. 006540). Thanks are due to I. Glampedakis, V.N. Kou- roubalis, S. Kiparissis, N. Gotsis, K. Sevastou, E. Apostolaki, I. Magiopoulos, V. Kalogeropoulou for assistance with sampling, P. 334 N. Papageorgiou et al. / Marine Environmental Research 69 (2010) 326–336
- 10. Zarmpas for assistance in chemical analyses and M. Holmer for assistance in data analyses. Helpful comments by an anonymous reviewer and the Editor are gratefully acknowledged. References Albertelli, G., Covazzi-Harriague, A., Danovaro, R., Fabiano, M., Fraschetti, S., 1999. Differential responses of bacteria, meiofauna and macrofauna in a shelf are (Ligurian Sea, NW Mediterranean): role of food availability. Journal of Sea Research 42, 11–26. Apostolaki, E.T., Tsagaraki, T., Tsapakis, M., Karakassis, I., 2007. Fish farming imact on sediments and macrofauna associated with seagrass meadows in the Mediterranean. Estuarine, Coastal and Shelf Science 75, 408–416. Aspila, K.I., Agemian, H., Chau, A.S.Y., 1976. A semiautomated method for the determination of inorganic, organic and total phosphate in sediments. Analyst 101, 187–197. Blomqvist, S., Håkanson, L., 1981. A review on sediment traps in aquatic environments. Archiv fuer Hydrobiologie 91, 101–132. Borja, A., Josefson, A.B., Miles, A., Muxika, I., Olsgard, F., Phillips, G., Rodriguez, G.J., Rygg, B., 2007. An approach to the intercalibration of benthic ecological status assessment in the North Atlantic ecoregion, according to the European Water Framework Directive. Marine Pollution Bulletin 55, 42–52. Bostrom, C., Jackson, E.L., Simenstad, C.A., 2006. Seagrass landscapes and their effects on associated fauna: a review. Estuarine Coastal and Shelf Science 68, 383–403. Brown, J.R., Gowen, R.J., McLusky, D.S., 1987. The effect of salmon farming on the benthos of a Scotish sea loch. Journal of Experimental Marine Biology and Ecology 109, 39–51. Cardona, L., Revelles, M., Sales, M., Aguilar, A., Borell, A., 2007. Meadows of seagrass Posidonia oceanica are a significant source of organic matter for adjoining ecosystems. Marine Ecology Progress Series 335, 123–131. Duarte, C.M., 2002. The future of seagrass meadows. Environmental Conservation 29, 192–206. Foellmi, K.B., 1996. The phosphorus cycle, phosphogenesis and marine phosphate- rich deposits. Earth-Science Revies 40, 55–124. Fresi, E., Gambi, M.C., Focardi, S., Bargagli, R., Baldi, F., Faliciai, L., 1983. Benthic community and sediment types: a structural analysis. Pubblicazioni della stazione zoologica di napoli, Italy. Marine Ecology 4, 101–121. Gacia, E., Granata, T.C., Duarte, C.M., 1999. An approach to measurement of particle flux and sediment retention within seagrass (Posidonia oceanica) meadows. Aquatic Botany 65, 255–268. Giles, H., Pilditch, C.A., Bell, G.B., 2006. Sedimentation from mussel (Perna canaliculus) culture in the irth of Thames, New Zealand: impacts on sediment oxygen and nutrient fluxes. Aquaculture 261, 125–140. Gowen, R.J., Bradbury, N.B., 1987. The ecological impact of salmonid farming in coastal waters: a review. Oceanography and Marine Biology Annual Review 25, 563–575. Gray, J.S., 1981. The sediment and related environmental factors. In: Barnes, R.S.K., Miller, P.L., Paul, J., Rees, T. (Eds.), The Ecology of Marine Sediments. Cambridge University Press, pp. 11–19. Gray, J.S., 2002. Species richness of marine soft sediments. Marine Ecology Progress Series 244, 285–297. Gray, J.S., Shiu-sun, R., Or, Y.Y., 2002. Effects of hypoxia and organic enrichment on the coastal marine environment. Marine Ecology Progress Series 238, 249–279. Hall, P.O.J., Anderson, L.H., Holby, O., Kollberg, S., Samuelson, M.J., 1990. Chemical fluxes and mass balances in a marine fish cage farm. I. Carbon. Marine Ecology Progress Series 61, 61–73. Hall, P.O.J., Holby, O., Kollberg, S., Samuelson, M.J., 1992. Chemical fluxes and mass balances in a marine fish cage farm. IV. Nitrogen. Marine Ecology Progress Series 89, 81–91. Hargrave, B.T., Duplisea, D.E., Pfeiffer, E., Wildish, D.J., 1993. Seasonal changes in benthic fluxes of dissolved oxygen and ammonium associated with marine cultured Atlantic salmon. Marine Ecology Progress Series 96, 249–257. Hargrave, B.T., Holmer, M., Newcombe, C.P., 2008. Towards a classification of organic enrichment in marine sediments based on biogeochemical indicators. Marine Pollution Bulletin 56, 810–824. Hargrave, B.T., Burns, N.M., 1979. Assessment of sediment trap collection efficiency. Limnology and Oceanography 24, 1124–1136. Heilskov, A.C., Alperin, M., Holmer, M., 2006. Benthic fauna bio-irrigation effects on nutrient regeneration in fish farm sediments. Journal of Experimental Marine Biology and Ecology 339, 204–225. Holby, O., Hall, P.O.J., 1991. Chemical fluxes and mass balances in a marine fish cage farm. II. Phosphorus. Marine Ecology Progress Series 70, 263–272. Holmer, M., Argyrou, M., Dalsgaard, T., Danovaro, R., Diaz-Almela, E., Duarte, C., Frederiksen, M., Grau, A., Karakassis, I., Marba, N., Mirto, S., Perez, M., Pusceddu, A., Tsapakis, M., 2008. Effects of fish farm waste on Posidonia oceanica meadows: Synthesis and provision of monitoring and management tools. Marine Pollution Bulletin 56, 1618–1629. Holmer, M., Duarte, C., Heilskov, A.C., Olesen, B., Terrados, J., 2003. Biogeochemical conditions in sediments enriched by organic matter from net-pen fish farms in the Bolinao area, Philippines. Marine Pollution Bulletin 46, 1470–1479. Holmer, M., Kristensen, E., 1992. Impact of marine cage farming on metabolism and sulfate reduction of underlying sediments. Marine Ecology Progress Series 80, 191–201. Holmer, M., Marba, N., Diaz-Almela, E., Duarte, C., Tsapakis, M., Danovaro, R., 2007. Sedimentation of organic matter from fish farms in oligotrophic Mediterranean assessed through bulk and stable isotope (d13 C and d15 N) analyses. Aquaculture 262, 268–280. Hyland, J., Balthis, L., Karakassis, I., Magni, P., Petrov, A., Shine, J., Vestergaard, O., Warwick, R., 2005. Organic carbon content of sediments as an indicator of stress in the marine benthos. Marine Ecology Progress Series 295, 91–103. Kalantzi, I., Karakassis, I., 2006. Benthic impacts of fish farming: meta-analysis of community and geochemical data. Marine Pollution Bulletin 52, 479–483. Karakassis, I., 2001. Ecological effects of fish farming in the Mediterranean. Cahiers Options Mediterrannennes 55, 15–22. Karakassis, I., Hatziyanni, E., 2000. Benthic disturbance due to fish farming analyzed under differnt levels of taxonomic resolution. Marine Ecology Progress Series 203, 247–253. Karakassis, I., Tsapakis, M., Hatziyanni, E., 1998. Seasonal variability in sediment profiles beneath fish farm cages in the Mediterranean. Marine Ecology Progress Series 162, 243–252. Karakassis, I., Tsapakis, M., Hatziyanni, E., Papadopoulou, K.N., Plaiti, W., 2000. Impact of cage farming of fish on the seabed in three Mediterranean coastal areas. ICES Journal of Marine Science 57, 1462–1471. Karakassis, I., Tsapakis, M., Smith, C.J., Rumohr, H., 2002. Fish farming impacts in the Mediterranean studied through sediment profiling imagery. Marine Ecology Progress Series 227, 125–133. Labrune, C., Amouroux, J.M., Sarda, R., Dutrieux, E., Thorin, S., Rosenberg, R., Gremare, A., 2006. Characterization of the ecological quality of the coastal Gulf of Lions (NW Mediterranean). A comparative approach based on three biotic indices. Marine Pollution Bulletin 52, 34–47. Lampadariou, N., Karakassis, I., Pearson, T.H., 2005. Cost/benefit analysis of a benthic monitoring programme of organic benthic erichment using different sampling and analysis methods. Marine Pollution Bulletin 50, 1606–1618. Loh, P.S., 2005. An assessment of the contribution of terrestrial organic matter to total organic matter in sediments in Scottish sea lochs. PhD Thesis, UHI Millenium Institute, 350 pp. Marinelli, R.L., Williams, T.J., 2003. Evidence for density-dependent effects of infauna on sediment biogeochemistry and benthic–pelagic coupling in nearshore systems. Estuarine, Coastal and Shelf Science 57, 179–192. Marinelli, R.L., Woodin, S.A., 2002. Experimental evidence for linkages between infaunal recruitment, disturbance and sediment surface chemistry. Limnology and Oceanography 47, 221–229. Middelburg, J.J., Duarte, C., Gattuso, J.P., 2005. Respiration in coastal benthic communities. In: del Giorgio, P.A., le B Williams, P.J. (Eds.), Respiration in Aquatic Ecosystems. Oxford University Press, New York, pp. 206–224. Mills, V.S., Berkenbusch, K., 2009. Seagrass (Zostera muelleri) patch size and spatial location influence infaunal macroinvertebrate assemblages. Estuarine, Coastal and Shelf Science 81, 123–129. Murphy, J., Riley, J.P., 1962. A modified single solution method for the determination of phosphate in natural waters. Analytical Chimica Acta 27, 31–36. Muxika, I., Borja, A., Bald, J., 2007. Using historical data, expert judgement and multivariate analysis in assessing reference conditions and benthic ecological status, according to the European Water Framework Directive. Marine Pollution Bulletin 55, 16–29. Pearson, T.H., Rosenberg, R., 1978. Macrobenthic succession in relation to organic enrichment and pollution of the marine environment. Oceanography Marine Biology Annual Review 16, 229–311. Pusceddu, A., Fraschetti, S., Mirto, S., Holmer, M., Danovaro, R., 2007. Effects of intensive mariculture on sediment biochemistry. Ecological Applications 17, 1366–1378. Quintino, V., Elliott, M., Rodrigues, A.M., 2006. The derivation, performance and role of univariate and multivariate indicators of benthic change: case studies at differing spatial scales. Journal of Experimental Marine Biology and Ecology 330, 368–382. Rosenberg, R., Blomqvist, M., Nilsson, H.C., Cederwall, H., Dimming, A., 2004. Marine quality assessment by use of benthic species-abundane distributions: a proposed new protocol within European Union Water Framework Directive. Marine Pollution Bulletin 49, 728–739. Sara, G., Scilipoti, D., Mazzola, A., Modica, A., 2004. Effects of fish farming waste to sedimentary and particulate organic matter in a southern Mediterranean area (Gulf of Castellammare, Sicily): a multiple stable isotope study (d13 and d15 N). Aquaculture 234, 199–213. Sundby, B., Gobeil, C., Silverberg, N., 1992. The phosphorus cycle in coastal marine sediments. Limnology and Oceanography 37, 1129–1145. Thamdrup, B., Canfield, D.E., 2000. Benthic respiration in aquatic sediments. In: Sala, O.E., Jackson, R.B., Mooney, H.A., Howarth, R.W. (Eds.), Methods in Ecosystem Science. Springer, New York, pp. 86–103. Tomassetti, P., Porrello, S., 2005. Polychaetes as indicators of marine fish farm organic enrichment. Aquaculture International 13, 109–128. Tung, J.W.T., Tanner, P.A., 2003. Instrumental determination of organic carbon in marine sediments. Marine Chemistry 80 (2–3), 161–170. Verardo, D.J., 1990. Determination of organic carbon and nitrogen in marine sediments using the Carlo Erba NA-1500 Analyzer. Deep-Sea Research 37 (1), 157–165. Vezzulli, L., Moreno, M., Marin, V., Pezzati, E., Bartoli, M., Fabiano, M., 2008. Organic waste impact of captured-based Atlantic bluefin tuna aquaculture at an exposed site in the Mediterranean Sea. Estuarine, Coastal and Shelf Science 78, 369–384. N. Papageorgiou et al. / Marine Environmental Research 69 (2010) 326–336 335
- 11. Waldbusser, G.G., Marinelli, R.L., Whitlach, R.B., 2004. The effects of infaunal biodiversity on biogeochemistry of coastal marine sediments. Limnology and Oceanography 49, 1482–1492. Weston, D.P., 1990. Quantitative examination of macrobenthic community changes along an organic enrichment gradient. Marine Ecology Progress Series 61, 233– 244. Yentsch, C.S., Menzel, D.W., 1963. A method for the determlnation of phytoplankton chlorophyll and phaeophytin by fluorescence. Deep Sea Research 10, 221–231. Zobell, C.E., 1946. Studies on redox potential of marine sediments. The Bulletin of the American Association of Petroleum Geologists 30, 477–510. 336 N. Papageorgiou et al. / Marine Environmental Research 69 (2010) 326–336