
Recommended
More Related Content
More from dware655
More from dware655 (20)
Recently uploaded
Recently uploaded (20)
Skill38 comparing two functions
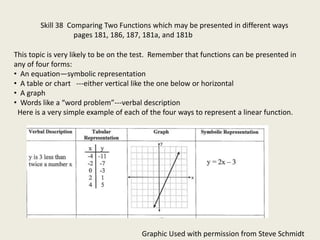
- 1. Skill 38 Comparing Two Functions which may be presented in different ways pages 181, 186, 187, 181a, and 181b This topic is very likely to be on the test. Remember that functions can be presented in any of four forms: • An equation—symbolic representation • A table or chart ---either vertical like the one below or horizontal • A graph • Words like a “word problem”---verbal description Here is a very simple example of each of the four ways to represent a linear function. Graphic Used with permission from Steve Schmidt
- 2. All of the problems in this section deal with two quantities which boil down to (x,y) ordered pairs. All of them use the idea of slope if the problem is a linear one. Think: y = mx + b. On the test a problem will have some introduction in words and then two of the four representations mentioned on the first slide. Questions will be about the rate of growth (slope) or value, y, at a certain value of x. Most problems will use other letters from the words of the problem instead of just x and y; however, they are just like x and y.
- 3. The Birmingham zoo recently announced the birth of two baby tiger cubs. Tigger, the older cub, was weighed every week since he was born. This information was recorded in a table. Age in weeks Weight in lbs. 0 1 1 5 2 9 3 13 Annabelle, the younger cub, was also was weighed and measured each week. The zookeepers made a graph of the information. . Which tiger weighed the most at birth? Annabelle at 2 pounds at week 0. Look at the y-intercept for Annabelle. See week 1 for Tigger. Which cub is growing faster? This means find the biggest slope. For Tigger, think of change in Y divided by change in x. 4/1 For Annabelle, count blocks rise/run to get 3/1. So Tigger is Growing faster. Which tiger will weigh more after five weeks? Extend the chart for Tigger to get 17 pounds. Keep going up and over on the graph for Annabelle to get 21 pounds. So Tigger weights more
- 4. Two people on a weight loss plan are Victoria and Ollie. Their weights are shown by the Descriptions below. Victoria’s weight at the beginning is shown by the equation, W = 235 – 2.5 t where W is her current weight at time t. Ollie’s weight is recorded in the table shown. Weeks 0 2 5 6 Weight 247 243 237 235 Who weighed more at the beginning of the program? To find Victoria’s weight at the start, let t = 0 (the beginning). W = 235 – 2.5(0) or 235 – 0 or 235. To find Ollie’s weight at the start, look at the table for 0 weeks. See 247. So Ollie weighed More at the start. Who is losing weight faster? This means find the slope which is the rate. For Victoria think y = mx + b or in this case y = b + mx. M is the slope so Victoria is Losing weight at -2.5 pounds per week. Find Ollie’s rate by finding change in y/ change in x to get 243-247/ 2 – 0 or -4/2 or -2. So, Victoria is losing weight faster.
- 5. Now try problems 3 and 4 on page 181 b of your book. The answers are there. Remember that any question about rate is asking about slope. Any question about a value at the “beginning” is asking about the y-intercept on a graph or the y value when x = 0 from a table. Discussion of problem 3, page 181b. To find which tree is growing the fastest, for the Tree A, the words tell you that the tree is growing 4 inches a month. For tree B, find change in y/change in x. 12-3/2-0 or 9/2 or 4.5. For tree C, look at the graph. Count rise/run to get 38-10/8 – 0 or 28/8 or 3.5. So, tree B is growing fastest. Which tree was tallest at the beginning? Tree C was 10 inches, Tree B was 3, & Tree A was 5. Which tree will be tallest after 6 months? Tree C’s graph shows 31 inches, Tree B would be 30 inches if you add the monthly rate of 4.5 inches to month 5’s 25.5. Tree A would be 29 inches If you make a table and go to 6 months starting at month 0-5, 1-9, 2-13, 3-17, 4-21, 5-25, 6-29.
- 6. This topic is very important. Look at problem 4, page 181b.