Developmental Differences in the Structure of Executive
Function in Middle Childhood and Adolescence
Fen Xu1,2*, Yan Han2*, Mark A. Sabbagh3, Tengfei Wang4, Xuezhu Ren4, Chunhua Li5
1 Department of Psychology, Zhejiang Sci-Tech University, Hangzhou, China, 2 State Key Laboratory of Cognitive Neuroscience and Learning, Beijing Normal University,
Beijing, China, 3 Psychology Department, Queen’s University, Kingston, Canada, 4 Goethe University Frankfurt, Frankfurt a.M., Germany, 5 Beijing No. 12 High School,
Beijing, China
Abstract
Although it has been argued that the structure of executive function (EF) may change developmentally, there is little
empirical research to examine this view in middle childhood and adolescence. The main objective of this study was to
examine developmental changes in the component structure of EF in a large sample (N = 457) of 7–15 year olds. Participants
completed batteries of tasks that measured three components of EF: updating working memory (UWM), inhibition, and
shifting. Confirmatory factor analysis (CFA) was used to test five alternative models in 7–9 year olds, 10–12 year olds, and
13–15 year olds. The results of CFA showed that a single-factor EF model best explained EF performance in 7–9-year-old and
10–12-year-old groups, namely unitary EF, though this single factor explained different amounts of variance at these two
ages. In contrast, a three-factor model that included UWM, inhibition, and shifting best accounted for the data from 13–15
year olds, namely diverse EF. In sum, during middle childhood, putative measures of UWM, inhibition, and shifting may rely
on similar underlying cognitive processes. Importantly, our findings suggest that developmental dissociations in these three
EF components do not emerge until children transition into adolescence. These findings provided empirical evidence for
the development of EF structure which progressed from unity to diversity during middle childhood and adolescence.
Citation: Xu F, Han Y, Sabbagh MA, Wang T, Ren X, et al. (2013) Developmental Differences in the Structure of Executive Function in Middle Childhood and
Adolescence. PLoS ONE 8(10): e77770. doi:10.1371/journal.pone.0077770
Editor: Amanda Bruce, University of Missouri-Kansas City, United States of America
Received February 15, 2013; Accepted September 5, 2013; Published October 29, 2013
Copyright: � 2013 Xu et al. This is an open-access article distributed under the terms of the Creative Commons Attribution License, which permits unrestricted
use, distribution, and reproduction in any medium, provided the original author and source are credited.
Funding: The present study was supported by grants from the National Natural Science Foundation of China (30528027, 31028010, and 31170996) and Zhejiang
Provincial Natural Science Foundation of China (Y2110369). The funders had no role in study design, data collection and analysis, decision to publish, or
preparation of the manuscript.
Competing Int.
Developmental Differences in the Structure of ExecutiveFunct.docx
1. Developmental Differences in the Structure of Executive
Function in Middle Childhood and Adolescence
Fen Xu1,2*, Yan Han2*, Mark A. Sabbagh3, Tengfei Wang4,
Xuezhu Ren4, Chunhua Li5
1 Department of Psychology, Zhejiang Sci-Tech University,
Hangzhou, China, 2 State Key Laboratory of Cognitive
Neuroscience and Learning, Beijing Normal University,
Beijing, China, 3 Psychology Department, Queen’s University,
Kingston, Canada, 4 Goethe University Frankfurt, Frankfurt
a.M., Germany, 5 Beijing No. 12 High School,
Beijing, China
Abstract
Although it has been argued that the structure of executive
function (EF) may change developmentally, there is little
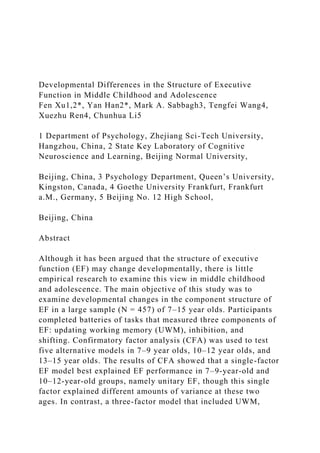
empirical research to examine this view in middle childhood
and adolescence. The main objective of this study was to
examine developmental changes in the component structure of
EF in a large sample (N = 457) of 7–15 year olds. Participants
completed batteries of tasks that measured three components of
EF: updating working memory (UWM), inhibition, and
shifting. Confirmatory factor analysis (CFA) was used to test
five alternative models in 7–9 year olds, 10–12 year olds, and
13–15 year olds. The results of CFA showed that a single-factor
EF model best explained EF performance in 7–9-year-old and
10–12-year-old groups, namely unitary EF, though this single
factor explained different amounts of variance at these two
ages. In contrast, a three-factor model that included UWM,
2. inhibition, and shifting best accounted for the data from 13–15
year olds, namely diverse EF. In sum, during middle childhood,
putative measures of UWM, inhibition, and shifting may rely
on similar underlying cognitive processes. Importantly, our
findings suggest that developmental dissociations in these three
EF components do not emerge until children transition into
adolescence. These findings provided empirical evidence for
the development of EF structure which progressed from unity to
diversity during middle childhood and adolescence.
Citation: Xu F, Han Y, Sabbagh MA, Wang T, Ren X, et al.
(2013) Developmental Differences in the Structure of Executive
Function in Middle Childhood and
Adolescence. PLoS ONE 8(10): e77770.
doi:10.1371/journal.pone.0077770
Editor: Amanda Bruce, University of Missouri-Kansas City,
United States of America
Received February 15, 2013; Accepted September 5, 2013;
Published October 29, 2013
Copyright: � 2013 Xu et al. This is an open-access article
distributed under the terms of the Creative Commons
Attribution License, which permits unrestricted
use, distribution, and reproduction in any medium, provided the
original author and source are credited.
Funding: The present study was supported by grants from the
National Natural Science Foundation of China (30528027,
31028010, and 31170996) and Zhejiang
Provincial Natural Science Foundation of China (Y2110369).
The funders had no role in study design, data collection and
analysis, decision to publish, or
preparation of the manuscript.
3. Competing Interests: The authors have declared that no
competing interests exist.
* E-mail: [email protected] (YH); [email protected] (FX)
Introduction
Executive function (EF) is the ability to monitor and regulate
different types of cognition and behavior to achieve specific
internal goals [1–2]. EF serves as an umbrella term that includes
multiple processing components, such as attentional control,
cognitive flexibility, set-shifting, inhibition, intentional control,
purposive action, set maintenance, working memory, and plan-
ning [3–5]. Among these components, updating working
memory
(UWM), inhibition, and shifting are the most widely researched
EF
processes [2,6–8], because they are lower-level (i.e., supposedly
implicated in complex executive components, such as planning),
and relatively well-defined [2]. UWM (often termed working
memory by most authors) refers to the processes involved in
monitoring and updating representations in working memory by
adding new relevant information and deleting no-longer-
4. relevant
information [9,2]. Inhibition is the ability to deliberately
suppress
the prepotent (i.e., habitual, dominant, autonomic) responses
when
those actions run counter to goal achievement [10,2]. Shifting is
the ability to flexibly switch between mental sets, mental
operations or different task rules [11,2].
Although theoretically dissociable, these three aspects of EF
may share some cognitive substrates. Over the last decade, a
number of studies have investigated the EF structure with
respect
to these three components with the goal of determining whether
they are indeed separable, or they are best thought of as a
mostly
unitary cognitive process. For adult, these investigations have
concluded that though moderately correlated, UWM, inhibition,
and shifting can vary independently which suggests that they
may
indeed be separable. This pattern has been called the full three-
factor structure [2,12–13]. However, in childhood, especially
5. during middle childhood and adolescence, not all studies
replicated this finding [14–22]. Furthermore, few studies, if
any,
investigated whether the factor structure of EF changes across
age
groups. Thus, the main goal of this study was to investigate the
developmental differences of the structure of these three EF
components during middle childhood and adolescence.
The three-factor structure of UWM, inhibition, and shifting was
first proposed by Miyake et al. based upon data from adults [2].
In
order to examine the distinctiveness of these three EF
components
in college students, Miyake et al. used relatively simple tasks
that
were thought to tap each of the three main factors of EF
separately, such as running memory, Stroop, number-letter, to
index UWM, inhibition, and shifting respectively. Performance
on
these tasks was then submitted to confirmatory factor analysis
(CFA), to extract latent variables capturing the unique
6. covariances
among the tasks in each factor battery. Using CFA, they
compared
models with one, two, or three factors. The results indicated
that
the full three-factor model was the best fit model relative to
models
with fewer factors. They concluded that UWM, inhibition, and
shifting were indeed distinguishable, yet correlated EF compo-
nents, namely diversity of EF. Since then, evidences from both
PLOS ONE | www.plosone.org 1 October 2013 | Volume 8 |
Issue 10 | e77770
behavior studies [12–13] and neuroimaging studies [23–24]
have
supported the claim that UWM, inhibition, and shifting are
diverse.
Intriguingly, the three-factor structure obtained in adults has
not been replicated in young children [14–17]. A series of
studies
conducted by Wiebe and colleagues found that in a sample of
7. children between 2 and 6 years of age, the tasks tapping
inhibition
and working memory loaded on a single latent factor, that is,
inhibition and working memory were not separable [14–16].
Similar to the findings of Wiebe and colleagues, Hughes, Ensor,
Wilson, and Graham found that a single-factor structure best
captured the relationship among working memory, inhibition,
and
planning at the ages of 4 and 6 in a longitudinal study [17].
Contrary to the studies with young children, previous research
focused on middle childhood and adolescence has reported
mixed
results [18–22]. In a group of 7–9-year-old children, Brydges,
Reid, Fox, and Anderson observed that a single-factor model
was
sufficient to account for performances on a battery of tasks
tapping
UWM, inhibition, and shifting [18]. However, some researchers
found that with slightly older children, two of the three
executive
components might be distinguishable [19–20]. For example, in
8. children aged 9 to12 years, a two-factor model including UWM
and shifting best accounted for EF performance after controlling
for what they called non-executive factors (i.e., naming factor,
participants were required to rapidly name geometrical figures,
digits, or letters in tasks loading the naming factor) [19]. A
two-
factor model was also suggested for 11–12 year olds by St
Clair-
Thompson and Gathercole who used exploratory factor analysis
to
identify two executive factors: inhibition and UWM [20].
Finally,
some research that included still older children has provided
evidence for a three-factor model [21–22]. For instance, the
study
by Wu et al. supported the three-factor structure including
UWM,
inhibition, and shifting in 7–14-year-old children [21]. Similar
results were reported by Lehto, Juujärvi, Kooistra, and
Pulkkinen
in a sample of children aged 8 to 13 years [22].
From this brief review of the developmental work, it appears
9. that one potential reason for the mixed results is because the
studies used participants from different age spans [18–20]. The
studies that find for one-factor structure tend to include much
younger children than the studies that find evidence for three-
factor structure. To date, studies have not been able to address
the
possibility that there may be developmental changes in the
factor
structure of EF. Most of the research with school-aged children
collapsed participants across the age range they studied, for
example, from middle childhood to post-adolescence [19,21–
22].
Doing so may have obscured important developmental changes
in
the factor structure of EF that we might predict to be present
based upon findings. Moreover, UWM, inhibition, and shifting
have different developmental trajectories during that period,
specifically improve quickly during middle childhood, and
gradually mature through adolescence [25–28]. A second
possible
10. reason for the mixed results is that different studies used
different
measures to assess the same latent factor. For example, the
latent
factor inhibition was indicated by Eriksen Flankers task and Go/
no-go task in some studies [18], but by Tower of London and
Matching Familiar Figures Test in other studies [22].
Given the developmental differences [25–28], it is necessary to
examine the factor structure of EF across age groups. To date,
there have been just two studies along these lines, with
disparate
findings. In one, Huizinga, Dolan, and van der Molen selected
four age groups (7 years old, 11 years old, 15 years old, and 21
years old) to investigate the relationships of UWM, inhibition,
and
shifting. They did not find that the factor structure of EF
changed
with age in their study, only UWM and shifting were separable
in
all age groups, even in the adult group [28]. In the second,
Shing,
Lindenberger, Diamond, and Davidson divided children and
11. adolescents into three age groups (4–7 years, 7–9.5 years, and
9.5–
14.5 years), and found that the factor structure of EF gradually
separated with age. More specifically, memory maintenance and
inhibitory control were not separable in 4–7 year olds and 7–9.5
year olds, but they were separable in 9.5–14.5 year olds [29].
Their results are difficult to integrate with others, because they
used memory maintenance rather than UWM.
Thus, in the current study, we examined the developmental
differences of the structure of UWM, inhibition, and shifting in
middle childhood and adolescence. Recently, some researchers
argued that the degree of unity or diversity of EF structures may
be
different at different age groups [26,30]. According to this view
and previous findings [18–22,29–30], we hypothesized the
developmental trend in the factor structure of EF may be from a
one- or two-factor model to a three-factor model across
development. Specifically, on the basis of previous findings
found
12. in 7–9 year olds [18,29] and adult sample [2,12], we
hypothesized
a one-factor model of EF (that incorporates UWM, inhibition,
and
shifting) might best explain the performance of 7–9 year olds,
but
that the full three-factor model may best explain the
performance
of older children aged 13–15 years old.
Following the approach of Miyake and his colleagues [2,12], we
used tasks that were designed to tap a single EF component
while
placing minimal demands on other EF components. Performance
on these tasks was then submitted to CFA to characterize the fit
of
five possible models, which include the traditional three-factor
model proposed by Miyake and colleagues, one one-factor
model,
and three two-factor models (see Table 1). To characterize
developmental changes in the factor structure of EF, EF tasks
were
administrated to children and adolescents aged 7–15 years old
13. who were divided into three age groups (7–9 years old, 10–12
years old, and 13–15 years old). This age range and group
division
was chosen because it captures the period over which previous
studies have suggested that the factor structure of EF changes
from
having a one-factor structure (7–9 years old) [18,29] to a more
diverse structure [25,29]. Finally, because CFA is a large
sample
technique (sample size should be at least 100), and the use of
larger
samples tend to provide more precise and stable factor
structure,
the sample size in each age group was relatively large in
comparison to other studies (n = 140–165).
Methods
Ethics Statement
Guardians and teachers were given a letter explaining the
purpose of this study. Written informed consent was obtained
from
each participant’s guardian. All procedures were approved by
the
14. ethics committee of the State Key Laboratory of Cognitive
Neuroscience and Learning, Beijing Normal University.
Participants
A total of 457 children and adolescents were recruited from
three primary schools and three junior middle schools of a
large-
sized town located in east China. All participants received a
notebook as gift for their participation. According to the
previous
findings [18,25,29], the sample was divided into three age
groups:
7–9 years (M = 8.78 years, SD = 0.57, 73 boys, n = 140), 10–12
years (M = 11.59 years, SD = 0.88, 84 boys, n = 165), and 13–
15
years (M = 14.41 years, SD = 0.86, 76 boys, n = 152). Most
participants came from rural areas of China, where most
families
belonged to low to middle socioeconomic status (SES) group.
The highest education level of their parents was as follows:
The Structure of Executive Function
PLOS ONE | www.plosone.org 2 October 2013 | Volume 8 |
Issue 10 | e77770
15. approximately 4.3% of parents had earned an undergraduate
education degree, 3.3% had received a junior college education
degree, 18.5% had gotten a high/technical secondary school
diploma, 59.8% had received a junior high school diploma, and
14.3% had a diploma of primary school. We used the non-verbal
Raven Standard Progressive Matrices (China Revised edition,
SPM-CR, 1989) [31] to assess participants’ intelligence. Based
on
the norm of the Chinese version for each age group, raw scores
of
the SPM-CR were converted to standardized scores. All partic-
ipants had normal intelligence on the basis of the standardized
scores of the SPM-CR, with mean standardized scores between
70.23 and 84.98 (SD, between15.36 and 26.51) in 7–9 year olds,
between 60.58 and 72.09 (SD, between 15.36 and 26.51) in 10–
12
year olds, and between 60.25 and 73.80 (SD, between 18.41 and
29.77) in 13–15 year olds.
16. EF Measures
All participants completed a battery of EF tasks to tap the three
EF components. The tasks were selected based on two
principles.
First, tasks chosen in the present study should be sensitive to
the
development differences of UWM, inhibition, and shifting
during
middle childhood and adolescence. Second, we used relatively
simple tasks that were designed to especially tap one of the
three
executive components while placing minimal demands on others
to avoid the problem of task impurity. Specifically, n-back tasks
and running memory tasks were employed to measure UWM.
Both tasks involve constantly monitoring and updating informa-
tion in working memory. The tasks used to tap inhibition were
the
go/go-go task and color-word Stroop task. Both tasks require
deliberately inhibiting prepotent responses. The tasks used to
tap
shifting were number-pinyin task and dots-triangles task. Both
tasks require shifting between mental sets. Because of possible
17. cultural differences between western in which these tasks were
originally developed, and the current context (rural China), we
adapted those classic tasks as necessary to ensure that they were
suitable for Chinese children. All EF tasks were computerized,
and
were programmed in E-Prime (Version 1.2, Psychological
Software Tools).
Measures of UWM. N-back task. There were two conditions
in the n-back task, 1-back and 2-back, using the same stimulus
materials (adapted from Jaeggi, Buschkuehl, Jonides and Perrig,
2008) [32]. In each condition, a small purple square was
presented
at one of eight different locations within a bigger white square.
In
the 1-back condition, the participants were told to press the
‘‘same’’ key if the location where the small purple square
appeared
was the same as the stimulus shown immediately prior to this
square and to press the ‘‘different’’ key if the location at which
the
18. small purple square was presented was different from the one
prior. In the 2-back condition, participants were instructed to
press
the ‘‘same’’ button whenever the stimulus at hand matched the
one presented 2 positions back in the sequence and to press
‘‘different’’ whenever the locations were mismatched. In each
condition, there were 16 practice trials followed by 42 target
trials.
Each stimulus was presented for 3000 ms, followed by an 800-
ms
interstimulus interval (ISI). The main dependent variable was
the
proportion of correct responses.
Running memory task. This task was adapted from Van der
Sluis et al. [19]. In this task, participants were presented with
series of digits successively, which varied in length from 3, 5,
7, to 9
digits. Participants were asked to constantly recall the last 3
digits
presented to them. To ensure continuous updating, participants
were asked to say aloud the last 3 digits they had seen,
regardless of
19. where they were in the sequence. Participants achieved this by
adding the latest digit to a cluster and dropping the oldest one,
and
then saying the new cluster of 3 digits out loud. For example, if
the
digits presented were ‘‘5, 7, 3, 1, 6’’, the participants should
have
read ‘‘5…57… 573…731…316’’, and then recalled ‘‘316’’ at
the
end of the trial. The length of the sequences varied
unpredictably
for the participants. The task consisted of 12 target sequences (3
lists of each sequence length), resulting in 84 clusters of digits
to be
recalled. Before the target list began, there were 3 practice
sequences (1 of length 3, 5, 9). Digits within a sequence were
presented serially with 1000-ms per digit, followed by 1000-ms
blank screen. The score was the proportion of digit clusters
recalled correctly.
Measures of inhibition. Go/no-go task. This task was
adapted from Eigsti et al. [33]. Participants were instructed to
20. press the spacebar as quickly as possible whenever a target (go)
stimulus (a square with a left diagonal) was presented (75% of
trials) but to inhibit the response when the non-target (no-go)
stimulus (a square with a vertical line in the middle) appeared
on
the screen (25% of trials). To measure the development of
inhibition in the sample whose age was older than 6 years, the
task
included three conditions: the number of go trials before a no-
go
trial varied as either 2, 4, or 6. The more go trials that precede a
no-go trial, the more difficult it is to inhibit the preponderant
response generated by go trials. The duration of each stimulus
was
500 ms with an ISI ranging from 800 to 1200 ms. This task
consisted of 96 experimental trials and 15 practice trials. The
proportion of successfully inhibited no-go stimuli was the
dependent measure.
Color-word Stroop task (Chinese character version) [34]. In this
task, the four keys (Z, X, N, M) on the keyboard represent the
21. four
colors (red, yellow, blue, and green). Participants were required
to
name the color of a stimulus by pressing the key corresponding
to
the color on each trial. There were three conditions: (1) in the
Table 1. Five alternative models tested in this study.
Models
1. Full three-factor Three EF components are separable, though
correlated
2. One-factor Three EF components are not separable. All tasks
tapping UWM, inhibition, and shifting load on a single latent
factor
Two-factor models
3. UWM & Inhibition-Shifting collapsed UWM is separable
from inhibition and shifting; inhibition and shifting are not
distinguished
4. Shifting & Inhibition-UWM collapsed Shifting is separable
from inhibition and UWM; inhibition and UWM are not
distinguished
5. Inhibition & Shifting-UWM collapsed Inhibition is separable
from shifting and UWM; shifting and UWM are not
distinguished
Note. UWM, updating working memory.
22. doi:10.1371/journal.pone.0077770.t001
The Structure of Executive Function
PLOS ONE | www.plosone.org 3 October 2013 | Volume 8 |
Issue 10 | e77770
baseline condition, participants must name the ink color of
patches
colored red, blue, yellow, or green; (2) in the incongruent
condition, there is a mismatch in the semantic and the color of
Chinese characters (e.g., Chinese character for ‘‘red’’ shown in
green ink), and the participants were asked to judge the printed
color of a word while ignoring its meaning; (3) in the congruent
condition, the color-words were printed in congruent ink colors
(e.g., Chinese character for ‘‘red’’ shown in red ink), and
participants also need to judge the name of color of a word.
This
task included 24 baseline trials in block 1, and 24 incongruent
trials with 6 congruent trials in block 2. The participants also
received two blocks of 20 trials (8 baseline trials in block 1, 10
incongruent trials and 2 congruent trials in block 2) for
23. practice.
Stimuli were presented for 3500 ms, and the ISI was 800 to
1200 ms. The dependent variable was the reaction time (RT)
difference between the trials in the baseline condition and the
trials
in the incongruent condition.
Measures of shifting. Number-pinyin task. This task was
derived from number-letter task used by Rogers and Monsell
[35]
and Miyake et al [2]. In the original number-letter task,
participants switched between classifying numbers (2, 4, 6, and
8
for even; 3, 5, 7, and 9 for odd) and classifying English letters
(G,
K, M, and R for consonant; A, E, I, and U for vowel). In the
current study, we replaced English letters with Chinese pinyins
(b,
p, m, and f for the initial consonant of a Chinese syllable; a, e,
i,
and ü for the simple vowel of a Chinese syllable) since Chinese
pupils are not familiar with the vowels and consonants in
English.
24. A number-pinyin pair (e.g., 3e) was presented in one of the four
quadrants on the screen. The participants were instructed to
judge
whether the number was odd or even when the number-pinyin
pair was presented in one of the bottom quadrants whereas they
were asked to judge whether the pinyin was a consonant or
vowel
when the pair was presented in one of the top quadrants. This
task
consisted of three blocks. The number-pinyin pair was always
presented in one of the bottom quadrants for the first block (30
target trials, 12 practice trials), always in the top quadrants for
the
second block (30 target trials, 12 practice trials), and in the
clockwise rotation around all four quadrants for the third block
(60
target trials, 20 practice trials) in which the participants had to
shift
between the number task and the pinyin task. The duration of
each number-pinyin pair was 6500 ms. After a response was
given,
the next number- pinyin pair was presented. The time interval
25. between the response and the next pair was 1000 ms. The
dependent variable was the difference between the average RTs
on alternation trials in the third block and the average RTs of
the
trials from the first two blocks.
Dots-triangles task. This task was adopted from Huizinga et al.
[28]. Different numbers of red dots or green triangles were
presented in a 464 grid, and there were three to eight dots or
triangles per half of this grid. In the dots task, the participants
were
instructed to decide whether there are more dots in the right or
left
(in block 1, 30 target trials and 10 practice trials). During the
triangles task, the participants had to judge whether there are
more
triangles in the top or bottom (in block 2, 30 target trials and 10
practice trials). In the third block, four ‘‘dots’’ tasks and four
‘‘triangles’’ tasks appeared alternately (72 target trials and 16
practice trials). Each dot or triangle pattern was presented in the
middle of the screen for 3500 ms until a response was given and
26. was then followed by 1000 ms ISI. Similar to the Number-
Pinyin
task, the dependent variable was the difference between the
average RTs of the alternative trials in the third block and the
average RTs of the trials from the first two blocks.
Procedures
All tasks were administered in a quiet classroom. All
participants
were tested for non-verbal Raven standard progressive matrices
in
groups of 8–30 students for 30–40 minutes. The running
memory
task was administered individually for all participants. The
remaining EF tasks were tested individually for 7 and 8 year
olds
and simultaneously in groups of two for 9–15 year olds.
Participants sat at separate tables and used different computers
during simultaneously testing procedures. EF measures took
place
in two sessions. Each session lasted approximately 30–40
minutes
for a total of 60–80 minutes. The tasks administered in Session
1
27. included the Stroop, dots-triangles, 1-back, and 2-back. Tasks
in
Session 2 included the go/no-go, number-pinyin, and running
memory. The interval time of the two sessions was
approximately
1 week. The order of the two sessions was counterbalanced
across
participants. Psychology graduate students who were trained
prior
to testing administered the tests.
Outliers
In each executive task, missing data were identified for any
accuracies and RTs that exceeded 3 standard deviations in each
age group. We also performed bivariate outlier analyses on the
correlations among these tasks designed to tap the three EF
components. Specifically, outliers were identified by computing
leverage, student t, and Cook’s D values. Three participants
were
removed due to these analyses (i.e., levers values.0.05, t values.
|3.00|, or Cook’s D values .1.00). Moreover, we performed a
two-stage trimming procedure for three tasks (Stroop, number-
28. pinyin, and dots-triangles) in which RT acted as the dependent
variable. First, all incorrect trials and trials shorter than 150 ms
(too fast to be meaningful) were excluded from the analysis for
each participant. Second, we followed the same procedures used
in
previous studies [28,35]. If the accuracy of performance was
less
than 55% in one of the conditions in these three tasks, the
corresponding dependent variables of those tasks were coded as
missing (baseline condition and incongruent condition in Stroop
task, alternative condition and repetition condition in dots-
triangles task and number-pinyin task). After the trimming
procedures above, the missing values amounted to 7.4% for 7–9
year olds, 4.2% for 10–12 year olds, and 3.6% for 13–15 year
olds.
Statistical Analysis
Analysis of covariance (ANCOVA) was used to assess age
effects
on each measure with gender as a covariate. To assess the
structure of UWM, inhibition, and shifting, CFA was performed
in
29. Mplus version 6.0 [36] with the maximum likelihood method.
According to past studies, we used multiple fit indices to
evaluate
the fit of each theoretical model, including chi-square (x
2
), x
2
/df,
root-mean-square error of approximation (RMSEA),
comparative
fit index (CFI), and Akaike Information Criterion (AIC) [37].
Models were considered to be good fits with non-significant x
2
values at the 0.05 level, x
2
/df of less than 2, CFI of more than
0.90, RMSEA of less than 0.08, and smaller AIC values [38]. In
all
of the following analyses, the directionality of the dependent
variables on the basis of RT was reversed so that higher scores
indicated better performance.
Results
30. Descriptive Statistics and Significance Test of
Development for each Task
The mean scores, standard deviations, skewness, and kurtosis
for performance on each executive task for each age group were
listed in table 2. All variables showed normal distributions in
each
The Structure of Executive Function
PLOS ONE | www.plosone.org 4 October 2013 | Volume 8 |
Issue 10 | e77770
age group (i.e., absolute value of skewness ,2 and kurtosis ,7)
[39]. Cronbach’s alpha or the split-half (odd–even) correlation
was
computed as index of internal consistency for each of the
variables.
As is shown in table 2, all estimates were higher than 0.78,
indicating reasonable reliability. The zero-order correlations
among these executive tasks were generally low (r = 0.36 or
lower)
in each age group (see Appendix).
For the 2-back, preliminary analyses suggested that the gender
31. difference reached a significant level, though the effect size was
small. Moreover, gender did not interact with age on any tasks.
Even so, we used gender as a covariate in follow-up analysis to
ensure that the effect of age would not be affected by gender.
Analysis of covariance (ANCOVA) with gender as a covariate
resulted in significant main effects of age on all executive
tasks,
F = 3.17,85.92, all p,0.05, g2 = 0.01,0.28 (see table 2). The
findings showed that all executive tasks used in the present
study
were sensitive to the developmental differences in EF across the
three age groups. In addition, post-hoc Bonferroni tests showed
that the performance for the 1-back, 2-back, running memory,
go/
no-go, and Stroop tasks was better in 13–15 year olds than in
10–
12 year olds, and better in 10–12 year olds than in 7–9 year
olds.
However, for the performance on the number-pinyin and dots-
triangles tasks 7–9 year olds did not differ from 10–12 year
olds,
but 13–15 year olds significantly outperformed 10–12 year olds.
32. Confirmation Factor Analysis
Multi-group CFA was carried out to evaluate whether the factor
structure of EF performance was the same across the three age
groups. Guided by existing research, we first established the
best
fitting model for the entire sample (7–15 year olds). The results
of
CFA showed that the fit of the full three-factor model was
better
than the one-factor model and two-factor models (see table 3),
suggesting that these three executive components were distin-
guishable from each other in 7–15 year olds. Next, to assess
whether the three-factor construct was applicable to each age
group (7–9 year olds, 10–12 year olds, and 13–15 year olds),
multi-
group CFA models were established in the three age groups.
First,
a configural invariance model was established as the baseline
model for the multi-group comparison. In this baseline model,
the
configuration of factor loading was set to be identical for each
age
33. group, while parameters (e.g., specific factor loadings, factor
variance, etc.) were free to vary across age groups. This
baseline
model, however, was not successful and the minimum
requirement
of multi-group comparison was not met. This suggested that the
three-factor construct may be appropriate for one of the three
age
groups but not for every age group.
According to our hypothesis that the factor structure of EF may
be different at different age groups, the five alternative models
were tested for each age group separately using CFA. Table 4
presents the fit results of these models in each age group. In 7–
9
year olds, both the one-factor model and full three-factor model
were acceptable models according to the fit indexes (see table
4). In
that case, we should select the simpler model based on
parsimony
principle [14,37], so the one-factor model (Model 2) was
preferred.
34. Furthermore, according to AIC which can be used to compare
competing models [40], the one-factor model is preferred
because
it has smaller AIC than the full three-factor model (see table 4).
The results suggested that UWM, inhibition, and shifting were
not
statistically dissociable in 7–9 year olds, that is, the structure of
EF
was unitary in this age range (see figure 1 A). The same was
true
for 10–12 year olds where the CFA results again suggested that
a
one-factor model (model 2) provided the most parsimonious
account of EF performance (see table 4), which suggested that
the
unitary construct was still appropriate for describing the
relation-
ship of the three components in 10–12 year olds (see figure 1B).
The single latent factor was named Executive Function. For the
Table 2. Descriptive statistics and age group differences on all
executive tasks in each age group.
7–9 years old 10–12 years old 13–15 years old ANCOVA
35. Tasks M(SD) Ske Kur M(SD) Ske Kur M(SD) Ske Kur F P g
2
Reliability
1-back (%) 86.21(10.58) 21.42 1.90 91.12(6.36) 21.18 2.09
93.41(4.69) 2.51 2.06 33.13 ,.001 .13 .82
a
2-back (%) 58.64(13.68) .44 2.32 66.30(13.83) .08 2.70
71.22(13.77) 2.28 2.76 29.52 ,.001 .12 .78a
Running Memory (%) 69.99(12.36) .04 2.47 80.90(10.21) 2.25
2.85 86.66(9.81) 2.69 2.20 85.92 ,.001 .28 .84
a
Go/no-go (%) 50.21(15.62) 2.02 2.69 58.42(18.06) 2.12 2.68
69.37(17.85) 2.46 2.52 43.10 ,.001 .16 .91
b
Stroop (ms) 415.47(190.62) .18 2.41 309.48(185.82) .58 2.01
230.29(115.01) .55 .36 41.57 ,.001 .16 .94b
Number-pinyin (ms) 782.88(307.07) .04 .90 722.03 (284.28) .46
.19 608.42(236.76) .88 .20 15.28 ,.001 .01 .83
b
Dots-triangles (ms) 611.46 (328.82) .48 2.07 591.55(284.37) .65
.19 543.05(289.69) .74 .20 20.59 ,.001 .08 .92
b
Note. Ske,Skewness, Kur, kurtosis.
a
Reliability was calculated using Cronbach’s alpha.
b
36. Reliability was calculated by adjusting split-half (odd–even)
correlations with the Spearman-Brown prophecy formula.
doi:10.1371/journal.pone.0077770.t002
Table 3. Goodness of fit indices for alternative CFA models
for total sample.
Models x
2
df P x
2
/df RMSEA CFI AIC
1. Full three-factor
model
19.89 11 .05 1.81 .04 .97 71.74
2. One-factor 62.04 14 .00 4.43 .09 .86 104.04
Two-factor
3. UWM & Inhibition-
Shifting collapsed
28.08 13 ,.01 2.16 .05 .96 100.98
4. Shifting & Inhibition-
UWM collapsed
37.16 13 ,.01 2.86 .06 .93 100.31
5. Inhibition & Shifting -
37. UWM collapsed
29.02 13 ,.01 2.23 .09 .78 98.52
Note. The best fitting model is indicated in bold. UWM,
updating working
memory,
RMSEA, root-mean-square error of approximation; CFI,
comparative fit index;
AIC, Akaike Information Criterion.
doi:10.1371/journal.pone.0077770.t003
The Structure of Executive Function
PLOS ONE | www.plosone.org 5 October 2013 | Volume 8 |
Issue 10 | e77770
13–15 year olds, however, there was a shift for them, the three-
factor model (model 1) provided the best fit of the five models
(see
table 4). These findings suggest that the latent variables of
UWM,
inhibition, and shifting each constituted statistically separable
component of 13–15 year old children’s EF performance. In
other
words, for the older group, the three EF components were
clearly
distinguishable, though they are moderately correlated with
38. each
other for children aged 13 and older (see figure 1 C).
We further examined whether the regression coefficients (factor
loadings) of the observed indicators of Executive Function (the
single latent factor) were identical in both 7 to 9 years of age
and
10 to12 years of age. To address this issue, multi-group CFA
was
conducted. We first established a configural invariance model.
The
fit of this model displayed acceptable fit to the data, x
2
= 29.90,
x
2
/df = 1.07, CFI = 0.98, RMSEA = 0.02. Then, we nested within
the configural invariance model, a metrical measurement invari-
ance model in which the factor loadings were constrained to be
equal across the two groups in addition to the loading patterns.
The fit of the metrical measurement invariance model was not
satisfactory, particularly with respect to the value of CFI,
39. x
2
= 42.96, x
2
/df = 1.21, CFI = 0.87, RMSEA = 0.04. A direct
chi-square comparison also indicated that there was a
significant
difference between the configural invariance model and the
metrical measurement invariance model (Dx
2
= 13.06, Ddf = 6,
p,0.05), suggesting that the factor loadings differed between the
two younger age groups (see figure 1A and figure 1B).
Executive
Function (the single latent factor) explained 30%, 23%, 25%,
12%, and 26% of the variance in the 1-back, 2-back, running
memory, go/no-go, and number-pinyin, respectively, in 7–9 year
olds, but only 15%, 16%, 21%, 7%, and 10% of the variance in
10–12 year olds.
Discussion
The present study investigated the developmental changes in
the factor structure of EF. We administrated a battery of
40. appropriate measures tapping UWM, inhibition, and shifting in
a large sample of Chinese children and adolescents, and then
used
CFA to characterize the latent factor structure of EF among
three
age groups: 7–9 years, 10–12 years, and 13–15 years. The
results
of CFA indicated that over development, the factor structure of
EF
changed from a one-factor to a full three-factor model. Specifi-
cally, a single factor accounted for EF performance in both 7–9
years and 10–12 years, though even between these periods there
was some development in the specific factor loading patterns.
For
the oldest group, however, a three-factor model best accounted
for
the performance of UWM, inhibition, and shifting. That is, the
three EF components separated into three distinct components at
13–15 years of age. Put another way, the results of CFA
indicated
that the structure of the three components developed from unity
to
41. diversity. Our findings provide evidence for the age
differentiation
hypothesis which postulates that the structure of cognitive
abilities
develops from a relatively unified, general ability to more
differentiated, specific cognitive abilities with child
development
[41–42].
Our results are similar to those of Shing et al. [29], who also
found that the specific executive components gradually
separated
across age groups. However, Shing et al. only examined the
separation of memory maintenance and inhibitory control, and
found that they were separable in 9.5–14.5 years. In the current
study, we found that the constructs of UWM, inhibition, and
shifting were distinct at 13–15 years of age but not earlier. The
slight inconsistency between these results may come from the
different tasks chosen in the two studies. Specifically, the tasks
used
in the study by Shing et al. only assessed set maintenance
whereas
42. Table 4. Goodness of fit indices for alternative CFA models in
each age group.
Models x
2
df P x
2
/df RMSEA CFI AIC
7–9 years old *1. Full three-factor 14.38 12 .37 1.20 .03 .96
59.34
2. One-factor 15.65 14 .34 1.12 .03 .95 56.64
Two-factor
3. UWM & Inhibition-Shifting collapsed 23.87 13 .03 1.84 .08
.68 67.87
4. Shifting & Inhibition- UWM collapsed N.A.
5. Inhibition & Shifting -UWM collapsed 16.27 13 .24 1.25 .04
.89 60.27
10–12 years old 1. Full three-factor 22.10 11 .02 2.01 .08 .81
68.15
2. One-factor 19.24 14 .30 1.37 .05 .95 57.44
Two-factor
3. UWM & Inhibition-Shifting collapsed 26.80 13 .01 2.06 .08
.71 70.80
43. 4. Shifting & Inhibition- UWM collapsed 19.71 13 .11 1.52 .06
.90 61.86
5. Inhibition & Shifting -UWM collapsed 28.10 13 .01 2.16 .08
.68 67.74
13–15 years old 1. Full three-factor 15.72 11 .15 1.43 .05 .95
63.72
2. One-factor 32.51 14 .00 2.32 .09 .74 74.51
Two-factor
3. UWM & Inhibition-Shifting collapsed 24.05 13 .03 1.85 .08
.85 68.05
4. Shifting & Inhibition- UWM collapsed 24.95 13 .03 1.88 .08
.83 68.49
5. Inhibition & Shifting -UWM collapsed 29.02 13 .01 2.23 .09
.78 73.02
Note. The best fitting model is indicated in bold. UWM,
updating working memory, RMSEA, root-mean-square error of
approximation; CFI, comparative fit index; AIC,
Akaike Information Criterion. N. A., not admissible.
*not positive definite residual covariance matrix.
doi:10.1371/journal.pone.0077770.t004
The Structure of Executive Function
PLOS ONE | www.plosone.org 6 October 2013 | Volume 8 |
Issue 10 | e77770
44. Figure 1. Best fit model in each age group. RM = running
Memory, G/NG = go/no-go, N–P = number-Pinyin, D–T = dots –
triangles. All
standardized parameters were significant (P,0.05) except the
loading of the Stroop task (dotted line) in 7–9 year olds. A for
7–9 years old, B for 10–12
years old, C for 13–15 years old.
doi:10.1371/journal.pone.0077770.g001
The Structure of Executive Function
PLOS ONE | www.plosone.org 7 October 2013 | Volume 8 |
Issue 10 | e77770
ours included the requirement to actively update working
memory
representations. It is well known that active updating of
working
memory has a protracted developmental time course relative to
maintenance [43], which may delay the differentiation of EF
structure in our study.
However, the specific timing of our findings dovetails nicely
with documented changes in cortical functioning that are
happening around the same time in development. EF is often
linked to the functioning of the prefrontal cortex (PFC) [8–9],
45. and
the development of EF appears to be closely linked to the
development of PFC [29]. The PFC goes through dynamic
structural and functional changes around the age of 12. From
the
structural perspective, longitudinal neuroimaging studies have
demonstrated that gray matter in the PFC increased throughout
childhood with a maximum size occurring at approximately 12
years, followed by a sharp loss after 12 years of age [44]. At the
functional level, there are critical changes in the patterns of
PFC
activation that are elicited during EF performance, including
enhanced activation in critical regions and attenuation in others
between 9 years and 12 years [45]. These changes usually result
in
more focal and less diffuse PFC activation as children transition
from childhood to adolescence. The structure and function of
PFC
change around 12 years old may be associated with the
separability of EF structure found in present study.
46. The results of this study run counter to those of Huizinga et al.
[28] who found evidence of only the two latent factors (UWM
and
shifting) which were distinguishable in children as well as
adults.
The discrepancy between those findings and our own could be
attributed to the characteristics of the three inhibitory tasks.
The
three inhibition tasks used in their study (stop-signal, Eriksen
flanker, and smiley pictures) measured three different types of
inhibitory abilities, so a common inhibition factor could not be
extracted, which also led to the inconsistent results in the adult
sample between their study and past adult studies [2]. However,
the two tasks (go/no-go, color-word Stroop) used in our study
were
specifically designed to rely on proponent response inhibition
and
little else [46], so a common inhibition factor can be extracted
in
13–15 years. Also, the age divisions used by Huizinga et al.
differed from ours, and, perhaps most important, the sample
size
47. in each age group in the study of Huizinga et al. was limited,
especially the youngest age group (n = 71).
There were some limitations of our study that should be
addressed in future research. One limitation concerns the
missing
data, especially in the young age group. After following
standard
practices for data trimming, 7.4% of 7–9 year olds data was
missing. This result may be because the three EF components
undergo rapid improvements during childhood and adole-
scence, so individual differences were considerable. Second, the
participants in the present study came from lower SES families.
Recent evidence has shown that children from low SES families
experience slower EF development relative to children in higher
SES categories, especially in working memory and inhibitory
control [47–48]. The slow development of cognitive abilities
may
delay the extent to which those abilities are statistically
separable
from a single EF factor [41]. In any case, studies with children
48. from diverse SES backgrounds may help to establish the
generalizability of the patterns we reported here. Finally, for
the
youngest group, performance on the Stroop task did not load on
the single latent factor (Executive Function) in 7–9 year olds,
which was not expected. However, the Stroop task loaded on the
single latent factor in one-factor model for the 10–12 year olds,
and inhibition factor in the three-factor model for the 13–15
year
olds. Given these limitations, it would be worthwhile to confirm
the findings using different tasks, and extend this work with
different EF components in future study.
To conclude, using a relatively large sample, the present study
found that the factor structure of EF changed with children’s
transition from middle childhood to adolescence. In particular, a
single-factor model better accounted for younger children’s EF
performance, whereas a three-factor model considering UWM,
inhibition, and shifting as separate latent variables provided the
best fit for older children’s performance. Our findings further
49. confirmed the view that the underlying nature of children’s EF
skills vary with age, and suggest that the neurocognitive
systems
that support different aspects of EF become increasingly
specific
and dissociated with age.
Supporting Information
Table S1 Correlations between executive tasks for each
group. Note. * p,.05, **p,.01.
(DOC)
Acknowledgments
We thank all the participants involved in this study for their
kindly
cooperation. We are also grateful to those six schools for
permitting to do
this research. We also would like to express our gratitude to
anonymous
reviewers for their helpful comments.
Author Contributions
Conceived and designed the experiments: FX YH XR.
Performed the
50. experiments: YH TW. Analyzed the data: YH MS TW CL XR.
Contributed reagents/materials/analysis tools: YH MS. Wrote
the paper:
FX YH MS TW XR.
References
1. Miller EK, Cohen JD (2001) An integrative theory of
prefrontal cortex function.
Annual review of neuroscience 24(1): 167–202.
2. Miyake A, Friedman NP, Emerson MJ, Witzki AH, Howerter
A, et al. (2000)
The unity and diversity of executive functions and their
contributions to complex
‘‘frontal lobe’’ tasks: A latent variable analysis. Cognitive
Psychology 41(1): 49–
100.
3. Smith EE, Jonides J (1999) Storage and executive processes
in the frontal lobes.
Science 283(5408): 1657–1661.
4. Welsh MC, Pennington BF, Groisser DB (1991) A normative-
developmental
study of executive function: A window on prefrontal function in
children.
51. Developmental Neuropsychology 7(2): 131–149.
5. Ren X, Schweizer K, Xu F (2013) The sources of the
relationship between
sustained attention and reasoning. Intelligencce 41: 51–58.
6. Burns P, Riggs KJ, Beck SR (2011) Executive control and the
experience of
regret. Journal of experimental child psychology 111(3): 501–
515.
7. Diamond A, Barnett WS, Thomas J, Munro S (2007)
Preschool program
improves cognitive control. Science 318(5855): 1387–1388.
8. Garon N, Bryson SE, Smith IM (2008) Executive function in
preschoolers: A
review using an integrative framework. Psychological Bulletin
134(1): 31–60.
9. Smith EE, Jonides J (1999) Storage and executive processes
in the frontal lobes.
Science 283(5408): 1657–1661.
10. Nigg JT (2000) On inhibition/disinhibition in developmental
psychopathology:
views from cognitive and personality psychology and a working
inhibition
taxonomy. Psychological Bulletin 126(2): 220–246.
52. 11. Monsell S (2003) Task switching. Trends in cognitive
sciences 7(3): 134–140.
12. Friedman NP, Miyake A, Corley RP, Young SE, DeFries JC,
et al. (2006) Not all
executive functions are related to intelligence. Psychological
Science 17(2): 172–
179.
13. Fisk JE, Sharp CA (2004) Age-related impairment in
executive functioning:
updating, inhibition, shifting, and access. Journal of Clinical
and Experimental
Neuropsychology 26(7): 874–890.
14. Wiebe SA, Sheffield T, Nelson JM, Clark CAC, Chevalier
N, et al. (2011) The
structure of executive function in 3-year-olds. Journal of
experimental child
psychology 108(3): 436–452.
The Structure of Executive Function
PLOS ONE | www.plosone.org 8 October 2013 | Volume 8 |
Issue 10 | e77770
15. Wiebe SA, Espy KA, Charak D (2008) Using confirmatory
53. factor analysis to
understand executive control in preschool children: I Latent
structure.
Developmental Psychology 44(2): 575–587.
16. Espy KA, Sheffield TD, Wiebe SA, Clark CAC, Moehr MJ
(2010) Executive
control and dimensions of problem behaviors in preschool
children. Journal of
Child Psychology and Psychiatry 52(1): 33–46.
17. Hughes C, Ensor R, Wilson A, Graham A (2009) Tracking
executive function
across the transition to school: A latent variable approach.
Developmental
Neuropsychology 35(1): 20–36.
18. Brydges CR, Reid CL, Fox AM, Anderson M (2012) A
unitary executive
function predicts intelligence in children. Intelligence 40(5):
458–469.
19. Van der Sluis S, De Jong PF, Van der Leij A (2007)
Executive functioning in
children, and its relations with reasoning, reading, and
arithmetic. Intelligence
35(5): 427–449.
20. St Clair-Thompson HL, Gathercole SE (2006) Executive
functions and
achievements in school: Shifting, updating, inhibition, and
working memory.
54. The Quarterly Journal of Experimental Psychology 59(4): 745–
759.
21. Wu KK, Chan SK, Leung PWL, Liu WS, Leung FLT, et al.
(2011) Components
and Developmental Differences of Executive Functioning for
School-Aged
Children. Developmental Neuropsychology 36(3): 319–337.
22. Lehto JE, Juujärvi P, Kooistra L, Pulkkinen L (2003)
Dimensions of executive
functioning: Evidence from children. British Journal of
Developmental
Psychology 21(1): 59–80.
23. Collette F, Van der Linden M, Laureys S, Delfiore G,
Degueldre C, et al. (2005)
Exploring the unity and diversity of the neural substrates of
executive
functioning. Human Brain Mapping 25(4): 409–423.
24. Wager TD, Smith EE (2003) Neuroimaging studies of
working memory.
Cognitive, Affective, & Behavioral Neuroscience 3(4): 255–
274.
25. Anderson P (2002) Assessment and development of
executive function (EF)
during childhood. Child Neuropsychology 8(2): 71–82.
26. Best JR, Miller PH (2010) A developmental perspective on
executive function.
Child Development 81(6): 1641–1660.
55. 27. Davidson MC, Amso D, Anderson LC, Diamond A (2006)
Development of
cognitive control and executive functions from 4 to 13 years:
Evidence from
manipulations of memory, inhibition, and task switching.
Neuropsychologia
44(11): 2037–2078.
28. Huizinga M, Dolan CV, van der Molen MW (2006) Age-
related change in
executive function: Developmental trends and a latent variable
analysis.
Neuropsychologia 44(11): 2017–2036.
29. Shing YL, Lindenberger U, Diamond A, Li SC, Davidson
MC (2010) Memory
maintenance and inhibitory control differentiate from early
childhood to
adolescence. Developmental Neuropsychology 35(6): 679–697.
30. Senn TE, Espy KA, Kaufmann PM (2004) Using path
analysis to understand
executive function organization in preschool children.
Developmental Neuro-
psychology 26(1): 445–464.
31. Zhang HC, Wang XP (1898) standardization research on
Raven’s standard
progressice matrices in China. Acta Psychology Sinica 21(2):
113–121.
56. 32. Jaeggi SM, Buschkuehl M, Jonides J, Perrig WJ (2008)
Improving fluid
intelligence with training on working memory. Proceedings of
the National
Academy of Sciences 105(19): 6829–6833.
33. Eigsti IM, Zayas V, Mischel W, Shoda Y, Ayduk O, et al.
(2006) Predicting
cognitive control from preschool to late adolescence and young
adulthood.
Psychological Science 17(6): 478–484.
34. Leon-Carrion J, Garcı́a-Orza J, Pérez-Santamarı́a FJ (2004)
Development of the
inhibitory component of the executive functions in children and
adolescents.
International Journal of Neuroscience 114(10): 1291–1311.
35. Rogers RD, Monsell S (1995) Costs of a predictible switch
between simple
cognitive tasks. Journal of Experimental Psychology: General
124(2): 207–231.
36. Muthén LK, Muthén BO (2010) Mplus user’s guide (6th ed).
Los Angeles CA:
Muthén & Muthén.
37. Bentler PM, Bonett DG (1980) Significance tests and
57. goodness of fit in the
analysis of covariance structures. Psychological Bulletin 88(3):
588–606.
38. Byrne M (1989) A primer of LISREL: Basic applications
and programming for
confirmatory factor analytic models. New York: Springer-
Verlag.
39. Curran PJ, West SG, Finch JF (1996) The robustness of test
statistics to non-
normality and specification error in confirmatory factor
analysis. Psychological
Methods 1(1): 16–29.
40. Schermelleh-Engel K, Moosbrugger H, Müller H (2003)
Evaluating the fit of
structural equation models: Tests of significance and descriptive
goodness-of-fit
measures. Methods of psychological research online 8(2): 23–
74.
41. Tucker-Drob EM (2009) Differentiation of cognitive
abilities across the life span.
Developmental psychology 45(4): 1097–1118.
42. Garrett HE (1946) A developmental theory of intelligence.
American
58. Psychologist 1(9): 372–378.
43. Crone EA, Wendelken C, Donohue S, Van Leijenhorst L,
Bunge SA (2006)
Neurocognitive development of the ability to manipulate
information in working
memory. Proceedings of the National Academy of Sciences
103(24): 9315–9320.
44. Giedd JN, Blumenthal J, Jeffries NO, Castellanos FX, Liu
H, et al. (1999) Brain
development during childhood and adolescence: a longitudinal
MRI study.
Nature neuroscience 2: 861–862.
45. Durston S, Davidson MC, Tottenham N, Galvan A, Spicer J,
et al. (2006) A shift
from diffuse to focal cortical activity with development.
Developmental science
9(1): 1–8.
46. Friedman NP, Miyake A (2004) The relations among
inhibition and interference
control functions: a latent-variable analysis. Journal of
Experimental Psychology:
General 133(1): 101–135.
47. Farah MJ, Shera DM, Savage JH, Betancourt L, Giannetta
59. JM, et al. (2006)
Childhood poverty: Specific associations with neurocognitive
development.
Brain research 1110(1): 166–174.
48. Noble KG, Norman MF, Farah MJ (2004) Neurocognitive
correlates of
socioeconomic status in kindergarten children. Developmental
science 8(1): 74–
87.
The Structure of Executive Function
PLOS ONE | www.plosone.org 9 October 2013 | Volume 8 |
Issue 10 | e77770
Copyright of PLoS ONE is the property of Public Library of
Science and its content may not
be copied or emailed to multiple sites or posted to a listserv
without the copyright holder's
express written permission. However, users may print,
download, or email articles for
individual use.
RESEARCH Open Access
The face of appearance-related social pressure:
60. gender, age and body mass variations in peer
and parental pressure during adolescence
Susanne Helfert* and Petra Warschburger
Abstract
Background: Appearance-related social pressure plays an
important role in the development of a negative body
image and self-esteem as well as severe mental disorders during
adolescence (e.g. eating disorders, depression).
Identifying who is particularly affected by social pressure can
improve targeted prevention and intervention, but
findings have either been lacking or controversial. Thus the aim
of this study is to provide a detailed picture of
gender, weight, and age-related variations in the perception of
appearance-related social pressure by peers and
parents.
Methods: 1112 German students between grades 7 and 9 (mean
age: M = 13.38, SD = .81) filled in the
Appearance-Related Social Pressure Questionnaire (German:
FASD), which considers different sources
(peers, parents) as well as various kinds of social pressure (e.g.
teasing, modeling, encouragement).
Results: Girls were more affected by peer pressure, while
gender differences in parental pressure seemed
negligible. Main effects of grade-level suggested a particular
increase in indirect peer pressure (e.g. appearance-
related school and class norms) from early to middle
adolescence. Boys and girls with higher BMI were particularly
affected by peer teasing and exclusion as well as by parental
encouragement to control weight and shape.
Conclusion: The results suggest that preventive efforts targeting
body concerns and disordered eating should
61. bring up the topic of appearance pressure in a school-based
context and should strengthen those adolescents who
are particularly at risk - in our study, girls and adolescents with
higher weight status. Early adolescence and school
transition appear to be crucial periods for these efforts.
Moreover, the comprehensive assessment of appearance-
related social pressure appears to be a fruitful way to further
explore social risk-factors in the development of a
negative body image.
Keywords: Peer pressure, Parental pressure, Adolescence,
Gender, Age, BMI
Factors influencing the development of a negative body
image during adolescence have received increasing at-
tention due to the fact that body dissatisfaction is highly
prevalent among adolescents in western society and is
also one of the main predictors of low self-esteem, de-
pression, and not least of all disordered eating [1-3].
Sociocultural influences are particularly relevant in this
process. Thompson’s Tripartite Influence Model [4] of
body dissatisfaction and Stice’s Sociocultural Model of
Disordered Eating [5] have identified media, peers, and
parents as the three formative sociocultural influences.
Many studies have emphasized the crucial role of per-
ceived appearance-related social pressure in the develop-
ment of body dissatisfaction and disordered eating. Thus,
social agents – especially peers and parents, who are
closest to the adolescent – both consciously and uncon-
sciously convey and enhance appearance-related norms
through direct and indirect interactions [5,6]. Peers and
parents promote the construction of beauty ideals, norms,
and standards and highlight the importance of appear-
ance. Numerous studies have investigated different aspects
of peer [e.g. 1,7-9] and parental pressure [e.g. 10-16].
63. (see Figure 1).
Up to now, research has provided important findings
on the impact of single types of social pressure and gen-
eral behavioral mechanisms. However, in order to
explain the development of negative body image and de-
sign targeted prevention approaches, we must also find
out who is particularly faced with social pressure. The fol-
lowing sections will attempt to summarize the knowledge
on variations according to individual characteristics con-
sidering gender-, age, and weight-related variations.
Gender variations
Because studies on social pressure have mostly derived
from eating disorder and body image research, they have
often concentrated on girls, for whom they reported a
higher amount of appearance-related influences from
friends [e.g. 16,18], more fear of exclusion by peers be-
cause of one’s appearance [19] and a greater importance
of school and class norms [20]. These findings appear
quite plausible with regard to the particular emphasis
placed on female beauty and appearance in western soci-
ety. However, during the last ten years research has also
considered boys and revealed that some of the gender
differences might be due to inadequate instruments for
boys (i.e., only focusing on the thin ideal [21,22]). Conse-
quently, studies that used measures without that bias
suggested comparable processes of appearance-related
interactions with friends and social exclusion for both
girls and boys [7,23].
Findings regarding gender differences involving paren-
tal pressure have been sparser but therefore less contro-
versial. They predominantly support the conclusion that
appearance is more heavily emphasized among girls.
64. Consequently, girls perceived a greater extent of paren-
tal appearance norms and modeling behavior (e.g.,
parental concerns with body shape, efforts to look good
[6,16,24]). Interestingly, studies investigating parental
encouragement to control weight and shape found no
gender difference [13,16,25]. However, this might be due
to the focus on encouragement to diet, which might be
used by parents regardless of their child’s gender when the
child is at risk of becoming overweight. We suppose that
if an operationalization of “encouragement” without the
bias towards the thin ideal is applied, gender differences
might occur. Concerning parental disregard (i.e., injustice
and ignorance) studies are rare. The study of Meesters
et al. [13] among Dutch adolescents aged 10 to 16 pro-
vided important suggestions regarding the influential role
of parental rejection or insecure attachment in the devel-
opment of body concerns but could not find gender varia-
tions. However, this aspect of parental pressure requires
further investigation.
Findings on peer and parental teasing have been par-
ticularly inconsistent. While in some studies [26] girls
were more frequently faced with peer teasing, others did
not find any gender difference [18,27] or even found
more teasing experiences among boys [7,16]. The same
applies with parental teasing. Some studies did not find
Peer
Pressure
Parental
Pressure
Peer Teasing
(intended kinds of verbal and non-
65. verbal provocations)
Exclusion
(feeling of being ignored and
excluded from social events
because of one s appearance)
School & Class Norms
(pressure by appearance norms and
the emphasis on appearance in
school and class)
Modeling by Friends
(pressure by appearance standards
and efforts of friends)
Parental Teasing
(intended kinds of verbal and non-
verbal provocations)
Injustice & Ignorance
(feeling of only being accepted
when looking good)
Parental Encouragement
(intended but not obviously negative
comments to control weight/shape)
Parental Norms & Modeling
(pressure by parental standards and
66. efforts regarding appearance)
Appearance-Related Social Pressure
Figure 1 Considered aspects of appearance-related social
pressure.
Helfert and Warschburger Child and Adolescent Psychiatry and
Mental Health 2013, 7:16 Page 2 of 11
http://www.capmh.com/content/7/1/16
a gender difference [6,16] and others have revealed that
girls perceive more parental teasing [24,27]. These in-
consistencies might result from the measurement of
teasing as isolated indices or as combinations of peer
and parental teasing. Hence, validity and reliability might
have been restricted.
Age-related variations
Developmental theories on the transformation of rela-
tionships with peers and parents [28] suggest that social
pressure might change throughout adolescence. Further,
the gender intensification hypothesis of Hill and Lynch
[29] suggests that pressure from peers and parents to
conform to gender roles, behavior and appearance stan-
dards intensifies during adolescence. However, only a
few studies have investigated developmental effects in
the field of social pressure and reported a growing influ-
ence of friends and an increase in appearance pressure
by other peers (e.g., schoolmates) during middle adoles-
cence [1,7]. In addition, Dohnt and Tiggemann [30] pro-
vided interesting findings on the impact of school and
class norms among elementary school girls in the first
four years of formal schooling. While girls in the first
67. year at school thought that their peers would desire a
larger figure, girls from grade two to four already as-
sumed that their peers desired a thinner figure. These
results suggest that orientation towards a certain body
ideal as well as appearance-related school and class
norms develop very early. Interestingly, Chen and Jackson
[31] reported an age-gender interaction among a sample
of Chinese adolescents, suggesting that appearance
conversations between friends might increase with age
only among girls but not among boys. However, they
could not establish a comparable effect regarding gen-
eral appearance-related pressure. In contrast to a prob-
able increase in appearance-related interactions, teasing
and exclusion proved to be rather stable during adoles-
cence [7]. Jones [1] even found a decrease in reported
teasing among adolescents from grades 10 to 11, which
indicates that teasing becomes less important with the
transition to adulthood.
To our knowledge, no study exists that considered
age-related variations in parental pressure, but develop-
mental theories have suggested a decrease in adult
orientation and an increase in peer orientation for
appearance-related issues beginning in early adolescence
[28,32,33]. This might lead to the conclusion that paren-
tal pressure has either a stable or even a shrinking rele-
vance during adolescence. However, Striegel-Moore and
Kearney-Cooke [34] revealed that American parents
become more critical of their children’s physical attract-
iveness as the children grow older. Hence, appearance-
related pressure (e.g., encouragement to control weight
and shape) might also increase.
However, because findings on parental pressure have
been incomplete and knowledge of age-related trends in
peer pressure comes from a few predominantly cross-
68. sectional studies, we should be cautious about drawing
conclusions for age-related trends.
Body mass variations
Many studies have examined stigmatization of over-
weight and obese persons. As appearance stigmatization
is a distinct and serious form of social pressure, includ-
ing peer teasing and exclusion alike, it can be concluded
that overweight persons per se experience more of these
kinds of pressure [9]. Beyond that, a few studies have
also suggested a higher amount of teasing experiences
among underweight adolescents [26]. The results of
Jones and Crawford [7] even suggest an interaction of
weight and gender: While particularly overweight girls
experienced teasing and fear of exclusion, underweight
boys displayed the highest scores. These results were
interpreted with regard to the different beauty ideals for
men and women: Girls who do not fit the slim norm
and boys who do not fit the bulky, muscular male ideal
are more exposed to stigmatization. However, the find-
ings have left the question unanswered whether deviat-
ing from normal weight per se increases the risk of
being subjected to more direct peer pressure or whether
weight-related variations are different for girls and boys.
To our knowledge, only Jones and Crawford [7] have
considered weight variations in more subtle forms of
peer pressure and found that adolescents with higher
BMI perceived stronger influences from friends and gen-
eral appearance pressure by peers (e.g., schoolmates).
Studies reporting relationships between weight status
and parental pressure are even sparser. A few studies
reported higher scores in parental teasing among over-
weight boys and girls [24,26,35]. Regarding parental en-
couragement to lose weight, Wertheim et al. [25] found
69. a moderate positive association with weight status for
early adolescent boys and girls alike. Unfortunately, the
study did not consider muscle gaining. Finally, Rodgers
et al. [24] could not find an association between weight
status and the perception of appearance-related parental
norms and modeling behavior.
In summary, more knowledge on variation according
to individual characteristics is needed to explain the de-
velopment of negative body image and to design targeted
prevention approaches. While previous studies have pro-
vided important findings on the impact of single types of
social pressure and general behavioral mechanisms, find-
ings on gender, age and weight variations in different
aspects of social pressure have either been incomplete or
controversial, because only a few studies have explicitly
focused on these individual differences. Moreover, due
to restricted sample size most of the studies could not
Helfert and Warschburger Child and Adolescent Psychiatry and
Mental Health 2013, 7:16 Page 3 of 11
http://www.capmh.com/content/7/1/16
consider possible interactions between the three factors.
Finally, research has often concentrated on girls, or when
it included boys, the applied measures often contained a
bias towards the thin ideal that is not suitable for boys.
Thus, research still remains limited for the purpose of
drawing firm conclusions about gender, body mass varia-
tions and age-related trends in the perception of social
pressure.
Hypotheses
70. The current study attempts to contribute to an enhance-
ment of current theories on appearance-related social
pressure by investigating the occurrence of different
types of pressure in a large sample of German adolescent
boys and girls. Moreover it provides a comprehensive
exploration of differential effects of gender, weight, and
grade as well as interactions among these factors. Based
on previous findings, we expected the following:
Gender variations
1. The research of the recent years has posed the
question whether the emphasis placed on female
beauty sets girls at greater risk for appearance-
related social pressure or whether these effects have
derived from biased instruments that were
unsuitable for boys. Even if several studies have
pointed to the growing relevance of appearance
among boys and some gender differences diminished
when studies use muscle- and weight-related
instruments, most of the findings suggest that the
focus on appearance is still stronger for females.
Consequently, we hypothesized that girls would
show higher levels of peer pressure through
modeling by friends, school and class norms, peer
teasing and exclusion as well as higher levels of
parental pressure through parental teasing,
encouragement to control weight and shape, parental
norms and modeling and injustice and ignorance.
Grade-level variations
2. Previous findings have brought evidence for an age-
related increase of appearance orientation and
modeling processes among adolescents whereas
more direct aspects of peer pressure have proven to
71. be quite stable. We thus hypothesized that modeling
by friends and perceived school and class norms
would be higher in older compared to younger
adolescents. To take account of the findings of Chen
and Jackson [31] we also want to test for an
interaction between age and gender.
3. Regarding parental pressure, findings are rare and
therefore we based our expectations on
developmental theories. These theories have
suggested that parents are not the main source of
appearance-related standards and thus parental
norms and modeling should not differ by grade.
However, parents have been found to become more
concerned with the physical attractiveness of their
adolescent child. Thus, we expected that parental
encouragement to control weight and shape would be
more prevalent among older adolescents.
Body mass variations
4. Finally, research has raised the hypothesis that either
a) higher weight status per se sets individuals at
greater risk for stigmatization or b) girls with higher
weight are stigmatized if they do not fit the female
slim ideal, whereas boys experience teasing and
exclusion if they are too thin and do not fit the male
muscular ideal. As the majority of studies have
found evidence for the first hypothesis, we predicted
that overweight girls and boys would report higher
levels of all kinds of peer pressure (i.e. teasing,
exclusion, influences by friends, pressure from
school and class norms).
5. Based on previous studies we further expected that
72. overweight adolescents would experience more
parental teasing as well as encouragement to control
weight and shape.
Method
Participants and procedure
This study reports on the baseline survey of a longitudinal
investigation for which the procedure was approved by
the ethics commission and the local ministry of education.
The study was conducted among middle- and upper-class
students in grades 7 to 9 in six German high schools that
cooperate with our institution for different research
projects. Teachers delivered written information to the
students and their parents and collected informed consent
forms from those who agreed to participate. Of the 1,342
students who received information, 1,113 (83%) returned
their consent forms and completed the questionnaire dur-
ing a regular lesson. One case was excluded due to invalid
data. Demographic information for the remaining sample
of 1,112 students is given in Table 1.
Measures
Weight status
Body-mass index (BMI) was computed based on self-
reported age, weight, and height. Self-reported weight is
proven to be a valid measure in epidemiological studies
with adolescents [36]. The percentile ranking of BMI
was assigned using the WHO norms for age and gender
[37]. Following Jones and Crawford [7] weight status
Helfert and Warschburger Child and Adolescent Psychiatry and
Mental Health 2013, 7:16 Page 4 of 11
http://www.capmh.com/content/7/1/16
73. was classified as follows: underweight (BMI < 25th per-
centile), low average weight (25th ≤ BMI < 50th percentile),
high average weight (50th ≤ BMI < 85th percentile), and
overweight (BMI ≥ 85th percentile).
Appearance-related social pressure
The assessment of social pressure has been limited in
previous research. Studies that explored mechanisms of
sociocultural pressure predominantly asked about a gen-
eral feeling of pressure to be thin often with single items
(e.g. 11,14], The Perceived Sociocultural Pressure Scale
[38]). Moreover, several studies applied measures to
focus on specific aspects of pressure (e.g., peer influence:
Inventory of Peer Influence on Eating Concerns (IPIEC
[19]); family influence: Family Influence Scale (FIS [39]);
and teasing: Perception of Teasing Scale (POTS [40]).
Because most of these items imply a connotation to-
wards a thin ideal, they are probably not suitable among
boys and might thus lead to underestimations of the
relevance of pressure among boys.
Because to our knowledge no instrument exists that
measures social pressure from peers and parents simultan-
eously while distinguishing various types of pressure, we
developed the Appearance-Related Social Pressure Ques-
tionnaire (FASD, Fragebogen zum aussehensbezogenen
sozialen Druck [17]). To gather an accurate measure of so-
cial pressure we included on the one hand those social im-
pacts established in the literature and on the other hand
conducted qualitative interviews with adolescent girls and
boys exploring important sources of social pressure in their
daily lives. The literature predominantly provides evidence
for comparable risk factors for body concerns in both boys
and girls [e.g. 41,42]. The findings from our interviews dur-
ing the item generation also pointed to comparable forms
of social pressure. However, we had to ensure that the
74. phrases were suitable for both girls and boys as well as for
adolescents with different weight statuses. Thus, we used
general terms like “appearance“ or “body shape“ and tried
to avoid specific ones like “thinness“ to avoid a bias. The
32 items are rated on a 5-point Likert scale from 1 (strongly
disagree) to 5 (strongly agree). A series of structural equa-
tion models was used to investigate the factor structure of
the FASD. The best fitting model revealed two parts (peer
and parental pressure), each consisting of four scales that
comprise four items, respectively, and ask about different
types of appearance-related social pressure.
The section on parental pressure comprises four scales:
▌ Parental Teasing (α = .83, rtt = .60): This scale
combines direct aspects of pressure from parents
such as negative comments or disparaging gestures.
▌ Injustice and Ignorance (α = .65, rtt = .72): By
measuring the feeling of only being accepted when
looking better or being ignored for not looking good,
the second scale implies an indirect kind of pressure.
Although we could not find previous literature that
directly investigated this parental impact, it was
mentioned by the adolescents that were interviewed
during the construction of the FASD, and the
findings of Meesters et al. [13]. also suggested such
aspects of parental pressure.
▌ Parental Encouragement to Control Weight and
Shape (α = .79, rtt = .81): The third scale includes
also direct – but in contrast to the first scale, not
obviously disparaging – comments by parents as it
measures parental encouragement to pay heed to
one’s body shape.
75. ▌ Parental Norms and Modeling (α = .74, rtt = .83):
Finally, the fourth parental scale comprises indirect
pressure through parental standards of appearance
and efforts to look good.
The section peer pressure comprises the following four
scales:
▌ Peer Teasing (α = .78, rtt = .83): Comparable to the
parental scale, this scale is composed of direct types
of pressure like disparaging comments and gestures
by peers.
▌ Exclusion (α = .81, rtt = .86): This scale asks about
the feeling of being ignored or excluded from social
events because of one’s appearance.
▌ School and Class Norms (α = .78, rtt = .69): The
third scale measures an indirect aspect of peer
pressure as it inquires about the importance of
appearance in school and class.
▌ Modeling by Friends (α = .73, rtt = .72): The final peer
pressure scale asks about appearance standards of
friends and efforts to achieve that standard, which can
also be seen as an indirect aspect of peer pressure.
The internal consistency scores were taken from the
current sample, whereas the test-retest reliability coeffi-
cients were obtained in a previous study. Intercorrelations
between the FASD-scales in this study were predomin-
antly moderate (r = .13 to .55). Only teasing by peers and
exclusion showed a higher association (r = .68). The FASD
Table 1 Demographic Characteristics of the Sample
(N = 1,112)
76. Girls (n = 603) Boys (n = 509) p
Age 10 – 16 years 11 – 16 year .003
M = 13.32, SD = 0.79 M = 13.46, SD = 0.83
Grade 36.7% grade 7 33.8% grade 7 n.s.
36.3% grade 8 36.9% grade 8
27.0% grade 9 29.3% grade 9
BMI M = 18.63, SD = 2.57 M = 18.70, SD = 2.73 n.s.
Helfert and Warschburger Child and Adolescent Psychiatry and
Mental Health 2013, 7:16 Page 5 of 11
http://www.capmh.com/content/7/1/16
has been used in different studies to ensure its psychomet-
ric quality [e.g. 17,43]. Reliability was acceptable for all
scales and evidence for factorial, convergent, and incre-
mental validity has been determined [17]. Details on the
construction and validation of the FASD are available on:
http://www.psych.uni-potsdam.de/counseling/re-
search/messure-e.html.
Statistical analyses
All statistical analyses were performed using SPSS 15.0.
Because missing data rates were below 5% common EM-
substitution was applied. We conducted preliminary ana-
lyses using ANOVA and the chi square test to investigate
the characteristics of the sample and differences in the
77. group formation. In order to investigate differential effects
in the perception of different types of social pressure
we conducted a 2 (gender) x 3 (grade-level) x 4 (BMI
category) multivariate analysis of variance (MANOVA)
including the mean scores of all FASD subscales. We
decided to include gender, grade-level, and BMI in one
analysis, because different authors have discussed inter-
active effects of gender, weight, and age and, moreover,
we wanted to account for confounding effects because
our data suggested associations between the factors.
Furthermore, MANOVA was chosen due to the sub-
stantial intercorrelations among the different FASD
scales. Wilks’ Lambda will be reported as the multivari-
ate test criterion. For the post hoc univariate analysis,
the significance level was adjusted using Bonferroni
correction (p < .006).
Results
Preliminary analyses
Preliminary analyses revealed that the boys in our sample
were slightly older, t (1110) = 2,94, p <.01, and significantly
more of them could be classified as being overweight, χ2
(3, n = 1112) = 9.17, p < .05 (Table 2). In addition, students
in grades 7 to 9 significantly differed as to mean age with
only marginal overlaps in range, F (2, 1109) = 1237.50,
p < .001. Hence, the mean age in grade 7 was: M = 12.66
(SD = 0.43), in grade 8: M = 13.33 (SD = 0.45) and in grade
9: M = 14.36 (SD = 0.47). Finally, analyses indicated that
BMI significantly increased with age, F (2, 1109) = 3.57,
p <.001. However, no differences could be found regarding
the distribution of the four weight status groups according
to gender and grade. With the use of MANOVA, we could
account for the variations between the groups.
78. Overall results
The overall 2 (gender) x 3 (grade-level) x 4 (BMI category)
MANOVA of the different aspects of social pressure did
not show a significant overall interaction between gender,
grade, and weight status but did reveal main effects for all
the three factors. Hence, the MANOVA revealed a signifi-
cant main effect for gender, F(8, 1081) = 16.64, p < .001,
η2 = .11, which was of medium size (Table 3). Further-
more, we found a moderate main effect for grade-level,
F(16, 2164) = 5.91, p < .001, η2 = .04 (Table 4) and a
moderate main effect for BMI category, F(24, 3249) = 7.01,
p < .001, η2 = .05 (Table 5).
Main effects for gender
Hypothesis 1
With regard to gender effects we expected a main effect in-
dicating that girls display higher levels on all aspects of
appearance-related social pressure from peers and parents.
However, follow-up univariate tests confirmed the main
effect for gender only for one aspect of parental pressure.
Hence, girls reported more parental teasing, F(1, 1088) =
10.81, p < .01, η2 = .01, which constitutes a small effect.
Furthermore, girls displayed higher scores on all peer pres-
sure scales. More specifically, we found small effects re-
garding peer teasing, F(1, 1088) = 13.11, p < .001, η2 = .01;
exclusion, F(1, 1088) = 53.81, p < .001, η2 = .05; and school
and class norms, F(1, 1088) = 29.77, p < .001, η2 = .03 but
for modeling by friends the effect is even of medium
size, F(1, 1088) = 72.58, p < .001, η2 = .06.
In sum, gender differences in peer pressure were note-
worthy and indicated that girls perceived more pressure
from peers compared to boys, while the largest differ-
ence was revealed for modeling by friends.
Main effects for grade-level
79. Hypothesis 2
We hypothesized that the impact of friends and school-
mates would be higher in older compared to younger
Table 2 BMI Groups by Gender and Grade (N = 1,112)
Underweight Low average-weight High average-weight
Overweight p
(< 25th percentile) (25th ≥ BMI < 50th percentile) (50th ≥ BMI
< 85th percentile) (BMI ≥ 85th percentile)
Girls 32.7% 27.5% 31.3% 8.5% .027
Boys 27.7% 25.1% 34.0% 13.2%
Grade 7 33.6% 27.2% 27.2% 12.0% n.s.
Grade 8 29.5% 27.0% 32.9% 10.6%
Grade 9 27.6% 24.7% 38.8% 9.0%
Note. The BMI ranking was assigned using the WHO norms and
weight status was classified following Jones & Crawford
(2006).
Helfert and Warschburger Child and Adolescent Psychiatry and
Mental Health 2013, 7:16 Page 6 of 11
http://www.capmh.com/content/7/1/16
http://www.psych.uni-potsdam.de/counseling/research/messure-
e.html
http://www.psych.uni-potsdam.de/counseling/research/messure-
e.html
80. adolescents. In contrast to our hypothesis, differences
emerged not only for modeling by friends, F(2, 1088) =
12.80, p < .01, η2 = .02, and school and class norms, F(2,
1088) = 35.29, p < .001, η2 = .06, but also for peer teas-
ing, F(2, 1088) = 8.03, p < .001, η2 = .02 , and exclusion,
F(2, 1088) = 8.85, p < .001, η2 = .02. Bonferroni post hoc
tests were used to evaluate differences between grade-
levels (corrected p < .017) and revealed that students
from grade 7 reported significantly lower levels on all
peer pressure scales compared to students from grades 8
or 9. Only regarding school and class norms could a sig-
nificant difference be found between students from
grades 8 and 9. As reflected by the effect sizes, grade dif-
ferences for school and class norms were particularly
evident.
Hypothesis 3
Regarding variations by grade-level we expected that
parental encouragement to control weight and shape
would be more prevalent among older adolescents. The
univariate follow-up analyses of grade differences
(corrected p < .006) confirmed this hypothesis and a main
effect for parental encouragement to control weight and
shape revealed, which was perceived to a lesser degree in
grade 7 compared to grade 8, F(2, 1088) = 6.48, p < .01,
η2 = .01.
Main effects for body mass
Hypothesis 4
Finally, we predicted that overweight adolescents would
report higher levels of all types of peer pressure.
Univariate tests (corrected p < .006) combined with
Bonferroni post hoc tests were used to evaluate differ-
ences between BMI categories (corrected p <.008).
With regard to peer pressure, small effects for school
81. and class norms, F(3, 1088) = 5.56, p < .01, η2 = .02,
emerged. Interestingly, we found the highest scores
among high-average-weight students. Post hoc tests
indicated that high-average weight students scored
significantly higher than underweight students on
school and class norms. Main effects for peer teasing,
F(3, 1088) = 34.15, p < .001, η2 = .09 and exclusion, F(3,
1088) = 30.28, p < .001, η2 = .08, proved to be particu-
larly pronounced. Further, there emerged a trend, indi-
cating that the level of peer teasing and exclusion
increased with higher weight status. Underweight and
low-average weight students displayed the lowest levels
and did not differ in their scores. In contrast to our
Table 3 Main effects in appearance-related social
pressure for gender
Girls Boys
(n=603) (n=509)
M M
(SD) (SD)
Parental Pressure
Parental Teasing 1.18 1.11 η2 = .01**
(0.48) (0.30)
Injustice & Ignorance 1.13 1.14
(0.33) (0.30)
Parental Encouragement 1.65 1.70
82. (0.76) (0.74)
Parental Norms & Modeling 2.12 2.12
(0.74) (0.76)
Peer Pressure
Peer Teasing 1.57 1.49 η2 = .01***
(0.68) (0.60)
Exclusion 1.97 1.71 η2 = .05***
(0.82) (0.69)
School & Class Norms 2.18 1.99 η2 = .03***
(0.81) (0.71)
Modeling by Friends 2.61 2.22 η2 = .06***
(0.76) (0.73)
Note. The items are rated on a 5-point Likert scale from 1
(strongly disagree) to
5 (strongly agree).
*p < .05; **p < .01; *** p < .001.
Table 4 Main effects in appearance-related social
pressure for grade
Grade 7 Grade 8 Grade 9
(n=393) (n= 407) (n=312)
84. Modeling by Friends 2.25a 2.49b 2.59b η2 = .02***
(0.76) (0.73) (0.78)
Note. The items are rated on a 5-point Likert scale from 1
(strongly disagree) to
5 (strongly agree). Means with the same subscript are not
significantly different.
*p < .05; **p < .01; *** p < .001.
Helfert and Warschburger Child and Adolescent Psychiatry and
Mental Health 2013, 7:16 Page 7 of 11
http://www.capmh.com/content/7/1/16
hypothesis the different weight groups did not differ in
the perception of modeling by friends.
Hypothesis 5
We further expected that overweight adolescents would
experience more parental teasing and encouragement to
control weight and shape. Regarding parental pressure,
the results supported weight-related differences only for
one aspect of parental pressure – encouragement to
control weight and shape, F(3, 1088) = 25.98, p < .001,
η2 = .07 – indicating a large effect. The trend suggested
that parental encouragement to control weight and
shape increased with higher weight status. However, the
scores only significantly differed for overweight students.
To sum up, our analyses revealed main effects for gen-
der, grade-level, and weight status, but no interaction be-
tween these factors. With an effect size of η2 = .11,
gender differences proved to be particularly pronounced.
85. Girls scored higher on all peer pressure scales and
showed slightly higher scores on parental teasing. Mod-
erate main effects for grade-level revealed that students
from grade 7 differed from students from grades 8 and 9
on the peer pressure scales. Likewise, students from grade
7 showed low levels of parental encouragement to control
weight and shape. Finally, main effects for weight status
were particularly pronounced for peer teasing and exclu-
sion as well as for parental encouragement to control
weight and shape. The findings indicated that particularly
high-average and overweight adolescents perceived ap-
pearance pressure.
Discussion
The relevance of appearance-related social pressure as a
crucial factor for low self-esteem and depression as well
as body dissatisfaction and unhealthy body change ef-
forts has been proven repeatedly [e.g.44-46]. Up to now,
knowledge of gender, weight, and age-related variations
in social pressure has either been incomplete or contro-
versial because very few studies have explicitly investi-
gated these aspects together. Moreover, most of the
existing studies have permitted only limited conclusions,
because they either focused on single aspects of social
pressure or were limited in their assessment.
The current study thus contributes to a better under-
standing of the occurrence of social pressure by explicitly
addressing gender, grade-level, and weight variations in a
large sample of German adolescent girls and boys. Fur-
thermore, we applied a new measure (FASD), whose psy-
chometric quality and applicability for both girls and boys
has been proven before [17,43] and which allows a broad
assessment of aspects of appearance pressure from both
peers and parents. In doing so, the results may help to
86. identify adolescents who are particularly at risk of suffer-
ing from appearance-related social pressure and thus pro-
vide concrete advice for preventive approaches.
Following the overall effects of the current study, the
findings suggest that social pressure is more prevalent
during mid-adolescence compared to early adolescence
and girls and adolescents with higher weight are particu-
larly affected. A comparison of the effect sizes indicated
that gender differences were particularly pronounced in
the current sample.
Gender variations
Our hypotheses regarding gender differences in peer and
parental pressure were only partly supported. While we
found the expected gender differences on all peer pres-
sure scales, gender effects were only found for parental
teasing. Thus, our results support previous findings on
negative verbal commentary that found a higher preva-
lence among girls [6,14]. Nevertheless, the conclusion
often drawn in previous research that the parental im-
pact is generally higher for girls was probably premature.
Because the effect size for parental teasing was rather
low and no effects emerged on the other scales, levels of
parental pressure among girls and boys seem to be more
Table 5 Main effects in appearance-related social
pressure for BMI - categories
Under Low High Over
(n=338) (n=294) (n=362) (n=118)
M M M M
(SD) (SD) (SD) (SD)
88. (0.62) (0.66) (0.85) (0.97)
School & Class
Norms
1.98a 2.05ab 2.22b 2.15ab η2 = .02**
(0.70) (0.74) (0.83) (0.81)
Modeling by
Friends
2.33 2.44 2.52 2.45
(0.74) (0.76) (0.78) (0.80)
Note. Under = underweight (BMI < 25th percentile), Low = low
average
(25th ≤ BMI < 50th percentile), High = high average (50th ≤
BMI < 85th
percentile), Over = overweight (BMI ≥ 85th percentile). The
items are rated on
a 5-point Likert scale from 1 (strongly disagree) to 5 (strongly
agree). Means
with the same subscript are not significantly different.
*p < .05; **p < .01; *** p < .001.
Helfert and Warschburger Child and Adolescent Psychiatry and
Mental Health 2013, 7:16 Page 8 of 11
http://www.capmh.com/content/7/1/16
similar than previously assumed. This finding also re-
sembles the results of Rodgers et al. [24]. Even though
89. they found gender differences for a few aspects of paren-
tal pressure, a closer look at the scores and effect sizes
reveals that only the difference regarding negative mater-
nal comments is noteworthy. Maybe no effects were re-
vealed because of the extreme floor effect and the
restricted variance of these FASD scales, which is also
known for instruments assessing similar constructs in
population-based samples [6].
Gender effects for peer pressure are in line with
current research, indicating that girls are more strongly
affected by peer influences and the impact of friends is
especially important [7,46]. Gender effects with regard
to teasing experiences have been controversial because
of limitations in the measurement of teasing. Our results
obtained with a gender-neutral, reliable peer teasing
scale support the findings of the American EAT-Project
[26] and can serve as further evidence that girls experi-
ence more peer teasing. Summing up, the results sup-
port the assumption that girls are particularly embedded
in an appearance culture [1,46]. In detail, the findings
suggest that girls perceive more pressure from appear-
ance norms and modeling and are more often subject to
proximate forms of peer pressure such as teasing or ex-
clusion. Because the current study applied a measure of
social pressure that is not biased by female ideals and
has proven to be suitable for both girls and boys alike,
we conclude that the higher extent of appearance pres-
sure among females is not just a result of inappropriate
measurement but in fact a result of the greater societal
emphasis on beauty and appearance for females [5].
Grade-level variations
The prevalence of appearance-related social pressure es-
pecially by peers underlies age-related trends whereas
grade-level effects in parental pressure only emerged for
90. encouragement to control weight and shape and were
also rather minor.
In contrast to Chen and Jackson [31], these effects
proved to be comparable for girls and boys in this German
sample. Based on previous results, comparing male body
image in Western and Asian cultures, we assume that the
divergent results might point to a cultural difference. As
Yang, Grey, and Pope [47] revealed, Asian males were
less preoccupied with body image than Western males
and they discussed interesting reasons why in Western
cultures more emphasis is placed on male appearance
(e.g. media exposure, decline in traditional male roles).
In accordance with the literature [7,32], differences in
our sample were particularly evident comparing early
(grade 7) and middle adolescents (grades 8 and 9). Al-
though conclusions must be drawn cautiously due to the
cross-sectional design, it seems as if the transition from
grade 7 to grade 8 is particularly relevant. Interestingly,
differences were mainly reflected by an increase of per-
ceived school and class norms. This effect might be a re-
sult of the local school system. In this region of Germany,
students change schools between grades 6 and 7. Hence,
the adolescents in grade 7 have just joined a new school
context and their new schoolmates. This new school con-
text constitutes an important developmental transition,
which is associated with changes in social roles and a sub-
stantial reorganization of attitudes and beliefs and has
been considered a period of risk for problematic behavior
[48]. Thus, we believe that among grade 7 students the es-
tablishment of norms and group processes has presum-
ably just started. Consequently, we assume that the results
probably reflect both – on the one hand, individual
changes and transitions throughout adolescence, and on