
Recommended
More Related Content
Viewers also liked
Recently uploaded
Recently uploaded (20)
Datafor justbraintalk
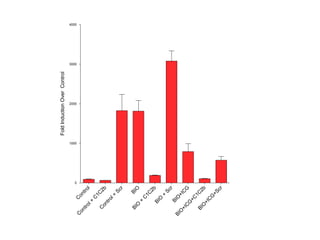
- 1. Fold Induction Over Control 0 1000 2000 3000 4000 C C on on tro tro l+ l C 1C C 2b on tro l+ Sc r BI BI O O + C 1C 2b BI O + Sc r BI BI O O +I +I C C G G +C 1C BI O 2b +I C G +S cr
- 2. Fold Induction Over Control 0 100 200 5000 10000 15000 20000 25000 C C on on tro tro l+ l C 1C C 2a on tro l+ Sc r BI BI O O + C 1C 2a BI O + Sc r BI BI O O +I +I C C G G +C 1C BI O 2a +I C G +S cr
- 3. Fold Induction Over Control 0 100 200 500 1000 1500 2000 2500 3000 3500 4000 C C on on tro tro l+ l m C 1C 2 C 2C 2 BI BI O O + m C 1C BI O 2 + C 2C 2 BI BI O O +I +I C C G G +m BI C O 1C +I C 2 G +C 2C 2
- 4. AXIN-2 qPCR
- 5. AXIN-2 qPCR
- 8. Permeability Assay for RITC 3KD Dextran 1.5×10-05 3×10-06 Pe (cm/s) 2×10-06 1×10-06 0 d5 rt 5 5 nd nd se En In bE bE -b e n- n- FP re D D lF G EF EF el 3L 5L C 0. 0.
- 9. NU-Nuclear Fraction PN-Post Nuclear Fraction
Editor's Notes
- \n
- \n
- \n
- \n
- \n
- \n
- \n
- \n
- \n
- \n
- \n