A Close Examination of Performance and Power
Characteristics of 4G LTE Networks
Junxian Huang1 Feng Qian1 Alexandre Gerber2
Z. Morley Mao1 Subhabrata Sen2 Oliver Spatscheck2
1University of Michigan 2AT&T Labs - Research
ABSTRACT
With the recent advent of 4G LTE networks, there has been in-
creasing interest to better understand the performance and power
characteristics, compared with 3G/WiFi networks. In this paper,
we take one of the first steps in this direction.
Using a publicly deployed tool we designed for Android called
4GTest attracting more than 3000 users within 2 months and exten-
sive local experiments, we study the network performance of LTE
networks and compare with other types of mobile networks. We ob-
serve LTE generally has significantly higher downlink and uplink
throughput than 3G and even WiFi, with a median value of 13Mbps
and 6Mbps, respectively. We develop the first empirically derived
comprehensive power model of a commercial LTE network with
less than 6% error rate and state transitions matching the specifica-
tions. Using a comprehensive data set consisting of 5-month traces
of 20 smartphone users, we carefully investigate the energy usage
in 3G, LTE, and WiFi networks and evaluate the impact of config-
uring LTE-related parameters. Despite several new power saving
improvements, we find that LTE is as much as 23 times less power
efficient compared with WiFi, and even less power efficient than
3G, based on the user traces and the long high power tail is found
to be a key contributor. In addition, we perform case studies of
several popular applications on Android in LTE and identify that
the performance bottleneck for web-based applications lies less in
the network, compared to our previous study in 3G [24]. Instead,
the device’s processing power, despite the significant improvement
compared to our analysis two years ago, becomes more of a bottle-
neck.
Categories and Subject Descriptors
C.2.1 [Network Architecture and Design]: wireless communi-
cation; C.4 [Performance of Systems]: measurement techniques,
modeling techniques, performance attributes; D.2.8 [Metrics]: Per-
formance measures
Keywords
LTE, 4G, 4GTest, 3G, energy saving, power model simulation, net-
work model simulation
Permission to make digital or hard copies of all or part of this work for
personal or classroom use is granted without fee provided that copies are
not made or distributed for profit or commercial advantage and that copies
bear this notice and the full citation on the first page. To copy otherwise, to
republish, to post on servers or to redistribute to lists, requires prior specific
permission and/or a fee.
MobiSys’12, June 25–29, 2012, Low Wood Bay, Lake District, UK.
Copyright 2012 ACM 978-1-4503-1301-8/12/06 ...$10.00.
1. INTRODUCTION
Initiated in 2004 by 3rd Generation Partnership Project (3GPP),
the Long Term Evolution (LTE), commonly referred to as a type
of 4G wireless service, aims at enhancing the Universal Terres-
trial ...
A Close Examination of Performance and PowerCharacteristics
1. A Close Examination of Performance and Power
Characteristics of 4G LTE Networks
Junxian Huang1 Feng Qian1 Alexandre Gerber2
Z. Morley Mao1 Subhabrata Sen2 Oliver Spatscheck2
1University of Michigan 2AT&T Labs - Research
ABSTRACT
With the recent advent of 4G LTE networks, there has been in-
creasing interest to better understand the performance and
power
characteristics, compared with 3G/WiFi networks. In this paper,
we take one of the first steps in this direction.
Using a publicly deployed tool we designed for Android called
4GTest attracting more than 3000 users within 2 months and
exten-
sive local experiments, we study the network performance of
LTE
networks and compare with other types of mobile networks. We
ob-
serve LTE generally has significantly higher downlink and
uplink
throughput than 3G and even WiFi, with a median value of
13Mbps
and 6Mbps, respectively. We develop the first empirically
derived
comprehensive power model of a commercial LTE network with
less than 6% error rate and state transitions matching the
specifica-
tions. Using a comprehensive data set consisting of 5-month
2. traces
of 20 smartphone users, we carefully investigate the energy
usage
in 3G, LTE, and WiFi networks and evaluate the impact of
config-
uring LTE-related parameters. Despite several new power
saving
improvements, we find that LTE is as much as 23 times less
power
efficient compared with WiFi, and even less power efficient
than
3G, based on the user traces and the long high power tail is
found
to be a key contributor. In addition, we perform case studies of
several popular applications on Android in LTE and identify
that
the performance bottleneck for web-based applications lies less
in
the network, compared to our previous study in 3G [24].
Instead,
the device’s processing power, despite the significant
improvement
compared to our analysis two years ago, becomes more of a
bottle-
neck.
Categories and Subject Descriptors
C.2.1 [Network Architecture and Design]: wireless communi-
cation; C.4 [Performance of Systems]: measurement techniques,
modeling techniques, performance attributes; D.2.8 [Metrics]:
Per-
formance measures
Keywords
LTE, 4G, 4GTest, 3G, energy saving, power model simulation,
net-
3. work model simulation
Permission to make digital or hard copies of all or part of this
work for
personal or classroom use is granted without fee provided that
copies are
not made or distributed for profit or commercial advantage and
that copies
bear this notice and the full citation on the first page. To copy
otherwise, to
republish, to post on servers or to redistribute to lists, requires
prior specific
permission and/or a fee.
MobiSys’12, June 25–29, 2012, Low Wood Bay, Lake District,
UK.
Copyright 2012 ACM 978-1-4503-1301-8/12/06 ...$10.00.
1. INTRODUCTION
Initiated in 2004 by 3rd Generation Partnership Project (3GPP),
the Long Term Evolution (LTE), commonly referred to as a type
of 4G wireless service, aims at enhancing the Universal Terres -
trial Radio Access Network (UTRAN) and optimizing radio
access
architecture [1]. Since 2009, LTE starts entering the commercial
markets and is available now in more than 10 countries, with an
expectedly fast-growing user base. The targeted user throughput
is
100Mbps for downlink and 50Mbps for uplink, significantly
higher
than the existing 3G networks, with less than 5ms user-plane la-
tency [12]. Understanding the actual user-perceived network
per-
formance for LTE network and how it compares with its
predeces-
sor 3G and its competitors, e.g., WiFi and WiMAX, is
4. important,
yet not straightforward. Our previous study [24] takes one of
the
first steps to measure 3G network performance directly from
end
users. In this study, we follow up with a new tool, 4GTest, with
enhanced measurement design and global server support,
allowing
us to characterize network performance of LTE and other
mobile
networks.
Besides higher bit rate, lower latency and many other service
offerings for LTE, user equipment (UE) power saving is an
impor-
tant issue. LTE employs Orthogonal Frequency Division Multi-
plex (OFDM [15]) technology, which suffers from poor power
effi-
ciency. To save power, LTE uplink uses an special
implementation
of OFDM called SC-FDMA for uplink, with improved power
effi-
ciency. Discontinuous reception (DRX) has been employed by
ex-
isting wireless mobile networks to reduce UE energy
consumption.
In UMTS [14], during the idle state, UE periodically wakes up
to
check paging messages and sleeps for the remaining time. LTE
sup-
ports DRX for both RRC_CONNECTED and RRC_IDLE modes
[16],
seeking more opportunities to conserve UE battery. DRX is con-
figured at a per-UE basis and controlled by a list of parameters
in Table 2. The configuration of these parameters incurs
tradeoff
5. among UE power saving, channel scheduling delay, and
signaling
overhead.
To understand this tradeoff, existing studies use either total on
time to estimate UE power usage [36, 19], or a simplified LTE
power model [25, 34], which ignores the impact of
downlink/uplink
data rates. In this paper, we develop the first empirically
derived
comprehensive power model of a commercial LTE network,
which
accurately models UE energy usage. Also, existing studies [36,
19, 25, 34] heavily rely on synthetic packet models instead of
real
user traces. Our study is the first that leverages a
comprehensive
real user data set, we call UMICH, consisting of 5-month traces
of 20 smartphone users, to analyze the impact of LTE parameter
configuration on realistic application usage patterns. UMICH
data
set only includes users traces in 3G and WiFi networks, but not
in
LTE network. We make our best efforts to overcome this
limitation
§ Figures & Tables Data source Description
4.1 Figure 5, 6 Public deployment of 4GTest Compare LTE
network performance with other mobile networks
4.2 Figure 7 Local LTE Phone Infer LTE parameters with
network-based approach
4.3, 4.4 Figure 8 LTE Laptop and LTE Phone Understand the
impact of various factors on LTE performance
6. 5.1, 5.2 Table 3, 4, Figure 9, 10, 11 Local LTE Phone Derive
LTE power model and compare with WiFi and 3G
5.3 Figure 12 Local LTE Phone Compare bulk data transfer
energy efficiency of LTE with WiFi and 3G
5.4 Table 5 Local LTE Phone Validate LTE power model with
real applications
6.1, 6.2 Figure 14 Simulation on UMICH data set Analyze
energy efficiency and the impact of different energy
components
6.3 Figure 15, 19, 20, 16, 17, 18 Simulation on UMICH data set
Study the impact of LTE parameter configurations
7.1 Figure 22 Different local platforms Compare JavaScript
execution speed in 2009 and in 2011
7.2 Table 6, Figure 21 Local LTE Phone Study performance
bottleneck of web-based applications
Table 1: Summary and index of experimental results.
by feeding WiFi traces into our LTE model simulation
framework,
given that RTT of WiFi is close to LTE (§4.1) and throughput is
less important than RTT for most web-based smartphone
applica-
tions (§7.2).
Compared with 3G, LTE significantly improves the network
per-
formance. Meanwhile, device processing capability and
software
design have also improved remarkably over the last two years,
com-
paring with our previous study [24]. To understand the potential
performance bottleneck shift for smartphone applications, we
per-
7. form case studies of several popular applications on Android.
With
the help of CPU, network and power traces, we devise a
systematic
methodology for application performance and power
measurement
and analysis.
We summarize the results of this paper in Table 1 and highlight
our main contributions as follows.
(i) This paper is one of the first studies on commercial LTE net-
works. We characterize LTE network performance with both
local
experiments and global measurement by deploying a network
per-
formance measurement tool 4GTest with distributed server
support
globally. Generally, LTE is observed to have significantly
higher
downlink and uplink throughput than 3G and even WiFi, with a
median value of 13Mbps and 6Mbps, respectively, which is
even
higher than the advertised throughput range of the LTE provider
studied.
(ii) We develop the first empirically derived comprehensive
power
model of a commercial LTE network, considering both uplink
and
downlink data rates in addition to state transitions and DRX. It
ac-
curately quantifies the radio energy usage of UE with less than
6%
error rate. Our power measurement also reveals that LTE is less
power efficient than 3G and WiFi for small data transfers, e.g.,,
8. for
transferring one packet, the energy usage for LTE, 3G and WiFi
is
12.76J, 7.38J and 0.04J, respectively. For bulk data transfer,
LTE
is more power efficient than 3G, yet still lags behind WiFi, e.g.,
for
downloading 10MB data, 3G and LTE require 34.77 and 1.62
times
the energy of WiFi, respectively. Considering that LTE is more
en-
ergy efficient if fully utilized, it is even more cruci al to
optimize
applications using tools like ARO [28] in LTE than 3G to
achieve
the full LTE savings. The energy model derived in this paper
will
provide the necessary understanding to drive those
optimizations.
(iii) With the aforementioned power model, we build a trace-
driven LTE analysis modeling framework, which breaks down
the
total energy consumption into different components, to identify
the
key contributor for energy usage. It also quantifies the channel
scheduling delay perceived by UE and signaling overhead of
cell
towers. This analysis framework is applied to a comprehensive
data
set UMICH consisting 5 months’ data from 20 real users. By
com-
paring the estimated energy usage of different networks, LTE is
as
much as 23 times less power efficient compared with WiFi, and
even less power efficient than 3G, despite the presence of DRX
9. de-
signed for energy saving. We also study the impact of
configuring
various LTE parameters on radio energy, channel scheduling
delay,
and signaling overhead. Similar to 3G UMTS network, LTE tail
timer Ttail remains a key parameter in determining UE energy
us-
age and performance, as well as signaling overhead of cell
towers.
(iv) We perform case studies of several popular applications on
Android to understand the impact of improved LTE network
per-
formance and enhanced UE processing power on applications.
The
processing speed for contemporary smartphones have increased
sig-
nificantly compared with our analysis two years ago. However,
we
still identify that the performance bottleneck for web-based
appli-
cations lies more in the device’s processing power than in the
net-
work, indicated by the high average CPU usage of 79.3% in
LTE
network, as compared to 57.7% in 3G network, as well as the
un-
derutilized network capacity due to small object size in typical
web
transactions.
The remaining paper is organized as follows. We cover back-
ground on RRC and DRX for LTE in §2, followed by
experimental
10. setup and methodology in §3. We then present network
characteri-
zation results, including 4GTest results in §4 and power
measure-
ments in §5. §6 summarizes the simulation analysis on UMICH
data
set, and §7 includes the case study of several popular Android
ap-
plications. We discuss related work in §8 before concluding in
§9.
2. BACKGROUND
We first cover the necessary background on LTE state machine
behavior and corresponding power characteristics.
2.1 Radio Resource Control (RRC) and Dis-
continuous Reception (DRX) in LTE
LTE has two RRC states, RRC_CONNECTED and RRC_IDLE
[10,
17], as shown in Figure 1. At RRC_CONNECTED state, UE can
be
in one of the three modes: Continuous Reception, Short DRX,
and
Long DRX. While at RRC_IDLE state, UE is only in DRX
mode.
Table 2 enumerates a list of important LTE parameters, which
have
significant impact on UE’s radio energy consumption, user
experi-
ence, and signaling overhead for cell towers. The terms in Table
2
are used consistently throughout this paper.
If UE is initially in RRC_IDLE state and receives/sends one
11. packet,
regardless of the packet size, a state promotion from RRC_IDLE
to
RRC_CONNECTED occurs with a relatively stable delay,
similar to
the promotion from IDLE to DCH/FACH in UTMS network
[27].
We define the LTE promotion delay to be Tpro1 consistently
through-
out this paper. During this period, radio resources are allocated
to
the UE.
After being promoted to RRC_CONNECTED, UE enters
Continu-
ous Reception by default and keeps monitoring the Physical
Down-
1Tpro is a measured system property, different from the config-
urable LTE parameters in Table 2.
Symbol Full name Measured value Description
Ti DRX inactivity timer 100ms UE stays in Continuous
Reception for Ti before DRX starts when idling
Tis Short DRX cycle timer 20ms UE remains in Short DRX for
Tis before entering Long DRX when idling
Ttail RRC inactivity timer 11.576s UE stays in
RRC_CONNECTED for Ttail before demoting to RRC_IDLE
Ton RRC_CONNECTED On Duration timer 1ms The on
duration of UE during each DRX cycle in RRC_CONNECTED
Toni RRC_IDLE On Duration timer 43ms The on duration of
UE during each DRX cycle in RRC_IDLE
Tps Short DRX cycle 20ms The cycle period of Short DRX in
RRC_CONNECTED
Tpl Long DRX cycle 40ms The cycle period of Long DRX in
12. RRC_CONNECTED
Tpi RRC_IDLE DRX cycle 1.28s The cycle period of DRX in
RRC_IDLE
Table 2: Important LTE RRC and DRX parameters.
Continuous
Reception
Short
DRX
RRC_CONNECTED RRC_IDLE
Long
DRX
DRX
Timer
expiration
Data
transfer
Ttail
Tis
Ti
Figure 1: RRC state transitions in LTE network.
Short
DRX
cycle
13. Continuous
Reception
On Duration
Long DRX
cycle
Data transfer Ti expiration
Tis expiration
Long DRX
cycle
Figure 2: Illustration of the LTE DRX in RRC_CONNECTED.
link Control Channel (PDCCH), which delivers control
messages
to UE. UE also starts the DRX inactivity timer Ti, which is
reset
every time UE receives/sends a packet. Upon Ti’s expiration
with-
out seeing any data activity, UE enters the Short DRX mode.
Discontinuous Reception (DRX) [16, 30], illustrated in Figure
2,
is adopted by LTE for UE to “micro-sleep” to reduce power
con-
sumption while providing high QoS and connectivity. DRX in
RRC_CONNECTED and RRC_IDLE have similar mechanisms,
but dif-
ferent parameter settings. A DRX cycle includes an On Duration
during which the UE monitors PDCCH. UE rests for the rest of
the
cycle to save energy. The tradeoff between battery saving and
14. la-
tency is the guideline for determining the parameterization of
DRX
cycle. With a fixed On Duration, a longer DRX cycle reduces
en-
ergy consumption of UE while increasing user-perceived delay,
and
a shorter DRX cycle reduces the data response delay at the cost
of
more energy consumption. Short DRX and Long DRX modes,
hav-
ing the same On Duration and differing in cycle length, are to
meet
these conflicting requirements.
When UE enters Short DRX, Short Cycle Timer Tis is started.
Upon Tis’s expiration, if there is no data activity, UE switches
to
Long DRX; otherwise, UE goes back into Continuous
Reception.
0
1000
2000
3000
4000
0 t1t2 5 10 t3 15 20 t4 25
P
o
w
15. e
r
(m
W
)
Time (second)
t1: Promotion starts
t2: Data transfer starts
t3: Tail starts
t4: Tail ends
Figure 3: Power states of LTE.
For our measurement, Tis coincidentally equals Tps, so only
one
cycle of Short DRX is expected to take place before Tis expires.
Every time UE enters Continuous Reception when there is any
data
transfer, UE starts the tail timer Ttail, which is reset every time
a packet is sent/received. When Ttail expires, UE demotes from
RRC_CONNECTED to RRC_IDLE and the allocated radio
resource is
released. Notice that Ttail coexists with Ti and Tis.
2.2 Smartphone power model for LTE
Given the description of LTE state machine, we illustrate the
power traces of an Android smartphone in a commercial LTE
net-
16. work based on local experiments described in §3.2. We observe
that network activities match the corresponding state transitions
in-
dicated by different power levels.
Figure 3 shows the power trace of uploading at the speed of
1Mpbs for 10 seconds. With screen off, the energy is mostly
con-
sumed by the radio interfaces, as the power level is less than
20mW
before t1. At t1, the application sends a TCP SYN packet
trigger-
ing RRC_IDLE to RRC_CONNECTED promotion, and the
application
waits for Tpro until starting data transfer at t2. Between t2 and
t3, depending on the instant data rate, the power level
fluctuates.
We notice the power level during fast data transfer is
significantly
higher than the base power in RRC_CONNECTED, which
motivates us
to incorporate data rates into our LTE power model. After the
data
transfer completes at t3, the device remains in
RRC_CONNECTED
for a fixed tail time Ttail, until t4, when the device goes back to
RRC_IDLE. The periodicity of DRX between t3 and t4 is not
obvi-
ous due to limited sample rate.
In summary, this section provides necessary background infor -
mation and some initial motivating observations for the
following
discussions on the network and power characterization of LTE
net-
work.
17. 3. METHODOLOGY
In this section, we present the methodology for network and
power measurement, as well as trace-driven simulation analysis
and
real application case studies.
3.1 Network measurement
In this section, we discuss the design of our publicly deployed
tool 4GTest, followed by experimental setup and methodology
for
local network measurement.
3.1.1 The design of 4GTest
Based on our previous experiences of developing 3GTest [6,
24], we design a new mobile network measurement tool for An-
droid devices, called 4GTest [2], with higher accuracy and im-
proved user experience. As a new feature, 4GTest allows users
to switch among different network types, i.e., 3G, WiFi and
LTE.
We also improve the network measurement methodology
leverag-
ing the M-Lab [5] support. 4GTest server suite is deployed to
46
M-Lab nodes across the world, covering North America,
Europe,
Asia, and Australia. Each node has 4-core 2.00 GHz Intel Xeon
CPU and our virtual slice has 4GB memory and 100Mbps Ether-
net network access, which ensures that the network bottleneck
is
unlikely on the wired network path.
18. RTT and variation test LTE has significantly smaller latency
compared with 3G [12], hence the network distance between
users
and the measurement servers for the wired Internet path
becomes
less negligible. Given that the GPS coordinates for M-Lab nodes
are known, in 4GTest, a nearest M-Lab node is selected for a
user
based on the current GPS location if available, or the IP address
otherwise, with the help of a IP address to GPS coordinates
map-
ping [4]. Such a mapping is sufficient for our purpose of finding
coarse-grained location estimates for server selection.
To measure RTT and variation, 4GTest repeatedly establishes a
new TCP connection with the server and measures the delay be-
tween SYN and SYN-ACK packet. Both the median of these
RTT
measurements and the variation are reported to our central
server.
Throughput test Since single-threaded TCP measurement is
more sensitive to packet loss and hence less accurate [32], we
use
multi-threaded TCP measurement in 4GTest to estimate the peak
channel capacity, i.e., three nearest server nodes in M-Lab are
se-
lected for each user at runtime to start concurrent threads for
through-
put test. Despite the shared nature of M-Lab nodes with other
test
tools, it is unlikely that all three selected nodes are overloaded
in
terms of CPU and network.
A throughput test lasts for 20 seconds, to balance across band-
width usage, user waiting time and measurement accuracy. The
19. ini-
tial 5 seconds are ignored empirically due to TCP slow start.
The
remaining 15 seconds are separated into 15 1-second bins. The
average throughput for each bin is calculated and the median of
all bins is the measured throughput. Compared with using aver -
age throughput, median more accurately estimates the steady
peak
throughput by reducing the impact of abnormal bins, e.g., a very
high bin due to initial buffering or a low bin due to temporary
signal
problem. Uplink and downlink tests share the same
methodology.
3.1.2 Local network measurement
Devices for accessing LTE networks in this study are named
LTE Phone and LTE Laptop. LTE Phone is an HTC phone with
LTE data plan from a cellular ISP. It has 768 MB RAM memory
and 1 GHz Qualcomm MSM8655 CPU, running Android 2.2.1.
LTE Laptop is a laptop equipped with LTE USB Modem. It has
8GB memory and 2.53 GHz Intel Core Duo CPU, running Mac
OS
X 10.7.2.
Packet and CPU trace collection In order to collect packet
traces on LTE Phone, we cross-compile tcpdump [9]. With a
small
snapshot length, only to capture TCP/UDP and IP headers, the
CPU
overhead of the background tcpdump process is less than 5%.
To
capture CPU usage history, we write a simple C program to read
/proc/stat in Android system every 25ms and the overhead is
verified to be smaller than 5% on LTE Phone.
20. Network-based approach for LTE parameter inference is used
to validate the power-based approach (§3.2). We use the follow-
ing experiment to infer LTE state machine and RRC_IDLE DRX
parameters. LTE Phone maintains a long lived TCP connection
with a test server. For each experiment, server first sends a
packet
P1 to trigger UE’s promotion to RRC_CONNECTED, and after
X
seconds, server sends another packet P2 to the phone to measure
RTT. Assume the RTT at RRC_CONNECTED is RTTb ignoring
the
minor impact of DRX in RRC_CONNECTED. When X ≤ Ttail,
RTT(X) = RTTb. Otherwise, RTT(X) = RTTb+Tpro+Tdrx,
where Tdrx = Tn − X and Tn is the start time of the next DRX
on duration after P2’s arrival. If P2’s arrival is inside any DRX
on
duration, Tdrx = 0.
To understand the impact of packet size on one-way delay
(OWD),
uplink and downlink OWD is measured with varying packet
size.
For each packet size, 100 samples are measured, and we make
sure that packets are not fragmented. OWD is measured between
LTE Laptop and a test server. A GPS Receiver [3] is connected
to
LTE Laptop, which uses the received GPS messages for time
syn-
chronization. The test server is also time-synced with another
GPS
clock. The maximum error of our setup is less than 1ms.
We compare LTE with 3G and WiFi by local experiments on
LTE Phone. When 4G is disabled in LTE Phone, it connects to
3G network and the network type is eHRPD. For WiFi, with the
data network radio interface turned off, LTE Phone connects to
21. a
wireless router, Cisco-Linksys WRT54GL Wireless-G
Broadband
Router, 802.11g in channel 2.437GHz. The Internet ISP for
WiFi
is Comcast and the advertised downlink peak data rate is
6Mbps.
3.2 Power measurement
Similar to previous studies [27, 35], we use Monsoon power
monitor [7] as power input for LTE Phone measuring power
traces
at the same time. The power trace contains two fields,
timestamp
and average instant power, and the sampling rate is 5000Hz. We
share the same observation with previous study [35] that screen
plays an important role in device power consumption, i.e., with
screen 100% on, the UE idle power is 847.15mW compared with
11.36mW with screen off. For all measurements, we keep the
test
application running in the background with screen completely
off
to minimize power noise, unless UI interactions are required
and
screen should be kept on, i.e., measuring power for browser. In
this case, we subtract screen power from the total, with slightly
increased noise. All experiments are repeated at least 5 times to
reduce measurement error.
To measure state transition power levels, UE keeps a long-lived
TCP connection with the server and packet traces are collected
to
make sure there is no background traffic. In order to trigger
state
promotions, we make the device idle for sufficient time, e.g., 30
22. seconds, and then send a packet from server to client. UE
remains
idle afterwards and demotes to idle state in the end, and the
power
trace covers the full tail.
3.3 Trace-driven analysis
To compare energy consumption for different networks using
real user traces and evaluate the impact of setting LTE parame-
ters, we devise a systematic methodology for trace-driven
analy-
sis, which is applied to a comprehensive user trace data set,
named
UMICH.
3.3.1 UMICH data set for analysis
UMICH data set is collected from 20 smartphone users for five
months, 05/12/2011 ∼ 10/12/2011, totaling 118 GB. These
partic-
ipants consist of undergraduate and graduate students from 8
de-
partments at University of Michigan. The 20 participants are
given
Motorola Atrix (11 of them) or Samsung Galaxy S smartphones
(9
of them) with unlimited voice, text and data plans, all running
An-
droid 2.2. As stated in our study consent form, we keep
collected
data and users’ identities strictly confidential2.
23. Custom data collection software developed by us are deployed
on the 20 smartphones. It continuously runs in the background
and
collects full packet traces in tcpdump format including both
headers
and payload. Both cellular and Wi-Fi traces are collected
without
any sampling performed. The data collector incurs no more than
15% of CPU overhead, although the overhead is much lower
when
the throughput is low (e.g., less than 200 kbps).
We also build a data uploader that uploads the data to our server
when the phone is idle as indicated by low network throughput.
The
upload is suspended by detected network activity of user
applica-
tions. The entire data collection and uploading process is
transpar-
ent to the users.
3.3.2 Trace-driven modeling methodology
We build a network model and power model analysis framework
for the trace-driven analysis, totaling about 8,000 lines of code
in
C++.
Network model simulator takes the binary packet trace files
in libpcap [9] format and preprocesses the data following the
same
methodology as previous study [27], for the purpose of
removing
existing delays imposed by state promotions and extracting the
ac-
tual traffic patterns, e.g., for the purposing of simulating the
trace
24. in another network. It then applies a specific network model to
the
processed traces and adjusts timestamps for some packets, since
different network models have different delay behavior due to
state
machine differences. There are two reasons for a packet’s
times-
tamp to be adjusted, promotion delay and DRX waiting time.
We
use the same methodology to adjust timestamp for promotion
de-
lay as previous study [27]. In LTE network, if there is no packet
for
over Ttail time, when the next packet P arrives, an extra delay
Tpro
is inserted before P . In terms of DRX waiting time, if a
downlink
packet P ′ comes at time TP ′ and UE is in DRX mode, either in
RRC_CONNECTED or RRC_IDLE, there is no DRX waiting
time if
P ′ arrives inside any DRX on duration; otherwise, P ′ would
expe-
rience an extra delay of Tn −TP ′ , where Tn is the start time of
the
next DRX on duration after TP ′ . The parameters for different
net-
work models are listed in Table 3, obtained from local
experiments.
We also empirically assume that UE goes into complete sleep
with
0 power usage after being idle for Ttail2 (1 minute). Notice that
Ttail2 is not actually observed in our experiments and is only
used
to bound the total idle energy and simplify our analysis.
The output of network model simulator is an array of packets
25. with adjusted timestamps, in ascending order, as well as the
RRC
and DRX states of UE at any time.
Power model simulator takes the output of network model sim-
ulator and calculates the energy consumption based on the
power
model, detailed in §5. We break down the total energy into four
components: promotion, data transfer, tail, and idle.
2This user study has been approved by the University of
Michigan
IRB-HSBS #HUM00044666.
For promotion energy, both promotion delay Tpro and average
promotion power Ppro are fixed. If a trace includes N
promotions,
promotion energy is given by NTproPpro.
For idle energy in RRC_IDLE, assume that DRX cycle is Tpi
(with base power Pb) and on duration is Toni (with on power
Poni),
energy consumption of an duration of tidle is given by
b
tidle
Tpi
c
(
ToniPoni + (Tpi −Toni)Pb
)
+ Eres
where the remaining energy Eres can be calculated as
Eres =
26. {
TresPoni if Tres ≤ Toni
ToniPoni + (Tres −Toni)Pb if Tres > Toni
with
Tres = tidle −Tpib
tidle
Tpi
c
Tail energy is more complex for LTE since RRC_CONNECTED
has
three modes as in Figure 1, while 3G and WiFi do not have
DRX
in connected mode. We simulate the transitions among
Continuous
Reception, Short DRX and Long DRX to calculate tail energy,
in a
similar way of idle energy calculation. Note that we only count
tail
energy when the tail is complete, otherwise, the energy is
consid-
ered as data transfer energy, i.e., if one packet P is observed
before
UE demotes to RRC_IDLE at the end of the tail, the energy
between
P and the previous packet is still considered as data transfer
energy.
For data transfer energy, we propose a novel model. Assume up-
link throughput is tu (Mbps) and downlink throughput is td
(Mbps),
the instant power level (mW) of UE is
27. P = αutu + αdtd + β
Validation of this formula is in §5.2. We simply consider pay-
load throughput in our power model, without considering header
length and ACK packets due their small impact. Since TCP
instant
throughput changes frequently, in order to accurately estimate
the
instant power levels, we divide the trace into small time
windows
with size W seconds and within each window, throughput tu and
td are calculated, which determine the power P . W is set to be 1
second empirically in our setup and the total energy is not
sensitive
to the choice of W as long as W is larger than a few RTTs and
smaller than most flow durations.
3.4 Application performance
As a case study, we select a few smartphone applications and
collect both network and CPU traces on LTE Phone.
Specifically,
we select the default browser, YouTube, NPR News and
Android
Market as our sampled applications given their popularity. For
the
default browser, we choose two different usage scenarios, i.e.,
vis-
iting mobile version of google.com representing a simple web-
site and visiting non-mobile version of yahoo.com representing
a
content-rich website. We name the two browser usage scenarios
as
Website G and Website Y, respectively. While for the other
appli-
cations, we click the application icon until the initial page is
28. fully
presented to the user. We make sure the cache is cleared before
each experiment.
Figure 4 shows co-located network and CPU trace of Website Y.
At time 0, when GO button is clicked, loading starts. Before ta,
CPU usage stays low most of the time given that UE has not fin-
ished downloading the HTML or JavaScript objects. Starting
from
ta, CPU usage jumps to 100% and remains a high average usage
until tc. We notice that network activity nearly stops after tb,
with
only a few TCP FIN packets for closing TCP connections after -
wards, some even come seconds later, e.g., at time 10.5
seconds.
google.com
yahoo.com
0
0.2
0.4
0.6
0.8
1
0 2 ta 4 tb6 8 10 tc 12
0
250
500
750
1000
1250
30. )
Time (second)
Uplink (Y2)
Downlink (Y2)
CPU usage (Y1)
Figure 4: Network and CPU trace for Website Y in LTE.
During the time between ta and tc, UE is rendering HTML pages
or executing JavaScript, and during the time between ta and tb,
UE
is also downloading web objects in parallel.
We define tc to be the application loading time instead of tb,
since at tb, UE has not fully rendered the contents for the user,
though the download process is complete. We validate this by
collecting video traces with a camcorder facing the screen of
the
phone. We replay the video at normal speed and manually mark
the start time and the end time, when the website gets fully
loaded
and all UI activity indicators stop. We verify that tc is an
accurate
estimate for application loading time. We also define the
average
CPU usage between time 0 and tc to be the CPU usage for this
application.
Compared with a previous approach for measuring web brows-
ing performance by modifying and instrumenting WebKit [33],
our
approach is more lightweight and easily extensible to other
31. appli-
cations other then web browsers, with reasonable accuracy. One
limitation of our approach is that it is not applicable for appli -
cations, e.g., streaming video/audio and some game
applications,
whose CPU usage remains high after initial loading.
4. LTE NETWORK CHARACTERIZATION
We present network measurement results from publicly
deployed
4GTest in this section. In addition, we carry out extensive local
measurement on an LTE network to infer RRC and DRX
parame-
ters, and understand the impact of various factors on network
per-
formance.
4.1 Comparing LTE to other mobile networks
20
25
30
35
40
45
50
-130 -120 -110 -100 -90 -80 -70
33. T
(
m
s
)
Idle time between packets (second)
Tpro
Ttail
Tpi
Tpi-Toni
Figure 7: LTE RTT v.s. inter-packet idle time.
4GTest was initially released on Android Market on 10/15/2011.
Till 12/15/2011, there has been altogether 3294 global users and
13768 runs. In the analysis, we focus on 2292 users and 7063
runs
inside the U.S., among which 380 are LTE users with 982 runs.
We check the distribution of 4GTest users for different network
types. For example, in Figure 6, the coverage of LTE, WiMAX,
and WiFi are mostly similar, covering 39, 37 and 44 states in
the
U.S., respectively. We also observe that other networks have
sim-
ilar coverage across the U.S. This indicates that 4GTest data set
enables fair comparison on the distribution of performance
metrics
for different mobile networks in the U.S.
Figure 5 summarizes the performance comparison among vari -
34. ous mobile networks based on 4GTest data set. We present
anonymized
data based on the technology type. The box plot for each metric
shows the 95th, 75th, 50th, 25th and 5th percentile among all
mea-
surements for each network type. We observe that LTE network
has a high downlink and uplink throughput, with the median to
be
12.74Mbps and 5.64Mbps, respectively, which is much higher
than
WiFi’s 4.12Mbps (downlink) and 0.94Mbps (uplink), as well as
4.67Mbps (downlink) and 1.16Mbps (uplink) for WiMAX. The
3G
family, including eHRPD, EVDO_A and HSDPA clearly lag be-
hind LTE. We also observe relatively high variation on LTE
through-
put for different users at different locations, and even for the
same
user at the same location across different runs.
In terms of RTT and RTT jitter, LTE with the median RTT
69.5ms
and RTT jitter 5.6ms is comparable to WiFi’s 64.5ms (RTT) and
7.9ms (RTT jitter). Similar to throughput comparison, WiMAX
also lags behind LTE with median RTT to be 125.0ms and RTT
jitter to be 21.0ms. For 3G networks, compared with our previ -
ous study [24], median RTT has been reduced from a median of
400ms to below 200ms, some even has a median of 78ms
(HSDPA
2), close to LTE RTT. RTT jitter for 3G networks are all larger
than
10ms.
To summarize, Figure 5 provides a fair comparison on perfor -
mance distribution among different mobile networks, from
which
35. we observe that LTE significantly improves network throughput
as
well as RTT and jitter, making it comparable to or even better
than
WiFi for throughput. WiMAX lags behind LTE, followed by
HS-
DPA, eHRPD and EVDO_A networks.
4.2 Network-based LTE parameter inference
Figure 7 summarizes the network-based approach for LTE state
machine and DRX parameter measurement using LTE Phone,
with
the methodology discussed in §3.1.2. Each point is the median
of
five runs and for each run, RTT is measured after making LTE
Phone
idle for a specific time. The pattern of RTT is expected as inter -
0
5
10
15
20
25
30
WiFi LTE WiMAX eHRPD EVDO_A 1 EVDO_A 2 HSDPA 1
37. (M
b
p
s
)
Y
2
:
R
T
T
(
m
s
)
Downlink throughput (Y1)
Uplink throughput (Y1)
RTT (Y2)
RTT jitter (Y2)
Figure 5: 4GTest result analysis based on network type?.
?Each network type corresponds to the data of one cellular ISP,
except for WiFi which has data of various ISPs.
0
20
38. 40
60
80
100
0 200 400 600 800 1000 1200 1400
D
e
la
y
(
m
s
)
Packet size without TCP/IP headers (byte)
UP OWD
DOWN OWD
RTT
Figure 8: OWD/RTT v.s. packet size in LTE network.
packet idle time changes. Based on these results, we can infer
the
values of the following parameters in Table 2: Ttail is around
11.5s,
Tpi is 1.28s and Toni is close to 45ms. In addition, we observe
Tpro
39. is around 260ms. These measured values agree with those mea-
sured from the power-based approach in Table 3, cross-
validating
our measurement methodology.
4.3 One-way delay and impact of packet size
With the setup in §3.1.2, we measure uplink/downlink one-way
delay (OWD) for both LTE and WiFi networks. Experiment in
WiFi shows that both uplink and downlink OWD are around
30ms
with little correlation with packet size, and RTT is stable
around
60ms. However, for LTE, Figure 8 shows that uplink OWD is
clearly larger than downlink OWD. We also observe that uplink
OWD for LTE slightly increases as packet size grows, while the
median of downlink OWD stays more stable around 30ms. The
median RTT ranges from 70ms to 86ms as packet size increases.
In
summary, RTT in LTE is more sensitive to packet size than
WiFi,
mainly due to uplink OWD.
4.4 Mobility
Requirements for LTE [12] specifies that mobility across the
cel-
lular network should be supported and optimized for low mobile
speed from 0∼15 km/h. Higher mobile speed of 15∼120 km/h
should be supported with high performance. In this paper, we
carry
out one of the first studies to quantify the impact of mobile
speed
for a commercial LTE network.
40. We measure RTT and downlink/uplink throughput with 4GTest
at three different mobile speeds: stationary, 35mph and 70mph,
highway speed limit. All experiments are done in the same car
for
fair comparison. Given that 4GTest takes less than 2 minutes to
fin-
ish, handover seldom happens during a single test and we filter
out
samples with cell ID changed during the test. Previous work
[29]
has shown that signal strength varies across locations and has a
non-negligible impact on performance, so we only select sample
points with the similar signal strength for fair comparison.
We observe that RTT remains stable at different speeds, with
small variation. Uplink and downlink throughput both have high
variation of 3∼8Mbps. Comparing throughput at different
speeds,
there is no clear difference, given the high variation. Our exper -
iments show that at least at our test location, there is no major
performance downgrade at high speed for LTE, satisfying the
re-
quirements in [12].
In addition, we also study the correlation between LTE perfor -
mance and time of day. We periodically run 4GTest for 48 hours
in
two randomly selected days. RTT’s median value remain stable
at
68ms across different hours. Notice that we do not use the
4GTest
results from real users to study this time of day pattern, because
those results may also contain user-specific and location-wise
fac-
tors which affect the performance and are hard to be excluded.
For
41. downlink and uplink throughput, variation across different
hours is
observed; however, there is no strong correlation with time of
day.
This may imply that, at our location, LTE currently does not
have
too many users and has well-provisioned resources available.
To summarize, with both global experiments, via 4GTest, and
local experiments, we observe that LTE has significantly
improved
network performance over 3G, making it comparable to, if not
bet-
ter than, WiFi.
5. LTE POWER MODEL CONSTRUCTION
This section summarizes the construction of the new LTE power
model, as well as the 3G and WiFi model measured from the
same
LTE Phone. We then compare energy efficiency in bulk data
trans-
fer for different networks and validate LTE power model in the
end.
5.1 Power model for RRC and DRX
With the experimental setup described in §3.2, we measure
power
model for LTE, 3G, and WiFi on LTE Phone, summarized in Ta-
Power? Duration Periodicity
(mW) (ms) (ms)
42. Screen off (base) 11.4±0.4 N/A N/A
Screen 100% on 847.2±2.7 N/A N/A
LTE promotion 1210.7±85.6 Tpro: N/A
260.1±15.8
LTE Short DRX On
1680.2±15.7 Ton: Tps:
RRC_CONNECTED 1.0±0.1 20.0±0.1
LTE Long DRX On
1680.1±14.3 Ton: Tpl:
RRC_CONNECTED 1.0±0.1 40.1±0.1
LTE tail base 1060.0±3.3 Ttail: N/A
11576.0±26.1
LTE DRX On
594.3±8.7 Toni: Tpi:
RRC_IDLE 43.2±1.5 1280.2±7.1
3G promotion 659.4±40.4 582.1±79.5 N/A
3G DCH tail base 803.9±5.9 8088.2±149.6 N/A
3G FACH tail base 601.3±6.4 824.2±148.1 N/A
3G DRX (idle) 374.2±13.7 55.4±1.5 5112.4±37.7
WiFi promotion 124.4±2.6 79.1±15.1 N/A
WiFi tail base 119.3±2.5 238.1±9.2 N/A
WiFi beacon (idle) 77.2±1.1 7.6±0.1 308.2±1.0
Table 3: LTE, 3G, and WiFi power model.
?All power readings in this table include the base power (screen
43. off),
which has negligible impact on total energy.
ble 3. The LTE parameter values are validated by the network-
based measurement in §4.2. For simplicity, we ignore the WiFi
AP
scanning and association, assuming UE is already connected
with
an AP.
First, we observe that LTE reduces the promotion delay (Tpro)
from 3G’s 582.06ms to 260.13ms. However, the power level is
almost doubled, i.e., 1210.74mW (LTE) v.s. 659.43mW (3G).
WiFi
has the most lightweight state promotion with smaller Tpro and
much lower power level.
Secondly, LTE appears to have longest tail (11.576 seconds)
with
highest tail base power (1060.04 mW). Summing up DCH and
FACH tail, 3G’s total tail time (8.9 seconds) is smaller than
LTE’s
Ttail of 11.6 seconds. Even 3G DCH’s tail base power is
24.17%
lower than LTE’s tail base power, and the gap becomes 25.25%
if
we consider LTE DRX in RRC_CONNECTED with a high on
dura-
tion power (1680.20mW). WiFi is much more power efficient,
with
shorter tail and much lower base power.
We also compare LTE DRX in RRC_IDLE with 3G DRX and
WiFi beacon in the idle state. LTE has the highest on power and
slightly smaller On Duration than 3G, while WiFi has smallest
on
44. power and On Duration. The cycle of LTE (1.28 seconds) is in
between 3G and WiFi.
Based on these observations, LTE is less energy efficient during
idle state and for transferring smaller amount of data. For exam-
ple, if only one packet is transferred, the energy usage
considering
both promotion and tail energy for LTE, 3G and WiFi is 12.76J,
7.38J and 0.04J, respectively. One possible reason for LTE’s
higher
power states is that devices must incorporate multiple-input and
multiple-output (MIMO) to support LTE network, e.g., the test
de-
vice we use has 1 transmit antenna and 2 receive antennas,
which
contributes to higher power consumption.
5.2 Power model for data transfer
Previous work on 3G UMTS power modeling either treats DCH
power state to have a fixed power value [35, 28], or assumes en-
ergy per bit to be the same constant for both uplink and down-
αu (mW/Mbps) αd (mW/Mbps) β (mW) αu/αd
LTE 438.39 51.97 1288.04 8.44
3G 868.98 122.12 817.88 7.12
WiFi 283.17 137.01 132.86 2.07
Table 4: Data transfer power model.
link [18]. These assumptions might be reasonable given that 3G
has relatively low data rates. However, for LTE, we observe
that
device power is much higher during high speed data
transmission
45. (up to 3300mW for uplink) relative to the base power
(1060mW)
in RRC_CONNECTED, and there is significant difference
between
downlink and uplink power levels at the same data rate. In this
paper, we propose a new comprehensive power model for LTE
em-
pirically derived in a commercial LTE network.
We start with measuring device power states with controlled up-
link or downlink throughput. The impact of TCP ACK packets,
which are small in size, is minor, thus ignored.
Figures 9 and 10 present the power-throughput curve for LTE,
3G, and WiFi. The curves are limited by the peak data rate we
can achieve at the test location. We observe that for all
networks, a
linear model fits well for both uplink and downlink. Assume
uplink
throughput is tu (Mbps) and downlink throughput is td (Mbps),
the
power level (mW) for uplink is Pu = αutu + β and for downlink
Pd = αdtd + β. The best fit parameters are listed in Table 4.
By looking at αu/αd, we notice that uplink power increases
faster than downlink for all three networks types. This is
expected
because sending data requires more power than receiving data
for
wireless data access [21]. LTE has the largest gap of αu/αd =
8.44 among three network types. This is largely because αd for
LTE is quite small. For 3G, both αu and αd are larger than LTE.
β
is the base power when throughput is 0, with the ranking of LTE
>
3G > WiFi. This is consistent with the tail base power
46. comparison
in Table 3. We notice that β is slightly higher than the tail base
for all networks types. This is possibly because of the overhead
of
switching transmitters or receivers into high speed mode.
For simultaneous uplink and downlink transfers, given that
trans-
mitters and receivers are separate, we conjecture that the power
level (mW) is given by the following formula:
P = αutu + αdtd + β
To validate this conjecture, we measure the power levels for
con-
current uplink and downlink transfers in Figure 11. Assume
total
throughput t = tu +td and the ratio of uplink throughput � = tu
/
t:
P = αutu + αdtd + β = (αu −αd)t� + αdt + β
When t is a constant, P grows linearly with � and the slope is
(αu−
αd)t. Figure 11 shows two curves of t = 1Mbps and t = 2Mbps,
both having a strong linear pattern and the slope is less than 5%
off
the expected value.
5.3 Energy efficiency for bulk data transfer
To compare the power efficiency of different networks in the
wild, we use bulk data transfer experiments to measure energy
per
47. bit. Perrucci et al. [26] measure energy per bit for 3G and WiFi
with a fixed bulk size. In addition to taking LTE into consider -
ation, we vary the bulk size to cover more possible network us -
age scenarios. Figure 12 shows the measured energy per bit in
µJ/bit (10−6Joule/bit) with different bulk data size. All data is
randomly generated so that there is no chance for caching. We
do
not include promotion or tail energy but instead focus on data
trans-
fer energy. Given that signal strength and peak data rate on
wireless
1000
1500
2000
2500
3000
3500
0 5 10 15 20
P
o
w
e
r
(m
48. W
)
Throughput (Mbps)
LTE DOWN
LTE UP
Figure 9: Power-throughput curve for LTE net-
work.
0
250
500
750
1000
1250
0 500 1000 1500 2000
P
o
w
e
r
(m
W
49. )
Throughput (kbps)
3G DOWN
3G UP
WiFi DOWN
WiFi UP
Figure 10: Power-throughput curve for 3G and
WiFi.
1200
1400
1600
1800
2000
2200
2400
0 0.2 0.4 0.6 0.8 1
P
o
w
e
r
50. (m
W
)
Ratio of uplink throughput: UP/(UP+DOWN)
UP + DOWN = 2Mbps
UP + DOWN = 1Mbps
Figure 11: Power of simultaneous uplink and
downlink transfers.
0
2
4
6
8
10
12
14
10 100 1000 10000
µ
J
/
b
51. it
Bulk data size (kB)
LTE DOWN
LTE UP
WiFi DOWN
WiFi UP
3G DOWN
3G UP
Figure 12: Energy per bit for bulk data transfers.
networks fluctuates, both affecting energy per bit, our
measurement
only serves as a sampled view for the energy efficiency of
different
networks.
First, energy per bit decreases as bulk data size increases,
largely
because with a small data size, throughput does not reach link
ca-
pacity due to TCP slow start. We also observe that LTE’s
energy
per bit in downlink is comparable with WiFi, although the
absolute
power level of LTE is much higher than WiFi. This is due to
high
downlink throughput for LTE at our test location, even
compared
with the WiFi network. Similarly, for LTE uplink, it drops from
10µJ/bit to less than 1µJ/bit as bulk data size increases. With
bulk data size of 10MB, LTE consumes 1.62 times the energy of
52. WiFi for downlink and 2.53 for uplink. With lowest throughput,
3G has the worst energy efficiency for large data transfer, e.g.,
for
downloading 10MB data, 3G requires 21.50 times the energy of
LTE and 34.77 times the energy of WiFi, and for uplink, 7.97
times
of LTE and 20.16 times of WiFi.
5.4 Power model validation
To validate the LTE power model and the trace-driven
simulation
(§3.3.2), we compare measured energy (measured from LTE
Phone)
with simulated energy for case study applications. Table 5
contains
the sample application usage scenarios described in §3.4. The
error
rate is consistently less than 6%, with the largest error rate from
Website Y, which includes heavy JavaScript execution and
HTML
rendering. Since our power model focuses on radio power and
ig-
nores the impact of CPU, for Website Y, the total energy usage
is
slightly underestimated.
The error rate is increased if the impact of downlink and uplink
throughput is ignored, i.e., assuming αu = αd = 0. However,
the increase is not significant, at most 1.5%. This is because for
App
Measured Simulated
Error
energy (J)1 energy (J)1
53. Website G3 24.77 24.37 -1.61% (-2.06%2)
Website Y3 31.84 30.08 -5.53% (-7.04%)
YouTube 21.81 21.14 -3.07% (-4.17%)
NPR News 24.65 24.37 -1.12% (-1.70%)
Market 38.64 38.03 -1.58% (-3.03%)
1Both measured and simulated energy include tail energy
2This error is for simulated energy assuming αu = αd = 0
3Refer to §3.4 for the definition of Website G and Website Y
Table 5: LTE power model validation.
these web-based applications, network throughput is low due to
small object size (§7.2). For other applications, such as
video/audio
streaming and file download, we expect to see a larger gap in
error
rate if the impact of downlink/uplink is ignored.
In this section, in addition to comparing energy per bit in bulk
data transfer for different networks, we construct a new LTE
power
model and validate its accuracy, which is the basis for the
following
analysis.
6. USER TRACE BASED TRADEOFF ANAL-
YSIS
In this section, we apply the LTE power model to UMICH data
set and compare energy efficiency with 3G and WiFi, with
detailed
break down of the total energy. We then study the tradeoff of
con-
54. figuring different LTE parameters via our analysis framework.
6.1 Energy efficiency comparison
We use the UMICH data set to simulate the LTE, WiFi and 3G
model. Assume that the simulated energy usage for LTE, WiFi
and
3G power model is Elte, Ewifi and E3g, respectively, the energy
ratio of LTE/WiFi is defined as Elte/Ewifi, and that for
3G/WiFi
is calculated as E3g/Ewifi. With the same traces, we can make
fair comparison among different power models to understand
their
energy efficiency.
In Figure 13, we compare the energy efficiency of different net-
works for the 20 users both individually and in aggregate
(summing
up for all users). We first observe that LTE power model
consumes
significantly more energy than WiFi. The ratio of LTE/WiFi
ranges
from 16.9 to 28.9 and the aggregate ratio for all users is 23.0.
No-
tice that the gap between LTE and WiFi is larger compared with
the bulk data transfer experiments in §5.3. This is because, for
bulk
data transfer, LTE’s high throughput could compensate the low
en-
ergy efficiency, compared with real traces, which do not
saturate the
link capacity. Second, for 3G/WiFi ratio, the range is between
10.8
55. 0
5
10
15
20
25
30
All 1 2 3 4 5 6 7 8 9 10 11 12 13 14 15 16 17 18 19 20
E
n
e
rg
y
r
a
ti
o
User ID
Energy ratio: LTE/WiFi
Energy ratio: 3G/WiFi
Figure 13: Power model simulation: energy ratio.
57. W
iF
i
3
G
% Idle energy
% Tail energy
% Promotion energy
% Data transfer energy
Figure 14: Break down of energy usage in analysis.
and 18.0, and in aggregate, 3G/WiFi ratio is 14.6, lower than
LTE.
In summary, the energy efficiency for LTE is lower than 3G,
with
WiFi having a much higher energy efficiency. Notice that in
this
work, we do not consider AP association energy for WiFi
networks
due to the lack of such information, so Ewifi is an
underestimate.
However, we believe that AP association does not happen very
of-
ten and the impact is not significant.
6.2 Energy consumption break down
To further understand the energy consumption, with the method-
ology discussed in §3.3.2, it is decomposed into promotion
energy,
data transfer energy, tail energy, and idle energy in Figure 14
58. with
results for aggregate analysis and 6 sample users. These energy
values are calculated including the UE base power.
Promotion energy contributes to a small portion (< 4%) of the
total energy for all networks, i.e., in aggregate, its contribution
is
only 1.2%, 2.5% and 2.6% for LTE, WiFi, and 3G, respectively.
In
terms of idle energy, WiFi has significantly higher percentage
than
LTE and 3G, despite small average power difference at idle
state
across networks, i.e., 31.1mW 3 for LTE, 13.0mW for WiFi and
15.3mW for 3G. This is explained by WiFi’s smaller total
energy,
making its idle energy contribution relatively higher.
Aggregate data transfer energy percentage is 47.1%, 42.1% and
3The idle power for LTE network is calculated as the average
power
of a DRX cycle in RRC_IDLE, and similarly for WiFi and 3G
net-
works.
46.2% for LTE, WiFi and 3G, respectively. The variation across
users is high, e.g., for LTE network, it ranges from 22.0% to
62.3%,
due to traffic pattern differences across users.
Surprisingly, the biggest energy component for LTE network is
tail, rather than data transfer. The average tail energy for LTE
and
3G is 48.2% and 48.1% respectively compared to 7.2% for
WiFi.
59. Our observation for 3G is consistent with previous study [18].
Com-
bined with high data transfer energy due to the higher power
levels,
tail energy lowers the energy efficiency of LTE and 3G
compared
to WiFi.
6.3 Impact of LTE parameters
Similar to §6.1, we use WiFi traces in the UMICH data set to
study the impact of LTE parameter configuration on radio
energy
E, channel scheduling delay D, and signaling overhead S. E is
the simulated total energy consumed by UE. Since most energy
is
consumed by radio interfaces, with display energy excluded, we
approximate this total energy as radio energy. D is the sum of
scheduling delay for all packets, resulting from two factors:
wait-
ing for the next DRX cycle’s on duration for a downlink packet
and
waiting for Tpro during RRC_IDLE to RRC_CONNECTED
promotion.
S is the overhead of the LTE network for serving this UE. S has
different definitions in our study given that different parameters
studied affect signaling load in different ways, e.g., Ttail
affects
mostly the state promotions, and Tpi affects the total on
duration in
RRC_IDLE. D and E directly affect end users via application
delay
and battery life time; S is of interest to cellular ISPs for
supporting
large user base at low cost.
60. 6.3.1 Impact of LTE tail timer Ttail
In Figure 15, we study the impact of LTE tail timer Ttail, with S
defined to be the total number of RRC_IDLE to
RRC_CONNECTED pro-
motions. Ttail varies from 1 second to 30 seconds. TD is the de -
fault configuration of 11.58 seconds for Ttail in the measured
LTE
network with the corresponding values of E, D and S calculated
as ED, DD and SD, respectively. When Ttail is set to be T
′, sim-
ilarly, we get E′, D′ and S′. The change relative to the default
setting is calculated as ∆(E) = (E′−ED)/ED, and similarly for
∆(D) and ∆(S). ∆s for each Ttail values are plotted in Figure 15
and they are all 0 at TD.
As expected, a larger Ttail value reduces both D and S, at the
cost of E. We observe that ∆(S) and ∆(D) curves are almost
identical, since most channel scheduling delay results from idle
to
active promotions. In addition, the impact of Ttail on the radio
energy E is significant. For example, when Ttail is set to be 30
seconds, total radio energy E increases by 55%, while for Ttail
=
1 second, E decreases by 65%, at the cost of 143% ∆(D) and
169% ∆(S). This indicates that Ttail is a very important
parameter
for LTE network.
In previous study [28], traffic bursts attribute to low
efficiencies
of radio resource and energy utilization in 3G UMTS network,
due
to tail time. Given that LTE has similar tail time, we analyze
the
61. bursts in the UMICH data set. We follow the same definition of
a
burst as in [28], which is a sequence of consecutive packets
whose
inter-arrival time is less than a threshold δ, with δ set to be 1.5
seconds, since it is longer than common cellular RTTs [24].
From
ISP’s perspective, Ttail should not be smaller than majority of
the
inter-burst delays; otherwise, a larger number of promotions
would
be triggered.
We study the inter-burst delay in the 3G and WiFi traces of
UMICH data set in Figure 19. For 3G traces, 67.3% inter-burst
delays are smaller than the default value of Ttail (11.58
seconds),
and 55.4% for WiFi traces. Compared with WiFi traces, 3G
traces
-0.5
0
0.5
1
1.5
0 5 TD 15 20 25 30
∆
(
67. F
Inter-burst delay (sec)
3G
WiFi
Figure 19: CDF of Inter-burst delay for
UMICH data set.
0
0.2
0.4
0.6
0.8
1
0 0.05 0.1 0.15 0.2
C
D
F
Inter-packet delay (sec)
3G
WiFi
Figure 20: CDF of Inter-packet delay for
68. UMICH data set.
have smaller inter-burst delays. We also observe the inter-burst
de-
lay distribution for different users have non-negligible
differences.
This makes us believe that a per-UE based dynamic Ttail
config-
uration mechanism, adapting to traffic patterns, provides a
better
chance for optimizing radio resource efficiency and balancing
en-
ergy utilization. Notice that this approach is inside the radio ac -
cess network and transparent to UE. Previous study on 3G
UMTS
network also points out two possible approaches to deal with
the
tail effect with support from UE, i.e., applications proactively
alter
traffic patterns based on the state machine behavior without
inter-
action with the network, or cooperate with the radio access
network
in allocating radio resources by fast dormancy [11, 13]. These
ap-
proaches remain to be applicable solutions for the tail problem
in
LTE.
6.3.2 Impact of DRX inactivity timer Ti
Figure 16 shows the tradeoff of setting DRX inactivity timer Ti.
Signaling overhead S is defined as the sum of the continuous
recep-
tion time and DRX on durations in RRC_CONNECTED, since
during
69. these time slots, UE exchanges control messages with eNB
(base
station of LTE network) [30]. A larger Ti keeps UE in continu-
ous reception longer and reduces the scheduling delay for
downlink
packets, i.e., no DRX waiting time, at the cost of higher energy
us-
age, since continuous reception has higher power level than
DRX
idle state. TD is the default value 100ms.
We observe that Ti has negligible impact on E, with only 2%
∆(E) as Ti is set to be 1 second. Different from E, S is sig-
nificantly affected by Ti. For D, when Ti is set to be small than
100ms, ∆(D) grows up to 80%. However, even when Ti is set
to be as large as 1 second, D is only reduced by 16%. This can
be
partly explained by Figure 20 that 88.6% packet pairs has ≤
100ms
inter-packet delay for 3G traces and 92.3% for WiFi traces in
the
UMICH data set. Decreasing Ti causes more packets arrive
outside
of continuous reception, which may experience DRX delay.
Hence
similar to Ttail, the setting of Ti is also affected by the traffic
pat-
tern, i.e., inter-packet delay distribution, which may differ
across
users.
6.3.3 Impact of DRX cycle in RRC_CONNECTED
In RRC_CONNECTED, Short DRX cycle timer Tis determines
the
70. transition from Short DRX to Long DRX. Given that we already
vary the DRX cycle to understand its impact, for simplicity, we
assume Tis to be 0, i.e., the DRX cycle in RRC_CONNECTE D
refers
to Long DRX cycle Tpl.
In Figure 17, S is defined similarly as in Figure 16, i.e., the sum
of continuous reception time and DRX on durations. TD is
40ms,
the default setting for Tpl. First, we notice that compared with
TD, when Tpl is set to be 100ms, energy saving ∆(E) is minor
(0.2%) with 13.0% reduction in S, at the cost of 40% increase in
D.
So Tpl is not recommended to be set much higher than TD
unless
ISP prioritizes S reduction. When Tpl is set to be a small value,
for example 2ms, E increases by 21.9% and D reduces by
18.1%,
with a significant increase in S of 412.9%. Especially for ISPs
with
fast growing LTE user volume and congested radio access
network,
DRX cycle in RRC_CONNECTED is not recommend to be set to
too
small values. We omit the simulation results for Short DRX
cycle
Tps and Short DRX timer Tis, since reducing Tps or increasing
Tis has similar effect of decreasing Tpl, i.e., resulting in a
shorter
average DRX cycle, and their impact is similar as in Figure 17.
6.3.4 Impact of DRX cycle in RRC_IDLE
Similarly to RRC_CONNECTED, we study the impact of DRX
cy-
cle in RRC_IDLE. Under this setting, signaling overhead S is
71. de-
fined to be the total on duration of DRX cycles in RRC_IDLE,
dur-
ing which control messages are exchanged between UE and eNB
[30].
In Figure 18, the default setting 1.28s is shown as TD. The
impact
of Tpi on E is not significant when Tpi is larger than TD, with
0.7% energy saving when Tpi set to be 2.0s, which also brings
in
21.3% increase in D and 31.7% reduction in S. When Tpi is set
to
Samsung/IE
Windows Mobile 6.5
iPhone/Safari
iOS 3.0
G1/Default
Android 1.6
G1/Default
Android 1.6
Samsung/IE
Windows Phone 7.5
HTC/Default
Android 2.2.1
iPhone 4/Safari
iOS 5.0.1
72. iPhone 4S/Safari
iOS 5.0.1
Laptop/Chrome
Mac OS X 10.7.2
0 50 100 150 200 250
Time to finish JavaScript benchmark (sec)
0.41s
2.26s
3.93s
4.42s
9.46s
95.08s
95.66s
117.41s
210.97s
Tested in Nov, 2009
Tested in Nov, 2011
Figure 22: JavaScript execution speed comparison.
be 100ms, the energy overhead is 26.2%, with 40.7% reduction
in
D and up to 1147.2% increase in S.
73. Similar to Tpl, Tpi causes significant signaling overhead when
set to be too small. Default values for both Tpl and Tpi are rea -
sonable settings and adjustment around the default
configurations
results in moderate impact on channel scheduling delay and
negli-
gible impact on radio energy.
In this section, we observe that LTE consumes up to 23 times
the total energy of WiFi in the simulation, and the tail problem
in
3G UMTS network is still a key contributor for the low energy
efficiency for LTE. Similar to 3G network, Ttail remains a key
parameter for LTE. In addition to the UE-participated
approaches
including proactive traffic shaping and fast dormancy proposed
by
previous study [27], we discuss a possible approach to solve the
tail
problem in LTE network, which dynamically adapts Ttail to
traffic
pattern at a per-UE base, being transparent to UE. Similar
obser-
vations are shared by the other LTE parameters and we leave
the
feasibility study of such dynamic parameter configuration
frame-
work for LTE as future work.
7. APPLICATION PERFORMANCE IMPACT
In this section, we try to identify the new bottleneck of web-
based smartphone applications in LTE and start with comparing
the processing power of contemporary smartphones.
74. 7.1 JavaScript execution
JavaScript execution is an important component in web transac-
tions and we use it as a sampled view of UE’s processing
power.
In 2009, we found that the JavaScript execution speed for
smart-
phone browsers could be up to 20∼80 times slower than desktop
browsers [24]. We revisit the JavaScript execution experiments
in
this study, as shown in Figure 22. We consistently use the same
benchmark [8] (version 0.9) to quantify the JavaScript
execution
speed. In Figure 22, the test results on the same G1 phone in
2009
and in 2011 are very close, validating that the benchmark of
that
version has not changed since 2009.
From 2009 to 2011, iOS has a speedup of 29.88 for iPhone 4
and
51.95 for iPhone 4S, while 21.64 for Android and 22.30 for
Win-
dows Phone. And the gap between smartphone and computer has
dropped to 5.5∼23.1 times in JavaScript execution speed.
Possible
reasons for this improvement include fast CPU, larger memory,
and
better OS and application software for smartphones.
7.2 Application case study
Along with improvements in mobile client processing power,
App Total payload Max obj size # objects Avg size
Website G 160.7KB 87.6KB 11 14.6KB
Website Y 509.9KB 124.2KB 59 8.6KB
75. YouTube 449.1KB 109.4KB 33 13.6KB
NPR News 306.2KB 169.5KB 9 34.0KB
Market 599.7KB 145.4KB 17 35.3KB
Table 6: HTTP object statistics.
LTE technology significantly increased network speed. So we
per-
form a case study of a few popular applications to understand
the
impact of network speed and processing power enhancement on
user-perceived performance.
With the measurement methodology discussed in §3.4, we com-
pare loading time, CPU usage, and energy consumption for five
ap-
plication usage scenarios in Figure 21. These usage scenarios
are
representative for web browsing and other similar web-based
ap-
plications, different from audio and video streaming
applications.
First, loading time comparison shows that LTE and WiFi have
comparable user-perceived delay for the studied scenarios, and
3G
lags behind with 50%∼200% larger response time. The applica-
tion loading time for LTE slightly lags behind WiFi. On one
hand,
given that promotion delay is counted into the loading time,
LTE
has larger Tpro. On the other hand, though LTE has faster
through-
put than WiFi with throughput tests, its RTT is slightly larger.
To
76. understand why RTT matters more than throughput for the
usage
scenarios in Figure 21, we analyze the object size statistics for
dif-
ferent applications in Table 6.
In Table 6, across all scenarios, the maximum object size is
169.5KB for NPR News and the average object size is at most
35.3KB for Android market. Especially for Website Y, there are
59 HTTP objects with an average size of only 8.6KB. Due to
TCP
slow start, these objects are far from saturating the link capacity
for either LTE or WiFi. Persistent TCP connections are
observed
to transfer multiple web objects; however, no HTTP pipelining
is
observed. We also observe up to 5 parallel TCP connections to
different remote servers and even to the same remote server;
how-
ever the average low throughput, e.g., 364.2kbps for Website Y,
indicates that the RTT is more critical than available bandwidth
for
these web-based applications in LTE and WiFi.
We observe that average CPU usage for 3G network is relatively
low ranging from 35.5% to 70.8%, with an average of 57.7%.
CPU
usage for LTE is between 68.8% and 84.3%, averaging at
79.3%,
compared with WiFi’s 78.2%∼93.0% and 87.1% as average.
This
comparison implies that the gap between WiFi and cellular net-
work has narrowed because of LTE’s better network
performance.
For 3G network, network performance appears to be the
bottleneck,
77. resulting in underutilized processing power. Given that the
average
CPU usage for LTE and WiFi is already 80%∼90%, further
perfor-
mance optimization relies more on processing speed
improvement
and OS/application software enhancement, compared with
network
improvement. Work such as CloneCloud [20] on offloading
com-
putation into the cloud is one such promising direction.
In terms of energy usage, WiFi clearly has significantly higher
energy efficiency for the usage scenarios studied, similar to
previ-
ous discussions. 3G consumes 5.5∼7.8 times the energy of
WiFi,
with 20.9%∼55.6% of the total energy due to tail. While for
LTE,
energy usage is 5.4∼12.0 times of WiFi, with 32.2%∼62.2% tail
energy. We notice that, most of these applications keep some of
the existing TCP connections open even after the initial loading;
so
that if user generates subsequent requests, these connections
could
be reused. Similar to previous work [28], we observe that appli -
0
20
40
60
79. WiFi
NPR News
3G
Market
LTE
Market
WiFi
Market
3G
%
Website G: default browser loading mobile version of
google.com
Website Y: default browser loading non-mobile version of
yahoo.com
% Normalized loading time
% CPU usage
% Normalized total energy
% Normalized tail energy
Figure 21: Loading time, CPU usage and energy consumption
analysis on mobile applications.
?The loading time is normalized by the maximum loading time
observed in this figure, and similarly for total energy.
cations remain idle after the initial loading and a few TCP
control
80. packets are generated by UE to close the existing applications a
few seconds later, such as the packets seen at time 10.5 seconds
in
Figure 4, which reset Ttail and further increase the high-power
tail
length.
In this section, we observe that contemporary smartphones have
reduced gap with desktop computers in terms of processing
power.
However, for web-based applications, downloading mostly
small
sized objects, the performance bottleneck is still at the UE
process-
ing side, given the significant improvement in network speed
for
LTE.
8. RELATED WORK
We summarize related work in three categories below.
Measuring 2G and 3G networks. Prior study [18] investigates
the impact and the optimization of tail effects in 2G/3G
networks.
Previous work [27] characterizes the impact of RRC state
machine
on radio resources and energy by analyzing a dataset collected
from
a commercial UMTS network. Recent work [22] also
investigates
impact of traffic patterns on radio power management policy.
Other
measurement studies (e.g., 3GTest [24], LiveLab [31], and [23])
collect traces from real smartphone users, focusing on
characteriza-
tion at only IP and higher layers. None of them investigate
81. resource
management policy in 4G LTE networks.
Smartphone power modeling has also been investigated by pre-
vious empirical measurements. The Bartendr project [29] stud-
ies the relationship between signal strength and smartpho ne
radio
power usage. PowerTutor [35] collects power traces for individ-
ual hardware components under controlled experiments then
uses
multi-variable regression to compute the coefficients for a
linear
power model considering all hardware components. ARO [28]
em-
ploys an approach similar to [35] but focusing only on radio
power
usage. It performs more fine-grained simulation of transmission
queues to capture state transitions. Our LTE power model is
also
empirically derived, but it differs from all aforementioned
models
in two aspects. First, it considers DRX in RRC_CONNECTED,
a new
power management mechanism in LTE networks. Second, it fur-
ther takes into account both uplink and downlink data rates,
result-
ing in a more accurate estimation of the radio power
consumption
when the throughput is high, as is a common case in LTE
networks.
DRX in 4G LTE networks. Zhou et al. [36] model the DRX
mechanism as a semi-Markov process, with which they analyti-
cally study the effects of DRX parameters on the performance,
as
well as the tradeoff between the power saving and wake-up
82. delay.
Kolding et al. [25] also investigate the balance between
throughput
and power saving by changing the configuration of DRX
parame-
ters, using a web-browsing traffic model. Bontu et al. [19]
further
considers the impact of DRX parameters on different
applications
with various delay sensitivities. Wigard et al. compares a long-
DRX-only scenario and a scenario with both long and short
DRX,
in terms of throughput and power consumption. All above stud-
ies employing analytical models suffer from an inherent
limitation:
the expressiveness of an analytical model is quite limited and is
unlikely to capture the characteristics of real-world traffic
patterns
using a statistical distribution with a few parameters. The
existence
of concurrent applications accessing the network further
increases
the difficulty of modeling the packet dynamics. In contrast, our
work is the first empirical study to investigate the impact of the
configurations of DRX parameters and tail timer. We overcome
the above limitation by employing network traces from real
smart-
phone users, thus more realistically revealing the complex
tradeoffs
incurred by various DRX parameters.
9. CONCLUSION
In this paper, we take one of the first steps in understanding
per-
83. formance and power characteristics of 4G LTE networks. With
publicly deployed 4GTest, we observe that LTE has
significantly
higher downlink and uplink throughput, compared with 3G and
even WiFi. To characterize power usage for LTE, we derive the
first comprehensive power model of a commercial LTE network,
with less than 6% error rate. By applying the power model to a
comprehensive data set, UMICH, we identify that LTE is much
less
power efficient than WiFi, and the key contributor is the tail
energy,
controlled by Ttail. In addition, via a case study, we identify the
UE processing to be the new bottleneck for web-based
applications
in LTE networks.
Our work opens new research opportunities for the new LTE
net-
work, such as optimizing smartphone applications with tools
simi-
lar to ARO [28] with the energy model derived in this paper,
and op-
timizing LTE parameter configuration with UE-based
approaches
(e.g., fast dormancy) or network-based approaches to improve
ra-
dio resource and energy efficiency.
10. ACKNOWLEDGEMENT
This work is partly funded by NSF grants CNS-1059372, CNS-
1050157, CNS-1039657 and Navy grant N00014-09-1-0705. We
would like to thank Zhiyun Qian, Doug Sillars and the shepherd
Sharad Agarwal for their valuable comments on the paper. We
would also like to thank the participants in our user study and
anonymous reviewers whose comments helped improve the final
84. version.
11. REFERENCES
[1] 3GPP LTE. http://www.3gpp.org/LTE.
[2] 4GTest. http://mobiperf.com/4g.html.
[3] BU-353 USB GPS Receiver. http:
//www.usglobalsat.com/p-62-bu-353-w.aspx.
[4] MaxMind. http://www.maxmind.com.
[5] Measurement Lab.
http://www.measurementlab.net/.
[6] MobiPerf (3GTest). http://mobiperf.com.
[7] Monsoon power monitor. http://www.msoon.com/
LabEquipment/PowerMonitor.
[8] SunSpider JavaScript Benchmark 0.9. http://www.
webkit.org/perf/sunspider/sunspider.html.
[9] TCPDUMP and LIBPCAP.
http://www.tcpdump.org/.
[10] 3GPP TR 25.813: Radio interface protocol aspects
(V7.1.0),
2006.
[11] UE "Fast Dormancy" behavior. 3GPP discussion and
decision notes R2-075251, 2007.
[12] 3GPP TR 25.913: Requirements for Evolved UTRA and
Evolved UTRAN (V9.0.0), 2009.
[13] Configuration of fast dormancy in release 8. 3GPP
85. discussion and decision notes RP-090960, 2009.
[14] 3GPP TS 25.304: User Equipment (UE) procedures in idle
mode and procedures for cell reselection in connected mode
(V10.2.0), 2011.
[15] 3GPP TS 36.211: Physical Channels and Modulation
(V10.3.0), 2011.
[16] 3GPP TS 36.321: Medium Access Control (MAC) protocol
specification (V10.3.0), 2011.
[17] 3GPP TS 36.331: Radio Resource Control (RRC)
(V10.3.0),
2011.
[18] N. Balasubramanian, A. Balasubramanian, and
A. Venkataramani. Energy Consumption in Mobile Phones:
A Measurement Study and Implications for Network
Applications. In IMC, 2009.
[19] C. S. Bontu and E. Illidge. DRX Mechanism for Power
Saving in LTE. In IEEE Communications Magazine, 2009.
[20] B.-G. Chun, S. Ihm, P. Maniatis, M. Naik, and A. Patt.
CloneCloud : Elastic Execution between Mobile Device and
Cloud. In Proceedings of 6th European Conference on
Computer Systems (EuroSys 2011), 2011.
[21] S. Cui, A. J. Goldsmith, and A. Bahai. Energy-Efficiency
of
MIMO and Cooperative MIMO Techniques in Sensor
Networks. In IEEE J. Sel. Areas Commun., vol. 22, no. 6, pp.
1089-1098, 2004.
[22] H. Falaki, D. Lymberopoulos, R. Mahajan, S. Kandula, and
86. D. Estrin. A First Look at Traffic on Smartphones. In Proc.
ACM SIGCOMM IMC, 2010.
[23] H. Falaki, R. Mahajan, S. Kandula, D. Lymberopoulos, and
R. G. D. Estrin. Diversity in Smartphone Usage. 2010.
[24] J. Huang, Q. Xu, B. Tiwana, Z. M. Mao, M. Zhang, and
P. Bahl. Anatomizing Application Performance Differences
on Smartphones. In MobiSys, 2010.
[25] T. Kolding, J. Wigard, and L. Dalsgaard. Balancing Power
Saving and Single User Experience with Discontinuous
Reception in LTE. In ISWCS, 2008.
[26] G. Perrucci, F. Fitzek, and J. Widmer. Survey on Energy
Consumption Entities on Smartphone Platform. In Vehicular
Technology Conference, 2009.
[27] F. Qian, Z. Wang, A. Gerber, Z. M. Mao, S. Sen, and
O. Spatscheck. Characterizing Radio Resource Allocation
for 3G Networks. In IMC, 2010.
[28] F. Qian, Z. Wang, A. Gerber, Z. M. Mao, S. Sen, and
O. Spatscheck. Profiling Resource Usage for Mobile
Applications: a Cross-layer Approach. In MobiSys, 2011.
[29] A. Schulman, V. Navda, R. Ramjee, N. Spring,
P. Deshpande, C. Grunewald, K. Jain, and V. N.
Padmanabhan. Bartendr: A Practical Approach to
Energy-aware Cellular Data Scheduling. In MobiCom, 2010.
[30] S. Sesia, I. Toufik, and M. Baker. LTE: The UMTS Long
Term Evolution From Theory to Practice. John Wiley and
Sons, Inc., 2009.
87. [31] C. Shepard, A. Rahmati, C. Tossell, L. Zhong, and
P. Kortum. LiveLab: Measuring Wireless Networks and
Smartphone Users in the Field. In HotMetrics, 2010.
[32] S. Sundaresan, W. de Donato, R. Teixeira, S. Crawford,
and
A. PescapÃĺ. Broadband Internet Performance: A View
From the Gateway. In SIGCOMM, 2011.
[33] Z. Wang, F. X. Lin, L. Zhong, and M. Chishti. Why are
Web
Browsers Slow on Smartphones? In HotMobile, 2011.
[34] J. Wigard, T. Kolding, L. Dalsgaard, and C. Coletti. On the
User Performance of LTE UE Power Savings Schemes with
Discontinuous Reception in LTE. In ICC Workshops, 2009.
[35] L. Zhang, B. Tiwana, Z. Qian, Z. Wang, R. P. Dick, Z. M.
Mao, and L. Yang. Accurate Online Power Estimation and
Automatic Battery Behavior Based Power Model Generation
for Smartphones. In CODES+ISSS, 2010.
[36] L. Zhou, H. Xu, H. Tian, Y. Gao, L. Du, and L. Chen.
Performance Analysis of Power Saving Mechanism with
Adjustable DRX Cycles in 3GPP LTE. In Vehicular
Technology Conference, 2008.
http://www.3gpp.org/LTE
http://mobiperf.com/4g.html
http://www.usglobalsat.com/p-62-bu-353-w.aspx
http://www.usglobalsat.com/p-62-bu-353-w.aspx
http://www.maxmind.com
http://www.measurementlab.net/
http://mobiperf.com
http://www.msoon.com/LabEquipment/PowerMonitor
http://www.msoon.com/LabEquipment/PowerMonitor
88. http://www.webkit.org/perf/sunspider/sunspider.html
http://www.webkit.org/perf/sunspider/sunspider.html
http://www.tcpdump.org/IntroductionBackgroundRadio
Resource Control (RRC) and Discontinuous Reception (DRX) in
LTESmartphone power model for LTEMethodologyNetwork
measurementThe design of 4GTestLocal network
measurementPower measurementTrace-driven analysisUMICH
data set for analysisTrace-driven modeling
methodologyApplication performanceLTE network
characterizationComparing LTE to other mobile
networksNetwork-based LTE parameter inferenceOne-way delay
and impact of packet sizeMobilityLTE power model
constructionPower model for RRC and DRXPower model for
data transferEnergy efficiency for bulk data transferPower
model validationUser trace based tradeoff analysisEnergy
efficiency comparisonEnergy consumption break downImpact of
LTE parametersImpact of LTE tail timer TtailImpact of DRX
inactivity timer TiImpact of DRX cycle in
RRC_CONNECTEDImpact of DRX cycle in
RRC_IDLEApplication performance impactJavaScript
executionApplication case studyRelated
WorkConclusionAcknowledgementReferences
25
“hot” item, frequently debat-
ed in the wireless community these days, is whether there is
such a thing as a “fourth generation” (4G) of wireless systems
that is likely to appear after the successful deployment of the
current third-generation (3G) systems, say five to ten years
from now. This new generation of wireless systems is sup-
posed to complement and replace 3G systems, as well as sec-
ond-generation (2G) systems that have already been in use for
about a decade. A “classic” approach would design such a
89. “system” in the same way as previous generations of wireless
systems, that is, yet again focus on higher data rates (now
beyond 2 Mb/s) and find new frequency bands for a world-
wide standard (e.g., [1]). For a number of reasons, however, it
is not obvious that the roadmap is this straightforward. One of
the main concerns is that 4G wireless infrastructures will be
deployed in an environment where many other types of wire-
less, and wired, communications systems are already present.
Furthermore, some people argue that future wireless commu-
nications will become focused on services and user needs,
thereby forcing the mixture of available wireless infrastructure
elements to be used in a more transparent way [2, 3]. In that
case, the previously so important air interface standard and
frequency band issues will become secondary concerns.
By definition it is difficult to make precise statements on
the nature of this kind of vision. An important factor con-
tributing to this uncertainty is that we have very limited
knowledge about the future environment in which a 4G wire-
less infrastructure should function. Which of today’s systems
will still exist when a potential 4G infrastructure is deployed?
Which systems and solutions will be considered successful
then? What technical bottlenecks will be apparent 10 years
from now? What market impact will 3G wireless systems
have? How will this affect user behavior and user demand?
How much money are prospective users willing to pay for ser -
vices provided over this infrastructure?
As these questions indicate, defining relevant research top-
ics with regard to future systems is not an easy task. Neverthe-
less, experience tells us that fundamental research related to
4G systems has to be carried out today in order to make it
possible to deploy them a decade from now. We can thus for -
mulate the key issue treated in this article:
91. Maxime Flament, Chalmers University of Technology
Abstract
A “fourth generation” of wireless systems, likely to appear after
the successful deployment of the current third-generation
systems, is frequently
debated these days. This article presents some of the results of
the Fourth Generation Wireless project (4GW) of the Personal
Computing
and Communications program (PCC), the major Swedish
academic research effort on future communications systems,
launched in late 1997.
In the 4GW project, scenarios have been used as tools for
formulating relevant research topics related to future wireless
systems. By working
with scenarios the project group has been able to challenge
some of the assumptions commonly made in the field of
wireless research.
Since the project group is multidisciplinary, the work has also
helped the members of the project group to understand the
differences
between the research traditions to which they belong. The
scenarios, as well as the ensuing research into various wireless
related topics, point to
a vision of fourth-generation systems where “low-hierarchy”
user-deployed infrastructures are the prime candidate. Fourth-
generation
systems will offer short- to moderate-range communications
with very high data rates (>100 Mb/s). They are likely to
employ array
signal processing and ad hoc operation to provide the required
coverage. A key aspect of their design will be the fact that they
92. will be deployed in environments where large-scale wireless,
and wired, infrastructures are already in operation.
IEEE Personal Communications • December 200126
study spans. However, there is also a more fundamental rea-
son. The assumptions taken for granted in the study are in
part based on conditions external to the study. Implicitly, the
researcher therefore also assumes these external determinants
to remain stable over the course of his study. This is clearly
not the case in the 4GW project.
How then does one handle future uncertainty in research
projects aiming to provide results useful 10 or more years
from now? The approach chosen in the 4GW project has been
to work with scenarios. A scenario is a tool to explore a possi -
ble, plausible future by identifying key technical and social
developments required for it to be realized. The point of a
scenario is not to predict the future, but to create an aware-
ness of which future developments are possible. It is thereby
possible to both prepare for what the future will hold and
identify the developments needed to influence the direction
the future will take.
The research model used in the 4GW project is outlined
in Fig. 1. As the figure demonstrates, the process began with
the creation of techno-socio-economic scenarios based on lit-
erature studies and more informal sources of knowledge. The
studied literature consisted of scenario methodology, as well
a s s c e n a r i o w o r k d o n e b y o t h e r s ( e . g . , E r
i c s s o n [ 6 ] a n d
Siemens [7]). The informal experience-based knowledge was
gathered through Delphi interviews with academics and
93. industry professionals. The resulting scenarios have been
used as important input for the formulation of some basic
assumptions that are an expression of the expectations and
visions of the entire PCC program. From the basic assump-
tions, a number of working assumptions have been drawn.
They in turn represent the more operational goals of the
research program, and have been used to formulate the actu-
al research problems of the 4GW project. By working in a
multistage process, it has been possible to translate “fuzzy”
societal developments into consequences for technologically
defined research problems.
Three scenarios have been formulated: Pocket Computing,
Big Brother, and Anything Goes. They address user behavior
and lifestyle, telecommunications market evolution, develop-
ment of supporting technologies, and evolution of values and
society. The scenarios are outputs that portray the essence of
what the world might become. The three scenarios are outlined
below. More extensive narrative descriptions of the scenarios
can found in a full report [8] published by 4GW in 1998.
Anything Goes! — The diversity of telecom-
munications equipment has increased dra-
m a t i c a l l y , a s w e l l a s t h e p o s s i b i l i t i e s o f
manufacturing cheap coexisting products.
M a n u f a c t u r i n g c o m p a n i e s h a v e b e c o m e
dominant in the telecom world. They advo-
cate open de facto standards, and use soft-
w a r e s o l u t i o n s t o c r e a t e f l e x i b l e
multistandard equipment. Because of dra-
matic price reductions, both residential and
business environments have wireless LAN
solutions. They are operated by a multitude
of operators, and the end users have great
freedom of choice in selecting where to pur-
chase wireless services. Competition between
94. operators, as well as equipment providers is
fierce, and new wireless products and ser-
vices appear all the time. Services and equip-
ment are affordable for almost everyone in
the industrialized world, which tends to nar-
row the social gaps in society. Equipment
manufacturers, large and small, dominate
the telecommunications scene.
Big Brother — As more and more personal information is
available in the information infrastructure, personal integri -
ty, and privacy have become major concerns for the ordinary
user. There is a widespread call for regulation and govern-
ment intervention to ensure information integrity and secure
networks. All citizens and companies wishing to deal with
any aspect of computing and communication need some kind
of regulatory approval. In the private sphere, most public
information services use broadcasting. The complexity of
products and services has increased, and thus also the cost.
Service, transport, and equipment providers have been
reduced to a few large actors (brands) that, in the public
eye, can be trusted. Regulators dominate the telecommuni-
cations scene.
Pocket Computing — Technological development continues
at a high pace throughout the world, but due to financial
and educational differences, society is divided between those
who can follow the development and those who cannot.
P a r t s o f t h e p o p u l a t i o n h a v e a c c e s s t o a m
u l t i t u d e o f
advanced services, whereas others use simple services adapt-
ed to their needs. Service providers offer a wide range of dif-
ferent services (which may include specialized hardware)
tailored to various user groups. Mobile multimedia services
mainly focus on high-end consumer and business needs.
Global solutions are available, but much too expensive to be
95. affordable for the average user. Cultural and educational dif-
ferences between nations, and different strata in society,
have led to political instability and unrest. A few operators
and some very large manufacturers use standards to main-
tain their strategic position, and dominate the telecommuni -
cations scene.
Implications:
The Working Assumptions
From the scenarios a set of key developments in the informa-
tion and communication fields could be identified. They were
expressed in terms of the following working assumptions.
Telepresence … is an application that will be used to create
virtual meetings between individuals, and provides full stimula-
tion of all senses required to provide the illusion of actually
" Figure 1. An overview of the 4GW work process. Scenarios
were created using lit-
erature and other current knowledge sources. Key research
issues, critical for the
success or failure of the scenarios, were formulated and
researched.
Other PCC
projects
Output
Key
problems
Working
assumptions
96. Background
assumptions
Techno-
socio-economic
scenarios
Literature
Informal
knowledge
IEEE Personal Communications • December 2001 27
being somewhere else. With efficient data compression and fast
sensory feedback, the bandwidth required for tele-presence is
less than 100 Mb/s. The data stream is dominated by high-reso-
lution full-motion video. Multiparty meeting processes is one
of the major communication patterns foreseen for this appli -
cation. Meeting processes will be mainly real-time. This type
of application is likely to be the technically most demanding
encounter in personal communication systems.
Information anywhere, anytime … with virtually seamless
connection to a wide range of information services is a key
feature of the future information infrastructure. Information
access of large volumes of data, pictures, video, and so on will
be nearly instantaneous in small portable terminals. High data
rates will be required for high-volume data transfer applica-
tions such as video retrieval. The traffic pattern will be highly
asymmetric. Information provisioning will be dominated by
educational and recreational material.
97. Intermachine communication … will be an important
application/service. It will range from simple maintenance
routines (e.g., refrigerator telling repair shop it’s broken) to
sophisticated massive data exchange (e.g., camera and PC/TV
exchanging video/picture information). All cars will have a
wireless interface as a standard feature, as will household and
office equipment costing as little as US$20.
Security … will be an indispensable feature of the future
infrastructure. Data integrity and protection against unautho-
rized access will be key features for providing reliable services
for banking, electronic payment, and handling of personal
information. Schemes that reliably prevent unauthorized
tracking of users and other intrusions in the private sphere
will be in operation.
O ne-stop shopping … services will be provided in a
“turnkey” fashion directly to the consumer at the point of
sales. The store (information provider) will take full responsi -
bility for the service, as well as for any hardware or software
provided.
Nonhomogeneous infrastructure … consisting of several
switching fabrics and a multitude of physical media will be the
rule. All elements of significance will be digital. The fixed
back-
bone structure will be dominated by connectionless packet
switching (IP-style). The new air interfaces in wireless systems
will also use packet switching technology. The wireless infra-
structure will consist of a multitude of air interfaces inherited
from earlier generations of wireless systems. Packet-oriented
wireless systems will offer high data rates of up to 100 Mb/s for
hand-portable use. An overlaid architecture will provide seam-
less transparent internetworking using all kinds of air
interfaces.
98. Public and private access mixed … Public wireless access
quality and bandwidth will vary. Higher data rates will be con-
fined to dense urban areas, office environments (private/pub-
lic systems), and homes (private systems). Operators and
service providers will provide partial coverage for non-real-
time wideband (10 Mb/s) information access in most public
places (info stations). Rural area information access band-
width will be limited to 1 Mb/s, but will provide reasonable
coverage along all main highways and in communities of more
than 100 inhabitants.
Ad hoc, unlicensed operation … will dominate and many
different actors will provide parts of the infrastructure. Ad
hoc networking (spontaneous deployment, self-planning) in
unlicensed bands (the 5 and 60 GHz bands) will play an
important role, and compete fiercely with existing public oper-
ators, who will experience dwindling market shares. Tech-
niques for efficient multi-operator (private/public) sharing of
unlicensed spectrum have been developed. Ad hoc structures,
where the equipment of the users (companies or even individ-
uals) provide part of the infrastructure, will be adaptive to
possible new communication patterns. Control of the new
emerging ad hoc networks (routing, mobility, etc.) will be fully
distributed and highly reliable.
Multimode access ports in public systems … with multiple
access air interfaces will be used to accommodate a wide
range of terminals. Large operator systems will use advanced
access ports with adaptive antennas that self-configure with
noncritical installation procedures (self-configuration) to
reduce cost. Access ports (wireless gateways) in ad hoc access
systems, on the other hand, will be simple single-mode (single
air interface) devices. The cost of access port hardware in
these systems will be negligible compared to the cost of plan-
ning and physical installation.
99. Terminals … will exhibit a large range of bandwidths, from
less than 10 kb/s (simple appliances) to 100 Mb/s (telepres -
ence terminals). The battery life of personal terminals will be
at least one week. Battery capacity/weight/volume ratios will
increase by an order of magnitude from those of today. Ter -
minals in the 5 and 60 GHz range will use advanced adaptive
antennas. Terminals will either be multimode multifunction
terminals or single-purpose cheap terminals designed solely
for a specific service or function.
Focal Areas for 4GW Research
Using the process model in Fig. 1, a number of research
problems relevant to wireless infrastructures have been
derived. A key recurrent problem is to provide high data
rates everywhere in a way that is affordable to the general
public. The first part of this challenge, designing wireless sys -
tem with high data rates, has attracted considerable interest
in the research community. Our view, however, is that the
real challenge is to combine this with affordability. As was
shown in [9], the cost of providing wireless bandwidth every-
where, with the current “cellular” design paradigm, is essen-
tially proportional to the data rate; that is, the cost per
transmitted bit is almost constant, independent of the instan-
taneous data rate of the system. This is of course a devastat-
ing blow to high-bit-rate consumers, using, for example,
high-quality sound and video applications.
The 4GW project has conducted a number of feasibility
studies focusing on techniques and architectures that, if used
to their full potential, could significantly change the cost and
performance of wireless systems. The project has participants
from various information and communication technology
research fields. While the project work is conducted in a
cooperative fashion, project members also belong to their own
research tradition. Problems, methodology, tools, study
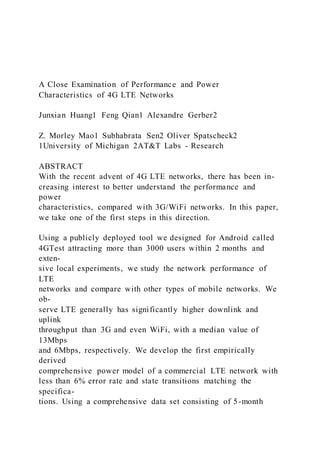
![traces
of 20 smartphone users, we carefully investigate the energy
usage
in 3G, LTE, and WiFi networks and evaluate the impact of
config-
uring LTE-related parameters. Despite several new power
saving
improvements, we find that LTE is as much as 23 times less
power
efficient compared with WiFi, and even less power efficient
than
3G, based on the user traces and the long high power tail is
found
to be a key contributor. In addition, we perform case studies of
several popular applications on Android in LTE and identify
that
the performance bottleneck for web-based applications lies less
in
the network, compared to our previous study in 3G [24].
Instead,
the device’s processing power, despite the significant
improvement
compared to our analysis two years ago, becomes more of a
bottle-
neck.
Categories and Subject Descriptors
C.2.1 [Network Architecture and Design]: wireless communi-
cation; C.4 [Performance of Systems]: measurement techniques,
modeling techniques, performance attributes; D.2.8 [Metrics]:
Per-
formance measures
Keywords
LTE, 4G, 4GTest, 3G, energy saving, power model simulation,
net-](data:image/gif;base64,R0lGODlhAQABAIAAAAAAAP///yH5BAEAAAAALAAAAAABAAEAAAIBRAA7)