Lectura+global+analysis+ +annual+2016
•
0 likes•56 views

2016 was the warmest year on record globally, surpassing the previous record set in 2015. Global temperatures were 0.94°C above average, influenced by a strong El Niño early in the year. This was the fifth time this century that a new annual temperature record was set. Record warmth was observed across land and ocean surfaces, with the only cooler area being waters near Antarctica. Most of the world's land areas experienced above-average temperatures, including all six continents.

Recommended
Recommended
More Related Content
Similar to Lectura+global+analysis+ +annual+2016
Similar to Lectura+global+analysis+ +annual+2016 (20)
Recently uploaded
Recently uploaded (20)
Lectura+global+analysis+ +annual+2016
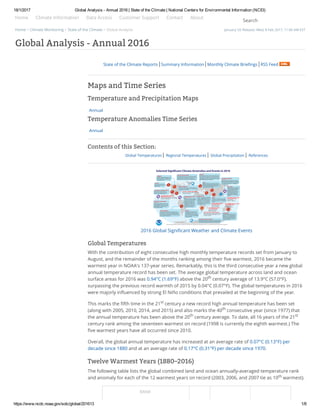
- 1. 18/1/2017 Global Analysis Annual 2016 | State of the Climate | National Centers for Environmental Information (NCEI) https://www.ncdc.noaa.gov/sotc/global/201613 1/8 January US Release: Wed, 8 Feb 2017, 11:00 AM ESTHome > Climate Monitoring > State of the Climate > Global Analysis Home Climate Information Data Access Customer Support Contact About Search State of the Climate Reports Summary Information Monthly Climate Brie黱ngs RSS Feed Maps and Time Series Temperature and Precipitation Maps Annual Temperature Anomalies Time Series Annual Contents of this Section: Global Temperatures Regional Temperatures Global Precipitation References 2016 Global Signi黱cant Weather and Climate Events Global Temperatures With the contribution of eight consecutive high monthly temperature records set from January to August, and the remainder of the months ranking among their 黱ve warmest, 2016 became the warmest year in NOAA's 137-year series. Remarkably, this is the third consecutive year a new global annual temperature record has been set. The average global temperature across land and ocean surface areas for 2016 was 0.94°C (1.69°F) above the 20 century average of 13.9°C (57.0°F), surpassing the previous record warmth of 2015 by 0.04°C (0.07°F). The global temperatures in 2016 were majorly in푠uenced by strong El Niño conditions that prevailed at the beginning of the year. This marks the 黱fth time in the 21 century a new record high annual temperature has been set (along with 2005, 2010, 2014, and 2015) and also marks the 40 consecutive year (since 1977) that the annual temperature has been above the 20 century average. To date, all 16 years of the 21 century rank among the seventeen warmest on record (1998 is currently the eighth warmest.) The 黱ve warmest years have all occurred since 2010. Overall, the global annual temperature has increased at an average rate of 0.07°C (0.13°F) per decade since 1880 and at an average rate of 0.17°C (0.31°F) per decade since 1970. Twelve Warmest Years (1880–2016) The following table lists the global combined land and ocean annually-averaged temperature rank and anomaly for each of the 12 warmest years on record (2003, 2006, and 2007 tie as 10 warmest). RANK Global Analysis - Annual 2016 th st th th st th
- 2. 18/1/2017 Global Analysis Annual 2016 | State of the Climate | National Centers for Environmental Information (NCEI) https://www.ncdc.noaa.gov/sotc/global/201613 2/8 1 = WARMEST PERIOD OF RECORD: 1880–2016 YEAR ANOMALY °C ANOMALY °F 1 2016 0.94 1.69 2 2015 0.90 1.62 3 2014 0.74 1.33 4 2010 0.70 1.26 5 2013 0.67 1.21 6 2005 0.66 1.19 7 2009 0.64 1.15 8 1998 0.63 1.13 9 2012 0.62 1.12 10 (tie) 2003 0.61 1.10 10 (tie) 2006 0.61 1.10 10 (tie) 2007 0.61 1.10 Much of the record warmth for the globe can be attributed to record warmth in the global oceans. The annually-averaged temperature for ocean surfaces around the world was 0.75°C (1.35°F) higher than the 20 century average, edging out the previous record of 2015 by 0.01°C (0.02°F). A near- record strong El Niño in the Paci黱c Ocean at the beginning of the year led to some of the highest monthly global ocean temperatures on record, with January, February, March, April, June, July and August all ranking among the 12 warmest of all months in the 137-year record. January, February, and March each observed a monthly temperature at least 0.8°C (1.4°F) above average. This was a continuation of a high temperature threshold 黱rst crossed in September 2015.The El Niño dissipated in spring and was replaced by weak La Niña conditions near the end of the year. Even so, global ocean temperatures remained high, with the December temperature elevated at 0.61°C (1.10°F) above the 20 century average, an anomaly not achieved in the record until June 2009. In addition to the strong El Niño, a strong negative phase of the Indian Ocean Dipole (IOD) developed in the Southern Hemisphere winter and spring, in푠uencing temperatures in that region. The indices were among their lowest levels on record in July and September, as reported by the World Meteorological Organization (WMO). Overall, annual record warm and much warmer-than-average temperatures were observed in parts of every major ocean basin. Record warmth for the year was particularly notable across the northern Paci黱c waters near Alaska, the Bering Sea, parts of the southern and western Paci黱c, parts of the central western Atlantic, regions of the Gulf of Mexico and the Caribbean, parts of the southern and eastern Indian Ocean extending eastward across the waters of the southeastern Asia island nations and Oceania. The only ocean area with record cold temperatures was east of the Drake Passage near the Antarctic Peninsula, an area that has been much cooler than average since late 2013. Separately, temperatures were record high across land surfaces as well. The global annual land surface temperature for 2016 was 1.43°C (2.57°F) above the 20 century average, surpassing the previous record of 2015 by 0.11°C (0.19°F). Some extremely high monthly land surface temperatures contributed to this warmth. March 2016 saw the highest globally-averaged land surface temperature among all months in the historical record, at 2.35°C (4.23°F) above the 20 century average. February had the second highest all-time monthly temperature, at +2.24°C (+4.03°F) and April had the 黱fth highest, at +1.85°C (+3.33°F). th th th th
- 3. 18/1/2017 Global Analysis Annual 2016 | State of the Climate | National Centers for Environmental Information (NCEI) https://www.ncdc.noaa.gov/sotc/global/201613 3/8 Because land surfaces generally have low heat capacity relative to oceans, temperature anomalies can vary greatly between months. In 2016, the average monthly land temperature anomaly ranged from +2.35°C (+4.23°F) in March, as noted above, to +0.95°C (+1.71°F) in November, a di䳌�erence of 1.40°C (2.52°F). The ocean has a much higher heat capacity than land and thus anomalies tend to vary less over monthly timescales. During the year, the global monthly ocean temperature anomaly fell from +0.85°C (+1.53°F) in January to +0.61°C (+1.10°F) in December, a di䳌�erence of 0.24°C (0.43°F). JANUARY–DECEMBER ANOMALY RANK (OUT OF 137 YEARS) RECORDS °C °F YEAR(S) °C °F Global Land +1.43 ± 0.15 +2.57 ± 0.27 Warmest 1ˢᵗ 2016 +1.43 +2.57 Coolest 137ᵗʰ 1907 -0.59 -1.06 Ocean +0.75 ± 0.16 +1.35 ± 0.29 Warmest 1ˢᵗ 2016 +0.75 +1.35 Coolest 137ᵗʰ 1909 -0.45 -0.81 Land and Ocean +0.94 ± 0.15 +1.69 ± 0.27 Warmest 1ˢᵗ 2016 +0.94 +1.69 Coolest 137ᵗʰ 1908 -0.44 -0.79 Northern Hemisphere Land +1.57 ± 0.17 +2.83 ± 0.31 Warmest 1ˢᵗ 2016 +1.57 +2.83 Coolest 137ᵗʰ 1884 -0.68 -1.22 Ocean +0.86 ± 0.16 +1.55 ± 0.29 Warmest 2ⁿᵈ 2015 +0.88 +1.58 Coolest 136ᵗʰ 1908, 1909 -0.47 -0.85 Land and Ocean +1.13 ± 0.15 +2.03 ± 0.27 Warmest 1ˢᵗ 2016 +1.13 +2.03 Coolest 137ᵗʰ 1908 -0.46 -0.83 Southern Hemisphere Land +1.07 ± 0.12 +1.93 ± 0.22 Warmest 2ⁿᵈ 2015 +1.09 +1.96 Coolest 136ᵗʰ 1917 -0.64 -1.15 Ocean +0.69 ± 0.16 +1.24 ± 0.29 Warmest 1ˢᵗ 2016 +0.69 +1.24 Coolest 137ᵗʰ 1911 -0.43 -0.77 Land and Ocean +0.75 ± 0.15 +1.35 ± 0.27 Warmest 1ˢᵗ 2016 +0.75 +1.35 Coolest 137ᵗʰ 1911 -0.45 -0.81 The 1901-2000 average combined land and ocean annual temperature is 13.9°C (56.9°F), the annually averaged land temperature for the same period is 8.5°C (47.3°F), and the long-term annually averaged sea surface temperature is 16.1°C (60.9°F). Supplemental Information Year-to-date temperature evolution Regional Temperatures The following information was compiled from previous NCEI monitoring reports and public reports by National Hydrometeorological Services (NHMSs; peers of the U.S. National Weather Service), including those submitted to inform the
- 4. 18/1/2017 Global Analysis Annual 2016 | State of the Climate | National Centers for Environmental Information (NCEI) https://www.ncdc.noaa.gov/sotc/global/201613 4/8 January–December 2016 Blended Land and Sea Surface Temperature Anomalies in degrees Celsius January–December 2016 Blended Land and Sea Surface Temperature Percentiles Provisional Status of the Climate in 2016 by the World Meteorological Organization. More comprehensive information will be available in the WMO's 黱nal Statement, to be released in Spring 2016. The vast majority of the world's land surfaces experienced above-average annual temperatures, as indicated by the Temperature Percentiles map below. Record warmth for the year-to-date was present across Far East Russia, Alaska, far western Canada, a swath of the eastern United States, much of Central America and northern South America, southern Chile, much of eastern and western Africa, north central Siberia, parts of south Asia, much of southeast Asia island nations and Papua New Guinea, and parts of Australia, especially along the northern and eastern coasts. According to NCEI's Global Regional Analysis, all six continents had at least a top 黱ve annually-averaged temperature, with North America experiencing its highest annual temperature since continental records began in 1910, at 1.86°C (3.35°F) higher than the 1910–2000 average. No land areas were cooler than average for the year. Europe experienced its third warmest year, behind only 2014 (record warm) and 2015 (second warmest), making the past three years the three warmest in the 107-year continental record. Several individual country statistics are detailed below: For Spain, the annually averaged temperature for 2016 was 0.7°C (1.3°F) higher than its 1981– 2010 average. This marks the country's sixth warmest year since its national records began in 1965 and 黱fth warmest for the 21 century. A record high temperature for January and the third highest on record for summer contributed to the overall warmth. The annually-averaged temperature across the United Kingdom for 2016 was 0.5°C (0.9°F) above its 1981–2010 national average, falling just below the 10 warmest years on record, but was 0.1°C (0.2°F) warmer than 2015. Preliminary reports indicate that the annually-averaged temperature in 2016 for France was 0.6°C (1.1°F) higher than the 1981–2010 average, ranking around the 10 warmest in a series dating to 1900. The annually-averaged temperature for Germany was 1.4°C (2.5°F) above its 1961–1990 national average and 0.7°C (1.3°F) above its 1981–2010 average. This year was cooler than the previous warm years of 2014 and 2015, falling short of a top 10 rank in the record dating to 1881. The second warmest winter on record helped make 2016 the fourth warmest year for Austria in the country's 248-year period of record, at 1.0°C (1.8°F) higher than its 1981–2010 average temperature. Currently, the warmest years on record for Austria are 2014, 2015, and 1994. Denmark reported an annually-averaged temperature that was 1.3°C (2.3°F) higher than its 1961–1990 national average and 0.1°C (0.2°F) higher than the average of the past decade (2006– 2015), tying with 1949, 1992, and 2011 as the country's 11 warmest year since records began in 1874. Twenty-six of the past 29 years have been warmer than average, according to Denmark's national meteorological agency, DMI. 2014 currently holds the high annual temperature record st th th
- 5. 18/1/2017 Global Analysis Annual 2016 | State of the Climate | National Centers for Environmental Information (NCEI) https://www.ncdc.noaa.gov/sotc/global/201613 5/8 2016 was a warm year for Finland as well, particularly in central and northern Lapland, where the average annual temperature was close to 2°C (4°F) higher than the 1981–2010 average. Sodankyläa observed its 黱fth warmest year in the station's 108 year history. Across the Atlantic, Iceland was warmer than average during 2016, signi黱cantly so in some areas. The capital city of Reykjavik reported its second highest annually-averaged temperature, behind only 2003. The year got o䳌� to a cool start in January and February, but by March was warmer than average and was especially warm toward the end of the year. October was record warm. Overall, Asia observed its third warmest year on record, behind 2015 (record warmest) and 2007 (second warmest). April, August, and September were each record warm, while October and November were both cooler than their long-term averages. The year started o䳌� cold in some areas. As reported by the WMO, in late January extreme low temperatures extended from eastern China to as far south as Thailand. In southern China, Guangzhou recorded its 黱rst snow since 1967 and Nanning its 黱rst since 1983. There was also substantial heat during the year. Thailand set a new national high temperature record of 44.6°C (112.3°F) at Mae Hong Son on April 28 , while many other individual locations set their own all-time records. On May 19 , Phalodi, India, reached 51.0°C (123.8°F), setting a national record. Record or near-record temperatures were observed several times in parts of the Middle East between late July and early September. Mitribah, Kuwait, observed a temperature of 54.0°C (129.2°F) on July 21 , the highest temperature on record for Asia (still subject to veri黱cation as of this publication). On July 22 , Basra, Iraq, reached 53.9°C (129.0°F) and Delhoran, Iran, reached 53.0°C (127.4°F), a new national record. The African continent observed its second warmest year, behind only 2015. Every month ranked among its seven warmest, with April and August record warm. Heat was abundant to start the year. On January 7 in South Africa, temperatures reached all-time highs of 42.7°C (108.9°F) and 38.9°C (102.0°F) at Pretoria and Johannesburg, respectively. Each of these temperatures broke their previous records by at least 3°C (5°F). In South America, the continent as a whole was second warmest on record for 2016, behind only 2015. January, February, and April were each record warm. Seasonal temperatures across Brazil were above average across nearly the entire country, with the exception of some cooler-than- average temperatures in the extreme south most of the year. Argentina reported an annually averaged temperature that was 0.6°C (1.1°F) higher the its 1961–1990 average. While above average, the temperature departure did not fall among its 10 highest in the 56-year record. As such, 2016 broke the streak of consecutive record or near-record setting years. Currently, the four years of 2012–2015 remain the warmest four on record. 2009 is the 黱fth warmest. Oceania had its 黱fth warmest year on record, behind 2013 (warmest), 2005 (second warmest), 2014 (third), and 2009 (fourth). With mostly above-average temperatures across the country and nowhere below average, NIWA reported that 2016 was the warmest year in New Zealand's 108-year national record. A record warm May, second warmest February, and third warmest June contributed to this new annual record. Only August and December were cooler than average. 2016 was Australia's fourth warmest in the 107-year record, with a mean temperature 0.87°C (1.57°F) higher than its 1961–1990 average. Nine of the past 10 years (excepting 2010) have been warmer than average and seven of the ten warmest years have occurred since 2005. The average maximum temperature in 2016 was 0.70°C (1.30°F) above average and the average minimum temperature was 1.03°C (1.85°F) above average, which was the second warmest on record, behind only 1998. Regionally, the annual mean temperature ranked among its four highest for Queensland, New South Wales, Victoria, the Northern Territory, and Tasmania, the latter of which was record high. The North American continent was record warm for 2016, surpassing the previous high temperature record of 1998 by 0.33°C (0.59°F) . This warmth came despite a signi黱cant January cold wave in the th th st nd th
- 6. 18/1/2017 Global Analysis Annual 2016 | State of the Climate | National Centers for Environmental Information (NCEI) https://www.ncdc.noaa.gov/sotc/global/201613 6/8 January – December 2016 Land-Only Precipitation Percent of Normal January–December 2016 Land-Only Precipitation Percentiles eastern United States that brought copious snowfall to several regions. The annually-averaged temperature for the contiguous United States was the second highest among all 122 years on record, behind only 2012, and was the 20 consecutive higher-than-average annual temperature. In the higher latitudes, Alaska had its warmest year since its state record began in 1925, surpassing the previous record set in 2015. Many regions across western Canada had their warmest summer on record. [ top ] Global Precipitation As indicated by the Global Percent of Normal Precipitation and Precipitation Percentiles maps below and as is typical, many stations were wet for the year, while many stations were dry. Also, as discussed below, extreme precipitation and drought events occurred across the world. According to the WMO, major drought a䳌�ected much of southern Africa. The region experienced two consecutive poor rainy seasons, with rainfall well below average since 2014. The most a䳌�ected countries included Malawi, Angola, Zambia, Zimbabwe, Mozambique, Madagascar, and Lesotho. Following its wettest December on record (2015), the United Kingdom received 152 percent of its average rainfall during January, marking the fourth wettest January there since national records began in 1910. Eastern Scotland observed its second wettest month (January) among all months in its record. The year also began as a wet one in Ireland. Dublin airport reported its wettest January since 1948, with 118.4 mm (4.7 inches) of rainfall, almost twice its monthly average. Sweden observed heavy precipitation during February. Northern Norrland, which had the highest monthly departures from average among all regions of the country, received three times its average precipitation amounts for the month. Below-average precipitation was observed across much of Australia during April 2016. The nationally-averaged precipitation total was just 33 percent of normal—the lowest April precipitation total since 1997 and the eighth lowest since national precipitation records began in 1900. All regions also observed below-average conditions during the month. Beginning in May, however, heavy rainfall a䳌�ected most of eastern Australia, helping to ease the drought which had been present since 2012 in inland Queensland and parts of Victoria and South Australia. Averaged as a whole, the country had its wettest May since 1983 and the seventh wettest May since national precipitation records began in 1900, followed by its second wettest June. September rainfall averaged across the country was also second highest. According to Denmark's Meteorological Service (DMI), the nationally-averaged precipitation for April 2016 was 67.5 mm (2.66 inches)—Denmark's wettest April since 1998. National precipitation records began in 1874. Several rainfall events in April brought abundant accumulations to northeastern Argentina according to Servicio Nacional de Meteorología de Argentina, with several stations setting new monthly th
- 7. 18/1/2017 Global Analysis Annual 2016 | State of the Climate | National Centers for Environmental Information (NCEI) https://www.ncdc.noaa.gov/sotc/global/201613 7/8 precipitation records as they received two or three times their monthly average precipitation. The Malargüe station received a total of 145.3 mm (5.7 inches), more than six times its April average of 22.9 mm (0.9 inch). The heavy rains triggered 푠oods, a䳌�ecting hundreds of people and forcing them to evacute their homes, as reported by CIIFEN. Wetter-than-average conditions also a䳌�ected much of Fiji during April 2016. According to Fiji's Meterological Service, 13 of its 24 stations received more than twice their monthly average. Two stations (Nadi Airport and Ono-i-lau) had more than three times their average totals. Much of the precipitation was attributed to several tropical systems that impacted the country during the month. The Yangtze basin in China experienced its most signi黱cant 푠ood season since 1999. Rainfall was consistently high across the middle and lower Yangtze region from April to July, with rainfall over the region for that period about 140 percent of average. Several locations across The Netherlands received more than 200 mm (7.8 inches) of precipitation during June. Limburg Ysselsteyn received a total of 277 mm (10.9 inches), setting a new record for the month. As reported by the WMO, signi黱cant 푠ooding occurred in various parts of India during the monsoon season. Particularly notable was the Ganges basin, where the Ganges River reached record heights at some locations. Also reported by the WMO, rainfall was generally below average during the "long rains" season in Kenya and Tanzania, which runs from March to May. FEWS reported that "short rains" that began in October were "signi黱cantly below average" through December, leading to poor crop and livestock conditions in southeastern and coastal marginal agricultural areas. Precipitation totals across the Island of Fiji were above- to much-above-average during August. According to Fiji's Meteorological Service , 18 of 26 stations recorded twice their normal monthly totals, with four stations receiving as much as four times their monthly normal. The precipitation helped provide much needed relief from the dry conditions that plagued the region in the past months. According to the WMO , above-average seasonal rainfall in the Sahel led to signi黱cant 푠ooding in the Niger River basin. In the upper Niger, the river reached its highest level since 1964 at Mopti, Mali, on September 6 . Flooding also occurred farther downstream, particularly in Niger and northern Nigeria, and was also reported in other parts of West Africa outside the Niger basin, including Gambia, Senegal, and Ghana. Finland observed its driest October in the country's 55-year period of record. The driest regions were in the west and north, with total precipitation generally between 5 and 20 mm. Norway reported its fourth driest October since its national record began in 1900. Some stations, primarily in Oppland and Hedmark, received less than 10 percent of their normal rainfall. Due in part to its sixth driest October on record, total rainfall during autumn in the United Kingdom was 74 percent of its 1981–2010 average. This is the lowest amount since 2008 and ranked in the bottom 25 percent among all such periods in the series dating back to 1910. Several low pressure systems impacted New Zealand during November, bringing copious rainfall to some areas. Wellington observed its wettest November in its 89-year record, with surrounding areas also reporting near-record high monthly precipitation totals. France was record dry during December, with average precipitation totals just 20 percent of the 1991–2010 average, breaking the previous record low of December 2015. National precipitation records date to 1959. Even with its driest December on record to end the year, 2016 was relatively wet in Austria. On balance, precipitation totals across the country for the year were 110 percent of the 1981–2010 average, making this one of the 25 wettest years since national records began in 1858. th
- 8. 18/1/2017 Global Analysis Annual 2016 | State of the Climate | National Centers for Environmental Information (NCEI) https://www.ncdc.noaa.gov/sotc/global/201613 8/8 [ top ] References Peterson, T.C. and R.S. Vose, 1997: An Overview of the Global Historical Climatology Network Database . Bull. Amer. Meteorol. Soc., 78, 2837-2849. Quayle, R.G., T.C. Peterson, A.N. Basist, and C. S. Godfrey, 1999: An operational near-real-time global temperature index . Geophys. Res. Lett., 26, 333-335. Smith, T.M., and R.W. Reynolds (2005), A global merged land air and sea surface temperature reconstruction based on historical observations (1880-1997) , J. Clim., 18, 2021-2036. Smith, et al (2008), Improvements to NOAA's Historical Merged Land-Ocean Surface Temperature Analysis (1880-2006) , J. Climate., 21, 2283-2293. [ top ] Citing This Report NOAA National Centers for Environmental Information, State of the Climate: Global Analysis for Annual 2016, published online January 2017, retrieved on January 18, 2017 from http://www.ncdc.noaa.gov/sotc/global/201613. NCEI About Site Map Privacy FOIA Information Quality Disclaimer Department of Commerce NOAA NESDIS Department of Commerce > NOAA > NESDIS > NCEI > NCDC