Call Girls in Noida Sector 12 Noida 💯Call Us 🔝 9582086666 🔝 South Delhi Escor...
Central London Office Report 2Q 2011
1. SUMMER 2011 | CENTRAL LONDON OFFICES Q2
RESEARCH & FORECASTING UK
CENTRAL LONDON OFFICES Q2
CENTRAL LONDON
Central London Highlights
ABSORPTION
• Net stock absorption of offi
ce space across Central London reached 1.8 million sq ft in H1 2011,
AVAILABILITY resulting in a rise in occupancy across all core locations. The West End saw six month
occupancy rise at its fastest rate since pre-credit crunch in H2 2005. Grade A absorption
TAKE-UP
remains strong (see Figure 1) but H1 2011 shows levels slowing, primarily due to below
RENTS average take-up in the City.
• Central London availability fell to a 30 month low, driven by a fall in Central London Grade A
CITY availability of 17% in the past 12 months. In the West End market, Grade A availability has fallen
even more sharply, down by 44% in the past six months.
ABSORPTION
• Take-up of top quality product has begun to peak due to the lack of new space being delivered
AVAILABILITY onto the market. The Central London offi
ce market saw quarterly take-up rise by just 7%, as
overall availability fell by 10%.
TAKE-UP
• The lack of Grade A availability is starting to have a significant impact upon headline rents,
RENTS specifically across the West End market. Some submarkets have already seen double digit
growth in 2011 to date.
WEST END • While competition for Grade A continues to drive up headline figures, the second-hand market
is also beginning to see significant falls in vacancy as cost conscious occupiers look for
ABSORPTION
alternative options in the core locations. Second-hand availability is down by 19% since the
AVAILABILITY start of 2011.
TAKE-UP
RENTS
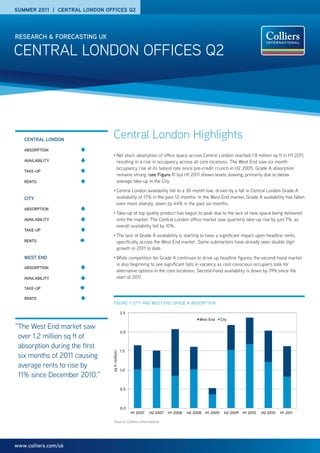
FIGURE 1: CITY AND WEST END GRADE A ABSORPTION
2.5
West End City
“ he West End market saw
T
2.0
over 1.2 million sq ft of
absorption during the first
1.5
sq ft (million)
six months of 2011 causing
average rents to rise by
1.0
11% since December 2010.”
0.5
0.0
H1 2007 H2 2007 H1 2008 H2 2008 H1 2009 H2 2009 H1 2010 H2 2010 H1 2011
Source: Colliers International
www.colliers.com/uk
2. CENTRAL LONDON OFFICES Q2 | SUMMER 2011
City
• As predicted in previous reports, absorption of
offi
ce space in the City of London is beginning FIGURE 2: CITY NET STOCK ABSORPTION
to slow (see Figure 2). Take-up of built offi ce 2.0
space, which plays a key role in absorption, has
been below average in the City in 2011 to date.
1.5
Over the past decade average annual take-up in
the City market has been 5.7 million sq ft. In the
first half of 2011, transaction levels have
1.0
reached just 2.5 million sq ft, over 9% below
sq ft (million)
the long term average.
0.5
• Nevertheless, City Q2 take-up rose to
1.4 million sq ft, up from 1.1 million sq ft in
0.0
Q1 2011 (see Figure 3). As predicted, the first
of the next wave of large pre-lets have recently
been signed. Aon has signed for a pre-let of -0.5
191,000 sq ft at British Land’s Leadenhall
Building (Cheesegrater), which is largely
-1.0
responsible for the quarter on quarter rise in H1 2007 H2 2007 H1 2008 H2 2008 H1 2009 H2 2009 H1 2010 H2 2010 H1 2011
transaction levels. Elsewhere, further deals at
Heron Tower are likely to be announced shortly Source: Colliers International
with units under offer at market leading rents
in the early to mid £60s psf. Potential occupiers
FIGURE 3: CITY TAKE-UP BY GRADE
include Snoras, City Credit Capital and Metlife
2.5
Investment, amongst others.
Grade A Grade B Grade C Pre-let
• CMS Cameron McKenna has also confirmed its
intention to take 200,000 sq ft at Hammerson’s 2.0
Principal Place scheme. The latter will be
suffi
cient to kick start construction at the
590,000 sq ft project. Currently, there are 1.5
sq ft (million)
13 active and potential requirements of
100,000 sq ft focussed on the City market. A
number of tenants are also reoccupying space 1.0
that had formerly been marketed for subletting.
Accenture will take back 82,000 sq ft at 20 Old
Bailey and Denton Wilde Sapte is reoccupying 0.5
18,900 sq ft at 1 Fleet Place. We see quarterly
City take-up improving but remaining close to
the ten year quarterly average of 1.4 million sq ft 0.0
for the next two quarters and thus down on the Q3 2009 Q4 2009 Q1 2010 Q2 2010 Q3 2010 Q4 2010 Q1 2011 Q2 2011
2010 total.
Source: Colliers International/Focus
• Despite below average take-up, availability in
the City continues to fall at a significant pace
(see Figure 4). The overall vacancy rate is FIGURE 4: CITY AVAILABILITY BY GRADE
now below 9.5% for the first time in nearly
12.0
three years. With just one major City scheme, Grade A Grade B Grade C
Hines’ Cannon Place (393,000 sq ft), due to (Units over 5,000 sq ft)
10.0
complete in the next 12 months, Grade A
vacancy is set to see further sharp falls.
8.0
• Prime rents remain at £57.50 psf with
sq ft (million)
headline rents being dictated by deals for
6.0
tower space. Prospective deals are likely to
raise that above £60 psf but this level is
confined to a very limited number of specific
4.0
units. Rents for good quality second-hand
space appear to be rising with figures
2.0
in the mid £50s psf being rumoured at
Grade A quality schemes in the heart of
the Square Mile. 0.0
Q1 2010 Q2 2010 Q3 2010 Q4 2010 Q1 2011 Q2 2011
Source: Colliers International
P. 2 | COLLIERS INTERNATIONAL
3. CENTRAL LONDON OFFICES Q2 | SUMMER 2011
West End
• Absorption levels in the West End remain
buoyant, driven up further by a combination FIGURE 5: WEST END NET STOCK ABSORPTION
of a shortage of new supply and also healthy 1.5
competition for Grade A and B+ product (see
Figure 5). 1.2 million sq ft of offi
ce space was 1.0
absorbed in the first half of 2011, the highest
six monthly total since H2 2005. All West End
0.5
submarkets, bar one, saw occupation levels
sq ft (million)
increase half year on half year, with Mayfair
and Belgravia both experiencing positive 0.0
absorption in excess of 100,000 sq ft.
The West End market saw over 1.2 million sq ft
-0.5
of absorption during the first six months of
2011 causing average rents to rise by 11%
since December 2010. -1.0
• Given that half yearly take-up in the West End
reached 2.5 million sq ft (see Figure 6), just -1.5
13% up on the previous 12 months, the 34% H1 2007 H2 2007 H1 2008 H2 2008 H1 2009 H2 2009 H1 2010 H2 2010 H1 2011
increase in absorption over the same period is
highly significant. With little new supply coming
Source: Colliers International
to market, occupiers initiating relocation and
expansion plans will need to broaden their
FIGURE 6: WEST END SUBMARKET AVAILABILITY BY GRADE
horizons in terms of quality of accommodation
and geography. Vacancy rates across nearly all
0.8
West End submarkets have fallen and Grade A Grade A Grade B Grade C
availability is below 60,000 sq ft in five of the
0.7
nine key locations (see Figure 7).
0.6
• West End offi
ce completions have achieved an
annual average of 1.2 million sq ft over the past 0.5
sq ft (million)
decade. In 2011, completions will fall to
0.4
0.5 million sq ft and only rise to 0.8 million sq ft
in 2012. 2012 will see the completion of Land 0.3
Securities’ Park House (190,000 sq ft) and the
first phase of Stanhope/The Crown Estate’s
0.2
Quadrant scheme (163,000 sq ft), where 0.1
Generation Investment Management is
rumoured to have the top fl oor under offer at
0.0
Belgravia Covent Marylebone Mayfair Noho Paddington Soho St James's Victoria
£92 psf. However, over 75% of the 2012 Garden
completion total is contained in just three
Source: Colliers International
schemes, with no speculative completions of
space between 60,000-100,000 sq ft
scheduled. Just 185,000 sq ft is set to FIGURE 7: WEST END TAKE-UP BY GRADE
complete in the Marylebone and Noho markets
with circa 44% of that space having already 1.4
been pre-let of 160 Great Portland Street to Grade A Grade B Grade C
Double Negative 1.2
• In 2011 to date, headline rents have risen
across the majority of submarkets. Where 1.0
rental growth is fl at, lack of product is the main
cause. In other locations, headline rents have
sq ft (million)
0.8
seen sharp uplifts due to demand and
competition for the remaining Grade A product. 0.6
In the year to date, Covent Garden and Soho
(+22%), St James’s (+19%), Mayfair (+12%)
0.4
and Belgravia (+10%) have all seen double
digit growth in prime rents. Additional top
quality units currently under offer in
0.2
Marylebone, Mayfair and Soho should
encourage further rental growth in those 0.0
Q1 2010 Q2 2010 Q3 2010 Q4 2010 Q1 2011 Q2 2011
locations over the next two quarters.
Source: Colliers International
COLLIERS INTERNATIONAL | P. 3
4. CENTRAL LONDON OFFICES Q2 | SUMMER 2011
Summary
512 offices in
• Competition for Grade A space will remain the key driver of rental uplift during the remainder
of 2011. Despite that, overall 2011 take-up is likely to be below average in both the City and 61 countries on
West End markets, due to shortage of supply.
6 continents
• Absorption appears to have peaked in the City and is close to peaking in the West End.
Nevertheless, we expect to see increased absorption of good quality second-hand stock as United States: 135
Grade A product becomes scarcer. Canada: 39
Latin America: 17
• We expect to see increased pre-letting activity, not just in the City but in the West End also, as Asia Pacific: 26
built product fails to offer new entrants and expanding occupiers the requisite specification in ANZ: 168
the core locations. EMEA: 95
• Double digit rental growth is likely to spread to all West End submarkets, while the City market LONDON – CITY
remains dominated by headline deals at trophy schemes. Level 20, Tower 42
25 Old Broad Street
• Incentives are set to come in further during the remainder of 2011, but to date there have been
London EC2N 1HQ
modest reductions in the West End but no discernible hardening in the City. +44 20 7935 4499
FIGURE 8: CENTRAL LONDON MARKET SUMMARY LONDON – WEST END
9 Marylebone Lane
London W1U 1HL
Net Stock
Take-up Availability Prime Rents Prime Yields +44 20 7935 4499
Absorption
(000s sq ft) (000s sq ft) £psf %
(000s sq ft)
Q1 2011 Q2 2011 Q1 2011 Q2 2011 Q1 2011 Q1 2011 Q1 2011 RESEARCH & FORECASTING
Guy Grantham
WEST END
guy.grantham@colliers.com
New / Refurb 505 599 2,302 1,904
CITY AGENCY
Second-hand 745 651 3,568 2,764
Julie Rees
Total 1,250 1,250 5,870 4,668 1,123 £95.00 4.00 julie.rees@colliers.com
Belgravia / Knightsbridge 37 70 292 226 115 £55.00 4.75 Mark McAlister
Covent Garden / Strand 338 376 924 511 449 £55.00 5.25 mark.mcalister@colliers.com
Euston 68 47 482 420 18 £45.00 6.25 WEST END AGENCY
Marylebone 107 94 454 438 23 £60.00 4.00 Mike MacKeith
Mayfair 172 198 876 702 185 £95.00 5.25 mike.mackeith@colliers.com
Noho 102 222 731 558 47 £47.50 5.25 Robert Few
robert.few@colliers.com
Paddington 79 35 353 344 96 £49.50 5.75
Soho 37 56 287 193 78 £55.00 5.25 INVESTMENT
Andrew Whitaker
St James’s 45 71 453 338 99 £80.00 4.25
andrew.whitaker@colliers.com
Victoria 132 29 669 645 35 £52.50 5.50
Dominic Amey
CITY dominic.amey@colliers.com
New / Refurb
580 781 4,846 4,491
Disclaimer: This report gives information based primarily
Second-hand 497 584 4,827 4,441 on published data which may be helpful in anticipating
Total 1,077 1,365 9,673 8,932 679 £57.50 5.25 trends in the property sector. However, no warranty is
given as to the accuracy of, and no liability for negligence
City Core 695 862 5,882 5,499 440 £57.50 5.25 is accepted in relation to the forecasts, figures or
conclusions contained in it and they must not be relied on
City Midtown 31 30 478 341 163 £52.50 5.25 for investment purposes. This report does not constitute
and must not be treated as investment advice or an offer
Eastern City 35 108 951 1,027 -94 £22.50 6.00 to buy or sell property. July 2011 11138
Northern City 315 365 2,362 2,065 170 £27.50 6.00 Colliers International is the licensed trading name of
Colliers International UK plc. Company registered in
DOCKLANDS England & Wales no. 4195561.
New / Refurb - 2 145 155 Registered office: 9 Marylebone Lane, London W1U 1HL.
Second-hand 14 22 498 514
Total 14 24 643 669 66 £25.00 6.25
CANARY WHARF
New / Refurb 28 - 709 709
Second-hand - 30 343 366
Total 28 30 1,052 1,075 110 £35.00 5.50
SOUTHBANK
New / Refurb 49 41 254 222
Second-hand 155 67 693 661
Total 204 108 947 883 -20 £40.00 5.50 Accelerating success.
Source: Colliers International/Focus
www.colliers.com/uk