SlideShare a Scribd company logo
1 of 25
Download to read offline
United States
                                  Department of
                                  Agriculture

                                  Foreign
                                  Agricultural
                                  Service
                                                    Coffee:
                                  Circular Series
                                  December 2012     World Markets and Trade

                            Record World Production Forecast for Third Consecutive Year
                           160


                           120
Million 60 Kilogram Bags


                            80


                            40


                             0
                                       2008/09            2009/10             2010/11             2011/12             2012/13 F
                                                             Brazil       Vietnam         Other

 World coffee production for 2012/13 is forecast at a record 151 million bags, up almost 7 million from the
 previous year, marking the third consecutive year of rising output. Brazil is forecast to account for nearly
 all the gain as its Arabica crop enters the on-year of the biennial production cycle, while Indonesia’s
 higher production is offset by Vietnam’s lower output. Colombia is forecast down slightly from last year
 to its lowest level in four decades. Global bean exports are forecast at a record. Although ending stocks
 are forecast higher, supplies remain tight.


                           _______________________________________________________________________________________________________
                                                      Approved by the World Agricultural Outlook Board/USDA
2012/13 Forecast Overview
          Brazil’s production is forecast at a                                         Brazil’s Arabica Production Below Previous On-Cycle
          record 55.9 million bags, up 6.7 million                                60
          from the previous year due primarily to
          the Arabica trees entering the on-year of
          the biennial production cycle. Whereas


                                                       Million 60 Kilogram Bags
          previous cycles grew steadily, this year                                40
          it is forecast slightly below the last on-
          year due to frost damage and dry
          conditions in Minas Gerais, its main
          growing region. The Robusta harvest is                                  20
          forecast to continue expanding as
          favorable weather and good crop
          management aided fruit settings and
          development in Espirito Santo, where                                     0
          the vast majority is grown. Nearly half                                         06/07     07/08      08/09          09/10       10/11      11/12      12/13 F
          of the additional supply is expected to                                                                   Arabica     Robusta
          augment exports, with the rest going to
          modest gains in consumption and stocks.

          Vietnam’s production is forecast at 25.0                                     Vietnam’s Production Forecast to Retreat from Record
                                                                                  30
          million bags, down 1.0 million from last
          year’s record harvest (significant area
          expansion and record yield caused last
          year’s unexpected 30 percent production
                                                                                  20
                                                       Million 60 Kilogram Bags


          spike). Pre-season rain throughout the
          growing region caused an early bloom
          which lowered yield. Bean exports are
          forecast 2.0 million bags lower to 22.0
          million, while ending stocks are                                        10
          expected to almost double to 1.8 million
          bags. Consumption is forecast to
          continue rising as the coffee culture
          spreads.
                                                                                  -
                                                                                            08/09           09/10             10/11          11/12           12/13 F
          Indonesia’s production is forecast to
          rebound 1.4 million bags to 9.7 million
          on favorable growing conditions, whereas the previous two harvests suffered from excessive rainfall. The
          forecast falls short of the record 2009/10 harvest because coffee area has since declined over 5 percent as
          higher prices for cocoa, rubber, and palm oil encouraged substitution. Bean exports are forecast to
          recover 1.2 million bags to 6.1 million as production gains are mostly exported.

          India’s production is forecast to rise 100,000 bags to a record 5.3 million on higher Robusta output.
          Growers in Karnataka, the largest coffee producing state, are anticipating a record Robusta harvest due to
          increased area and yield. Although bean exports are forecast to slip 100,000 bags to 4.1 million, this
          marks the third year of strong exports and declining stocks.


Foreign Agricultural Service/USDA
Office of Global Analysis                                                                                                                                              December 2012
Colombia’s production is forecast to             Colombia’s Production Forecast at Four-Decade Low
          slide nearly 200,000 bags to 7.5 million     20
          following reports that production in the
          first two months of the October-
          September marketing year was down 5          15


                                                     Million 60 Kilogram Bags
          percent compared to the same period
          last year. This marks the lowest
          production in four decades and well          10
          below the record 18 million bags
          reached in 1991/92. For the fifth
          consecutive year, problems are                 5
          expected to persist related to the coffee
          cherry borer and rust. Also, the
          ongoing tree renovation program has           -


                                                                                72/73
                                                                                        74/75
                                                                                                76/77
                                                                                                        78/79
                                                                                                                80/81
                                                                                                                        82/83
                                                                                                                                84/85
                                                                                                                                        86/87
                                                                                                                                                88/89
                                                                                                                                                        90/91
                                                                                                                                                                92/93
                                                                                                                                                                        94/95
                                                                                                                                                                                96/97
                                                                                                                                                                                        98/99
                                                                                                                                                                                                00/01
                                                                                                                                                                                                        02/03
                                                                                                                                                                                                                04/05
                                                                                                                                                                                                                        06/07
                                                                                                                                                                                                                                08/09
                                                                                                                                                                                                                                        10/11
                                                                                                                                                                                                                                                12/13 F
          the near-term effect of lowering output
          until these trees reach maturity. As a
          result, bean exports are forecast at just
          6.5 million bags, down 3 percent from the previous year. Bean imports, which jumped to 1.1 million bags
          last year to supply consumption, are forecast to remain elevated at 900,000 bags.

          Central America’s production is forecast to add 200,000 bags to total 14.6 million as modest gains in El
          Salvador and Honduras more than offset a slight decline in Costa Rica. Leaf rust was recently detected in
          several countries, constraining production. The region’s bean exports are forecast to rise 300,000 bags to
          13.6 million.

          The EU accounts for nearly half of world bean imports and is forecast to increase slightly to 45.5 million,
          with top suppliers including Brazil (28%), Vietnam (25%) and Honduras (7%). As a result, ending stocks
          are expected to remain tight near the decade low.

          The United States imports the second-largest amount of coffee beans and is forecast to decrease slightly
          to 23.4 million, with top suppliers including Brazil (25%), Vietnam (18%) and Colombia (13%). Ending
          stocks as well as consumption are forecast to rise incrementally.

          Revised 2011/12
          World production is revised up from the June estimate by 6.8 million bags to 144.4 million.
            • Vietnam is revised up 5.0 million bags to 26.0 million due to higher-than-anticipated area and
                yield.
            • Honduras is raised 1.0 million bags to 5.6 million as more trees reached fruit bearing maturity
                earlier than expected, following previous year’s area expansion.

          World bean exports are raised 6.4 million bags to 101.5 million.
            • Vietnam is revised up 5.0 million bags to 24.0 million following higher available exportable
                supplies.
            • Honduras is raised 1.1 million bags to 5.3 million due to increased production.

          For additional information, please contact Tony Halstead at 202-720-4620, or
          Tony.Halstead@fas.usda.gov


Foreign Agricultural Service/USDA
Office of Global Analysis                                                                                                                                                                                                                                 December 2012
Table 01 Coffee World Production, Supply and Distribution

                                                                                                Thousand 60-Kilogram Bags

                                 Beginning         Arabica           Robusta         Production         Imports         Total Supply     Exports       Domestic      Ending          Total        Exportable
                                   Stocks         Production        Production                                                                        Consumption    Stocks       Distribution    Production


      Coffee, Green
        1978/79                          29,435           59,847            18,770           79,018               678          109,131       64,612         19,462       25,057         109,131         60,035
        1979/80                          25,057           62,302            19,207           81,906               653          107,616       62,130         19,963       25,523         107,616         62,283
        1980/81                          25,523           63,154            22,584           86,174               675          112,372       60,955         20,438       30,979         112,372         66,007
        1981/82                          30,979           75,132            22,396           98,023               755          129,757       65,359         20,556       43,842         129,757         77,771
        1982/83                          43,842           59,258            22,196           81,904               733          126,479       66,059         20,221       40,199         126,479         61,916
        1983/84                          40,199           70,459            17,905           88,801               606          129,606       68,191         20,577       40,838         129,606         68,490
        1984/85                          40,838           65,302            24,591           90,362               456          131,656       72,322         21,968       37,366         131,656         68,591
        1985/86                          37,366           71,299            23,998           95,750               397          133,513       70,478         21,220       41,815         133,513         74,777
        1986/87                          41,815           52,812            26,121           79,394               262          121,471       66,982         21,202       33,287         121,471         58,416
        1987/88                          33,287           78,985            23,810          103,170               296          136,753       67,504         21,075       48,174         136,753         82,310
        1988/89                          48,174           64,934            28,901           94,165               415          142,754       71,371         21,190       50,193         142,754         73,168
        1989/90                          50,193           69,118            27,542           96,958               258          147,409       83,402         20,995       43,012         147,409         76,157
        1990/91                          43,012           72,143            27,768          100,181               331          143,524       76,163         22,265       45,096         143,524         78,131
        1991/92                          45,096           73,980            29,809          104,064               291          149,451       80,887         22,266       46,298         149,451         81,950
        1992/93                          46,298           65,234            27,455           92,959               713          139,970       77,869         21,579       40,522         139,970         71,722
        1993/94                          40,522           65,052            27,146           92,406               585          133,513       76,284         22,928       34,301         133,513         69,764
        1994/95                          34,301           68,809            28,033           97,042             1,070          132,413       68,672         22,526       41,215         132,413         74,978
        1995/96                          41,215           61,394            27,372           88,946             1,079          131,240       74,103         24,049       33,088         131,240         65,393
        1996/97                          33,088           66,452            37,236          103,786             1,091          137,965       84,509         24,361       29,095         137,965         79,780
        1997/98                          29,095           64,712            32,940           97,687             1,220          128,002       77,939         25,180       24,883         128,002         72,986
        1998/99                          24,883           74,859            34,060          108,953             1,435          135,271       85,133         25,738       24,400         135,271         83,533
        1999/00                          24,400           73,281            40,853          114,164             1,303          139,867       93,464         25,588       20,815         139,867         88,735
        2000/01                          20,815           70,362            46,820          117,217             1,488          139,520       90,847         26,303       22,370         139,520         91,069
        2001/02                          22,370           68,298            43,297          111,625             7,024          141,019       88,292         27,490       25,237         141,019         84,385
        2002/03                          39,452           85,085            41,855          126,968           87,976           254,396       93,936        112,832       47,628         254,396         99,628
        2003/04                          47,628           66,674            44,197          110,896           87,734           246,258       90,171        116,307       39,780         246,258         81,111
        2004/05                          39,780           77,898            43,668          121,591           89,163           250,534       93,313        115,792       41,429         250,534         90,673
        2005/06                          41,429           70,563            47,011          117,599           91,018           250,046       93,377        123,633       33,036         250,046         86,020
        2006/07                          33,036           83,690            49,903          133,618           97,018           263,672      104,554        123,036       36,082         263,672        101,795
        2007/08                          36,082           74,368            49,555          123,948           97,198           257,228       97,844        127,704       31,680         257,228         91,002
        2008/09                          31,680           85,152            51,062          136,239           96,931           264,850      100,442        124,596       39,812         264,850        102,026
        2009/10                          39,812           76,501            51,979          128,505          100,007           268,324      102,236        137,179       28,909         268,324         93,042
        2010/11                          28,909           86,948            53,951          140,924          105,630           275,463      113,458        133,098       28,907         275,463        104,603
        2011/12                          28,907           83,185            61,210          144,420          106,978           280,305      114,408        140,970       24,927         280,305        105,620
        2012/13                          24,927           88,818            62,440          151,283          109,072           285,282      116,012        141,373       27,897         285,282        111,710


        Prior to 2002/03, the database does not include import, consumption or stocks data for non-producing countries such as the
        United States, EU-27 and Japan.


Foreign Agricultural Service/USDA
Office of Global Analysis                                                                                                                                                                          December 2012
Table 02 Coffee Summary
                                                                     Thousand 60-Kilogram Bags

                                                                                                                                              Jun        Dec
                                                 2008/09               2009/10               2010/11               2011/12                2012/13    2012/13

     Production                                                                                                                                          none
       Brazil                                        53,300                44,800                54,500               49,200                55,900      55,900
       Vietnam                                       16,980                18,500                20,000               26,000                22,400      25,000
       Indonesia                                     10,000                10,500                 9,325                 8,300                9,700       9,700
       Colombia                                       8,664                 8,100                 8,525                 7,655                7,500       7,500
       Ethiopia                                       5,500                 6,000                 6,125                 6,000                6,500       6,500
       Honduras                                       3,225                 3,550                 3,975                 5,600                5,000       5,800
       India                                          4,375                 4,825                 5,035                 5,200                5,100       5,300
       Peru                                           4,000                 3,300                 4,100                 5,200                4,800       4,800
       Mexico                                         4,550                 4,150                 4,000                 5,000                4,300       4,700
       Guatemala                                      3,980                 4,010                 3,810                 3,860                3,850       3,850
       Other                                         21,665                20,770                21,529               22,405                22,875      22,233
         Total                                      136,239               128,505              140,924               144,420               147,925     151,283
     Domestic Consumption                                                                                                                                none
       EU-27                                         39,575                49,505                41,725               46,190                44,500      44,800
       United States                                 22,650                22,060                22,880               23,410                23,300      23,600
       Brazil                                        18,030                18,760                19,420               19,980                20,760      20,690
       Japan                                          6,915                 6,780                 6,860                 6,975                7,050       7,050
       Russia                                         3,190                 3,805                 4,190                 3,700                4,900       3,900
       Canada                                         2,865                 3,170                 3,375                 3,345                3,600       3,450
       Ethiopia                                       2,500                 2,800                 2,860                 2,900                3,000       3,000
       Other                                         28,871                30,299                31,788               34,470                34,598      34,883
         Total                                      124,596               137,179              133,098               140,970               141,708     141,373
     Ending Stocks                                                                                                                                       none
       EU-27                                         16,325                10,850                12,900               10,400                12,500      10,700
       United States                                  5,333                 4,250                 4,580                 5,100                5,200       5,300
       Brazil                                         6,576                 2,836                 2,906                 2,283                2,926       4,543
       Japan                                          2,050                 1,950                 2,550                 2,140                2,500       2,190
       Vietnam                                        2,307                 1,012                   800                   950                 864        1,825
       Other                                          7,221                 8,011                 5,171                 4,054                3,211       3,339
         Total                                       39,812                28,909                28,907               24,927                27,201      27,897
     Bean Exports                                                                                                                                        none
       Brazil                                        28,396                26,580                31,810               26,556                30,630      29,600
       Vietnam                                       15,430                18,425                18,800               23,950                20,000      22,000
       Colombia                                       8,160                 6,445                 7,400                 6,675                6,500       6,500
       Indonesia                                      6,625                 7,425                 7,415                 4,950                6,100       6,100
       Honduras                                       3,050                 3,200                 3,900                 5,290                4,500       5,500
       Peru                                           3,830                 3,150                 3,880                 5,125                4,600       4,600
       India                                          2,125                 3,040                 4,160                 4,200                4,000       4,100
       Guatemala                                      3,783                 3,860                 3,650                 3,775                3,650       3,650
       Ethiopia                                       3,000                 3,250                 3,235                 3,100                3,500       3,500
       Uganda                                         3,050                 2,670                 3,150                 3,200                3,400       3,400
       Other                                         13,803                13,731                13,104               14,711                14,876      14,574
         Total                                       91,252                91,776              100,504               101,532               101,756     103,524
     Bean Imports                                                                                                                                        none
       EU-27                                         43,350                44,200                44,260               44,100                47,000      45,500
       United States                                 21,660                20,240                22,460               23,700                23,000      23,400
       Japan                                          6,375                 6,160                 6,900                 5,975                6,500       6,500
       Algeria                                        2,045                 2,060                 1,770                 2,200                2,000       2,300
       Canada                                         1,940                 2,010                 2,305                 2,180                2,300       2,300
       Switzerland                                    1,800                 1,950                 2,180                 2,175                2,300       2,300
       Korea, South                                   1,680                 1,705                 1,930                 1,725                2,100       2,000
       Russia                                         1,240                 1,430                 1,540                 1,720                1,900       1,900
       Ecuador                                          310                   650                   820                 1,150                1,400       1,400
       Australia                                        950                 1,040                 1,115                 1,140                1,225       1,200
       Other                                          6,142                 7,520                 8,815                 9,400                9,550       9,010
         Total                                       87,492                88,965                94,095               95,465                99,275      97,810


     Coffee marketing year for producer countries begins either in October (Colombia), April (Indonesia) or July (Brazil), as examples.
     Coffee marketing year for non-producer countries begins in October.
     Bean export and bean import data exclude soluble trade.
     Soluble trade data is in Tables 6C and 7C and total trade is in Tables 6A and 7A.


Foreign Agricultural Service/USDA
Office of Global Analysis                                                                                                                            December 2012
Table 03A Coffee Production
                                                                     Thousand 60-Kilogram Bags

                                                                                                                                              Jun        Dec
                                                 2008/09               2009/10               2010/11               2011/12                2012/13    2012/13

     Production                                                                                                                                          none
       Angola                                             30                   30                    25                    25                  30          30
       Bolivia                                          135                   140                   125                   140                 150         150
       Brazil                                        53,300                44,800                54,500               49,200                55,900      55,900
       Burundi                                          250                   300                   235                   205                 225         225
       Cameroon                                         650                   590                   715                   765                 900         800
       Central African Republic                           10                   30                    27                    10                  20          15
       Colombia                                       8,664                 8,100                 8,525                 7,655                7,500       7,500
       Congo (Kinshasa)                                 300                   305                   265                   255                 265         265
       Costa Rica                                     1,580                 1,475                 1,575                 1,700                1,800       1,600
       Cote d'Ivoire                                  1,853                 2,350                 1,600                 1,600                1,800       1,800
       Cuba                                             127                   120                   120                   125                 125         125
       Dominican Republic                               545                   500                   500                   500                 500         475
       Ecuador                                          635                   635                   650                   600                 605         605
       El Salvador                                    1,550                 1,300                 1,860                 1,250                1,475       1,475
       Ethiopia                                       5,500                 6,000                 6,125                 6,000                6,500       6,500
       Ghana                                              19                   30                    57                    70                 100          90
       Guatemala                                      3,980                 4,010                 3,810                 3,860                3,850       3,850
       Guinea                                           400                   445                   325                   450                 425         425
       Haiti                                            360                   275                   300                   300                 300         300
       Honduras                                       3,225                 3,550                 3,975                 5,600                5,000       5,800
       India                                          4,375                 4,825                 5,035                 5,200                5,100       5,300
       Indonesia                                     10,000                10,500                 9,325                 8,300                9,700       9,700
       Jamaica                                            31                   28                    23                    22                  20          20
       Kenya                                            900                   700                   680                   825                 850         850
       Laos                                             350                   390                   500                   450                 575         575
       Liberia                                             7                     2                    4                     5                   5              5
       Madagascar                                       530                   475                   550                   550                 575         525
       Malawi                                             25                   25                    25                    25                  25          25
       Malaysia                                         975                 1,000                 1,100                 1,450                1,000       1,000
       Mexico                                         4,550                 4,150                 4,000                 5,000                4,300       4,700
       Nicaragua                                      1,650                 1,925                 1,740                 1,880                1,800       1,800
       Nigeria                                            30                   30                    30                    35                  30          30
       Panama                                           100                   100                    87                    85                  90          90
       Papua New Guinea                               1,035                 1,085                   865                 1,400                1,150       1,150
       Paraguay                                           25                   25                    25                    25                  25          25
       Peru                                           4,000                 3,300                 4,100                 5,200                4,800       4,800
       Philippines                                      360                   245                   460                   455                 455         455
       Rwanda                                           340                   240                   317                   240                 300         250
       Sierra Leone                                       87                   90                    45                    95                  70          70
       Sri Lanka                                          35                   35                    35                    30                  35          35
       Tanzania                                       1,150                   600                 1,050                   850                1,000        800
       Thailand                                         800                   900                   900                   900                 900         900
       Togo                                             185                   450                   615                   635                 650         650
       Uganda                                         3,260                 2,870                 3,212                 3,330                3,450       3,450
       United States                                    133                   107                   100                   105                 100         100
       Venezuela                                      1,000                   725                   625                   850                 880         880
       Vietnam                                       16,980                18,500                20,000               26,000                22,400      25,000
       Yemen                                            150                   150                   145                   150                 150         150
       Zambia                                             39                   27                     7                    10                  10          10
       Zimbabwe                                           22                   21                    10                     8                  10              8
         Total                                      136,239               128,505              140,924               144,420               147,925     151,283


     Coffee marketing year for producer countries begins either in October (Colombia), April (Indonesia) or July (Brazil), as examples.
     Coffee marketing year for non-producer countries begins in October.


Foreign Agricultural Service/USDA
Office of Global Analysis                                                                                                                            December 2012
Table 03B Arabica Coffee Production
                                                                     Thousand 60-Kilogram Bags

                                                                                                                                              Jun        Dec
                                                 2008/09               2009/10               2010/11               2011/12                2012/13    2012/13

     Arabica Production                                                                                                                                  none
       Bolivia                                          135                   140                   125                   140                 150         150
       Brazil                                        40,500                33,000                41,800               34,700                40,200      40,200
       Burundi                                          250                   300                   235                   205                 225         225
       Cameroon                                           90                   90                    90                    90                 100         100
       Colombia                                       8,664                 8,100                 8,525                 7,655                7,500       7,500
       Congo (Kinshasa)                                 100                   105                   100                    90                 100         100
       Costa Rica                                     1,580                 1,475                 1,575                 1,700                1,800       1,600
       Cuba                                             127                   120                   120                   125                 125         125
       Dominican Republic                               545                   500                   500                   500                 500         475
       Ecuador                                          360                   375                   400                   400                 415         415
       El Salvador                                    1,550                 1,300                 1,860                 1,250                1,475       1,475
       Ethiopia                                       5,500                 6,000                 6,125                 6,000                6,500       6,500
       Guatemala                                      3,970                 4,000                 3,800                 3,850                3,840       3,840
       Haiti                                            360                   275                   300                   300                 300         300
       Honduras                                       3,225                 3,550                 3,975                 5,600                5,000       5,800
       India                                          1,325                 1,575                 1,570                 1,660                1,675       1,640
       Indonesia                                      1,300                 1,500                 1,375                 1,300                1,700       1,700
       Jamaica                                            31                   28                    23                    22                  20          20
       Kenya                                            900                   700                   680                   825                 850         850
       Madagascar                                         30                   25                    25                    25                  25          25
       Malawi                                             25                   25                    25                    25                  25          25
       Mexico                                         4,300                 3,950                 3,800                 4,800                4,100       4,500
       Nicaragua                                      1,650                 1,925                 1,740                 1,880                1,800       1,800
       Panama                                           100                   100                    87                    85                  90          90
       Papua New Guinea                               1,000                 1,050                   825                 1,350                1,100       1,100
       Paraguay                                           25                   25                    25                    25                  25          25
       Peru                                           4,000                 3,300                 4,100                 5,200                4,800       4,800
       Philippines                                        35                   20                    35                    30                  30          30
       Rwanda                                           340                   240                   317                   240                 300         250
       Tanzania                                         650                   400                   600                   550                 700         500
       Uganda                                           650                   818                   644                   630                 650         650
       United States                                    133                   107                   100                   105                 100         100
       Venezuela                                      1,000                   725                   625                   850                 880         880
       Vietnam                                          480                   450                   650                   800                 800         850
       Yemen                                            150                   150                   145                   150                 150         150
       Zambia                                             39                   27                     7                    10                  10          10
       Zimbabwe                                           22                   21                    10                     8                  10              8
         Total                                       85,152                76,501                86,948               83,185                88,080      88,818


     Coffee marketing year for producer countries begins either in October (Colombia), April (Indonesia) or July (Brazil), as examples.
     Coffee marketing year for non-producer countries begins in October.


Foreign Agricultural Service/USDA
Office of Global Analysis                                                                                                                            December 2012
Table 03C Robusta Coffee Production
                                                                     Thousand 60-Kilogram Bags

                                                                                                                                              Jun        Dec
                                                 2008/09               2009/10               2010/11               2011/12                2012/13    2012/13

     Robusta Production                                                                                                                                  none
       Angola                                             30                   30                    25                    25                  30          30
       Brazil                                        12,800                11,800                12,700               14,500                15,700      15,700
       Cameroon                                         560                   500                   625                   675                 800         700
       Central African Republic                           10                   30                    27                    10                  20          15
       Congo (Kinshasa)                                 200                   200                   165                   165                 165         165
       Cote d'Ivoire                                  1,853                 2,350                 1,600                 1,600                1,800       1,800
       Ecuador                                          275                   260                   250                   200                 190         190
       Ghana                                              19                   30                    57                    70                 100          90
       Guatemala                                          10                   10                    10                    10                  10          10
       Guinea                                           400                   445                   325                   450                 425         425
       India                                          3,050                 3,250                 3,465                 3,540                3,425       3,660
       Indonesia                                      8,700                 9,000                 7,950                 7,000                8,000       8,000
       Laos                                             350                   390                   500                   450                 575         575
       Liberia                                             7                     2                    4                     5                   5              5
       Madagascar                                       500                   450                   525                   525                 550         500
       Malaysia                                         975                 1,000                 1,100                 1,450                1,000       1,000
       Mexico                                           250                   200                   200                   200                 200         200
       Nigeria                                            30                   30                    30                    35                  30          30
       Papua New Guinea                                   35                   35                    40                    50                  50          50
       Philippines                                      300                   200                   400                   400                 400         400
       Sierra Leone                                       87                   90                    45                    95                  70          70
       Sri Lanka                                          25                   25                    25                    20                  25          25
       Tanzania                                         500                   200                   450                   300                 300         300
       Thailand                                         800                   900                   900                   900                 900         900
       Togo                                             185                   450                   615                   635                 650         650
       Uganda                                         2,610                 2,052                 2,568                 2,700                2,800       2,800
       Vietnam                                       16,500                18,050                19,350               25,200                21,600      24,150
         Total                                       51,062                51,979                53,951               61,210                59,820      62,440


     Coffee marketing year for producer countries begins either in October (Colombia), April (Indonesia) or July (Brazil), as examples.
     Coffee marketing year for non-producer countries begins in October.


Foreign Agricultural Service/USDA
Office of Global Analysis                                                                                                                            December 2012
Table 04 Coffee Consumption
                                                Thousand 60-Kilogram Bags

                                                                                            Jun        Dec
                                    2008/09       2009/10       2010/11      2011/12    2012/13    2012/13

     Domestic Consumption                                                                              none
       Algeria                         2,070         2,080          1,815       2,240      2,050       2,350
       Argentina                         680          740            790         740        875         775
       Australia                       1,225         1,330          1,390       1,450      1,550       1,525
       Bolivia                            80           75             75          70         75          75
       Brazil                         18,030        18,760         19,420      19,980     20,760      20,690
       Cameroon                           75           75             75          75         75          75
       Canada                          2,865         3,170          3,375       3,345      3,600       3,450
       China                             435          610            930         925       1,050       1,100
       Colombia                        1,065         1,180          1,120       1,300      1,200       1,300
       Congo (Kinshasa)                  200          200            200         200        200         190
       Costa Rica                        261          305            423         462        415         415
       Cote d'Ivoire                     300          300            300         300        108         108
       Croatia                           380          380            380         355        380         380
       Cuba                              361          333            340         340        340         340
       Dominican Republic                503          464            452         450        450         435
       Ecuador                           167          169            205         238        223         223
       El Salvador                       170          180            270         270        270         270
       Ethiopia                        2,500         2,800          2,860       2,900      3,000       3,000
       EU-27                          39,575        49,505         41,725      46,190     44,500      44,800
       Guatemala                         325          340            350         400        375         375
       Haiti                             340          284            294         291        300         300
       Honduras                          200          200            286         265        465         260
       India                           1,210         1,260           938        1,195      1,045       1,065
       Indonesia                       1,890         1,925          1,690       2,280      2,540       2,490
       Iran                              185          335            245         260        275         250
       Japan                           6,915         6,780          6,860       6,975      7,050       7,050
       Jordan                            420          360            330         390        375         425
       Kazakhstan                        290          270            190         200        225         225
       Kenya                              50           50             50          50         50          50
       Korea, South                    1,680         1,705          1,930       1,725      2,100       2,000
       Laos                              100          100            100         100        100         100
       Madagascar                        450          450            455         450        450         440
       Malaysia                          525          500            470         610        600         600
       Mexico                          1,950         1,900          1,990       1,950      2,050       1,950
       Morocco                           600          580            540         700        500         700
       New Zealand                       280          285            270         295        280         310
       Nicaragua                          90           90             90          90         90          90
       Nigeria                            29           27             28          28         25          25
       Norway                            700          670            710         660        700         700
       Panama                             55           47             50          50         50          50
       Papua New Guinea                   30           30             30          40         46          46
       Paraguay                           35           35             34          25         20          20
       Peru                              150          160            170         170        170         170
       Philippines                     1,690         2,220          2,839       3,445      2,670       2,970
       Russia                          3,190         3,805          4,190       3,700      4,900       3,900
       Serbia                            660          595            620         745        650         750
       South Africa                      390          470            550         515        575         550
       Sri Lanka                          41           35             35          30         35          35
       Switzerland                     1,800         1,950          2,180       2,175      2,300       2,300
       Tanzania                           25           35             35          45         45          45
       Thailand                          616          711            795        1,040       900        1,000
       Turkey                            260          275            315         350        325         375
       Uganda                            130          140            150         150        150         150
       Ukraine                         1,670         1,510          1,370       1,100      1,500       1,100
       United States                  22,650        22,060         22,880      23,410     23,300      23,600
       Venezuela                         835          875           1,305       1,315      1,320       1,320
       Vietnam                           950         1,200          1,337       1,665      1,775       1,825
       Yemen                             115          120            125         130        130         130
         Total                       124,596       137,179        133,098     140,970    141,708     141,373


Foreign Agricultural Service/USDA
Office of Global Analysis                                                                          December 2012
Table 05 Green Coffee Bean Ending Stocks
                                                                     Thousand 60-Kilogram Bags

                                                                                                                                              Jun        Dec
                                                 2008/09               2009/10               2010/11               2011/12                2012/13    2012/13

     Ending Stocks                                                                                                                                       none
       Angola                                             20                   11                     5                     3                   2              2
       Bolivia                                            44                   35                    19                     4                   4              4
       Brazil                                         6,576                 2,836                 2,906                 2,283                2,926       4,543
       Burundi                                            18                   23                    15                    15                   5              5
       Cameroon                                         219                    44                    34                    24                  24          24
       Central African Republic                         137                   112                    87                    60                  32          35
       Colombia                                         209                   284                    99                   249                 179         284
       Congo (Kinshasa)                                   31                   34                    24                    10                   4          10
       Costa Rica                                         25                  125                   197                   180                  84          85
       Cote d'Ivoire                                      88                   93                   408                   118                 100         110
       EU-27                                         16,325                10,850                12,900               10,400                12,500      10,700
       Ecuador                                             7                   65                   143                   137                 122         122
       El Salvador                                        32                   48                    13                    14                  25          30
       Ethiopia                                         120                    70                   100                   100                 100         100
       Ghana                                               5                     4                    3                     2                   6              6
       Guatemala                                        229                   239                   199                    59                 159          34
       Guinea                                             12                     7                    2                    12                  22          22
       Haiti                                              44                   25                    25                    25                  15          15
       Honduras                                           50                  218                    30                    90                 105         145
       India                                          2,523                 2,578                 2,000                 1,100                 425         580
       Indonesia                                      1,208                 1,603                    83                    88                 148         148
       Japan                                          2,050                 1,950                 2,550                 2,140                2,500       2,190
       Kenya                                            140                    50                    30                    25                  35          25
       Madagascar                                         37                   22                    12                    12                  12          12
       Mexico                                           109                   124                    89                   104                 129         124
       Nicaragua                                           8                   37                    22                    32                  17          17
       Norway                                           125                   125                   125                   125                 125         125
       Papua New Guinea                                   21                   36                    21                    31                  35          35
       Paraguay                                           39                   24                    10                     5                   5              5
       Peru                                               84                   74                   124                    29                  84          59
       Philippines                                      124                   469                    90                   165                 150         150
       Switzerland                                      200                   200                   200                   200                 200         200
       Tanzania                                         280                    40                    50                   100                 150         100
       Thailand                                           42                   92                    60                    63                  55          73
       Togo                                                1                     9                    7                     7                   7              7
       Uganda                                           641                   701                   613                   593                 493         493
       United States                                  5,333                 4,250                 4,580                 5,100                5,200       5,300
       Venezuela                                        349                   390                   232                   273                 153         153
       Vietnam                                        2,307                 1,012                   800                   950                 864        1,825
         Total                                       39,812                28,909                28,907               24,927                27,201      27,897


     Coffee marketing year for producer countries begins either in October (Colombia), April (Indonesia) or July (Brazil), as examples.
     Coffee marketing year for non-producer countries begins in October.


Foreign Agricultural Service/USDA
Office of Global Analysis                                                                                                                            December 2012
Table 06A Total Coffee Exports
                                                                     Thousand 60-Kilogram Bags

                                                                                                                                              Jun        Dec
                                                 2008/09               2009/10               2010/11               2011/12                2012/13    2012/13

     Exports                                                                                                                                             none
       Angola                                              4                     8                     5                    8                   7              7
       Bolivia                                            73                   74                     66                   85                  75          75
       Brazil                                        31,475                29,780                  35,010             29,843                34,000      32,950
       Burundi                                          250                   290                    235                  200                 230         230
       Cameroon                                         480                   690                    650                  700                 825         725
       Central African Republic                            6                   25                     22                    7                  15          10
       Colombia                                       8,935                 7,435                   8,385               7,310                7,300       7,125
       Congo (Kinshasa)                                 117                   102                     75                   69                  75          75
       Costa Rica                                     1,385                 1,200                   1,255               1,330                1,600       1,400
       Cote d'Ivoire                                  1,555                 2,045                    985                1,590                1,700       1,700
       Cuba                                                6                     7                     5                   10                  10          10
       Dominican Republic                                 42                   36                     48                   50                  50          40
       Ecuador                                          861                 1,140                   1,250               1,521                1,800       1,800
       El Salvador                                    1,510                 1,240                   1,772               1,173                1,403       1,403
       Ethiopia                                       3,000                 3,250                   3,235               3,100                3,500       3,500
       EU-27                                            225                   170                    485                  410                 500         400
       Ghana                                              18                   30                     57                   70                  95          85
       Guatemala                                      3,783                 3,860                   3,650               3,775                3,650       3,650
       Guinea                                           375                   410                    300                  400                 375         375
       Haiti                                              17                   10                      6                    9                  10          10
       Honduras                                       3,050                 3,200                   3,900               5,290                4,500       5,500
       India                                          2,415                 3,590                   4,890               5,005                5,400       4,805
       Indonesia                                      7,700                 8,750                   9,720               7,450                8,100       8,100
       Jamaica                                            26                   23                     18                   17                  15          15
       Kenya                                            980                   740                    650                  780                 800         800
       Laos                                             250                   290                    400                  350                 475         475
       Liberia                                             7                     2                     4                    5                   5              5
       Madagascar                                       115                    40                    105                  100                 125          85
       Malawi                                             25                   24                     24                   24                  24          24
       Malaysia                                       1,100                 1,460                   1,675               1,900                1,900       1,600
       Mexico                                         2,735                 2,480                   2,460               3,315                2,500       3,000
       Nicaragua                                      1,585                 1,806                   1,665               1,780                1,725       1,725
       Nigeria                                             1                     3                     2                    7                   5              5
       Panama                                             45                   53                     37                   35                  40          40
       Papua New Guinea                               1,070                 1,040                    850                1,350                1,100       1,100
       Paraguay                                            5                     5                     5                    5                   5              5
       Peru                                           3,830                 3,150                   3,880               5,125                4,600       4,600
       Rwanda                                           340                   240                    317                  240                 300         250
       Sierra Leone                                       70                   70                     25                   75                  50          50
       Tanzania                                       1,205                   805                   1,005                 755                 955         755
       Thailand                                         644                   684                   1,207                 767                 850         840
       Togo                                             185                   440                    615                  635                 650         650
       Uganda                                         3,050                 2,670                   3,150               3,200                3,400       3,400
       Venezuela                                        235                   125                    100                  100                  80          80
       Vietnam                                       15,565                18,670                  19,225             24,405                20,450      22,500
       Yemen                                              35                   30                     20                   20                  20          20
       Zambia                                             39                   27                      7                   10                  10          10
       Zimbabwe                                           18                   17                      6                    3                   5              3
         Total                                      100,442               102,236              113,458               114,408               115,309     116,012


     A conversion factor of 2.6 was used to convert soluble coffee to the green bean equivalent.

     Coffee marketing year for producer countries begins either in October (Colombia), April (Indonesia) or July (Brazil), as examples.
     Coffee marketing year for non-producer countries begins in October.
     For each non-producing country, the balance between imports and exports was used in order to remove double-counting
     from these trade figures.


Foreign Agricultural Service/USDA
Office of Global Analysis                                                                                                                            December 2012
Table 06B Green Coffee Bean Exports
                                                                     Thousand 60-Kilogram Bags

                                                                                                                                              Jun        Dec
                                                 2008/09               2009/10               2010/11               2011/12                2012/13    2012/13

     Bean Exports                                                                                                                                        none
       Angola                                              4                     8                    5                     8                   7              7
       Bolivia                                            73                   74                    66                    85                  75          75
       Brazil                                        28,396                26,580                31,810               26,556                30,630      29,600
       Burundi                                          250                   290                   235                   200                 230         230
       Cameroon                                         480                   690                   650                   700                 825         725
       Central African Republic                            6                   25                    22                     7                  15          10
       Colombia                                       8,160                 6,445                 7,400                 6,675                6,500       6,500
       Congo (Kinshasa)                                 117                   102                    75                    69                  75          75
       Costa Rica                                     1,385                 1,200                 1,255                 1,330                1,600       1,400
       Cote d'Ivoire                                  1,180                 1,755                   725                 1,290                1,400       1,400
       Cuba                                                6                     7                    5                    10                  10          10
       Dominican Republic                                 42                   36                    48                    50                  50          40
       Ecuador                                          179                   450                   425                   575                 600         525
       El Salvador                                    1,506                 1,236                 1,770                 1,170                1,400       1,400
       Ethiopia                                       3,000                 3,250                 3,235                 3,100                3,500       3,500
       Ghana                                              18                   30                    57                    70                  95          85
       Guatemala                                      3,783                 3,860                 3,650                 3,775                3,650       3,650
       Guinea                                           375                   410                   300                   400                 375         375
       Haiti                                              17                   10                     6                     9                  10          10
       Honduras                                       3,050                 3,200                 3,900                 5,290                4,500       5,500
       India                                          2,125                 3,040                 4,160                 4,200                4,000       4,100
       Indonesia                                      6,625                 7,425                 7,415                 4,950                6,100       6,100
       Jamaica                                            26                   23                    18                    17                  15          15
       Kenya                                            980                   740                   650                   780                 800         800
       Laos                                             250                   290                   400                   350                 475         475
       Liberia                                             7                     2                    4                     5                   5              5
       Madagascar                                       115                    40                   105                   100                 125          85
       Malawi                                             25                   24                    24                    24                  24          24
       Mexico                                         2,125                 1,790                 1,735                 2,525                1,800       2,200
       Nicaragua                                      1,425                 1,650                 1,525                 1,675                1,600       1,600
       Nigeria                                             1                     3                    2                     7                   5              5
       Panama                                             45                   53                    37                    35                  40          40
       Papua New Guinea                               1,070                 1,040                   850                 1,350                1,100       1,100
       Paraguay                                            5                     5                    5                     5                   5              5
       Peru                                           3,830                 3,150                 3,880                 5,125                4,600       4,600
       Rwanda                                           340                   240                   317                   240                 300         250
       Sierra Leone                                       70                   70                    25                    75                  50          50
       Tanzania                                       1,200                   800                 1,000                   750                 950         750
       Thailand                                            4                     4                   15                    32                  50          40
       Togo                                             185                   440                   615                   635                 650         650
       Uganda                                         3,050                 2,670                 3,150                 3,200                3,400       3,400
       Venezuela                                        200                   120                   100                   100                  80          80
       Vietnam                                       15,430                18,425                18,800               23,950                20,000      22,000
       Yemen                                              35                   30                    20                    20                  20          20
       Zambia                                             39                   27                     7                    10                  10          10
       Zimbabwe                                           18                   17                     6                     3                   5              3
         Total                                       91,252                91,776              100,504               101,532               101,756     103,524


     Coffee marketing year for producer countries begins either in October (Colombia), April (Indonesia) or July (Brazil), as examples.
     Coffee marketing year for non-producer countries begins in October.
     For each non-producing country, the balance between imports and exports was used in order to remove double-counting
     from these trade figures.


Foreign Agricultural Service/USDA
Office of Global Analysis                                                                                                                            December 2012
Table 06C Soluble Coffee Exports
                                                                     Thousand 60-Kilogram Bags

                                                                                                                                              Jun        Dec
                                                 2008/09               2009/10               2010/11               2011/12                2012/13    2012/13

     Soluble Exports                                                                                                                                     none
       Brazil                                         2,991                 3,120                   3,140               3,236                3,300       3,300
       Colombia                                         725                   925                    935                  610                 775         600
       Cote d'Ivoire                                    375                   290                    260                  300                 300         300
       Ecuador                                          680                   680                    825                  946                1,200       1,275
       EU-27                                            225                   170                    485                  410                 500         400
       India                                            290                   550                    725                  800                1,400        700
       Indonesia                                      1,075                 1,325                   2,305               2,500                2,000       2,000
       Malaysia                                       1,100                 1,460                   1,675               1,900                1,900       1,600
       Mexico                                           610                   690                    725                  790                 700         800
       Nicaragua                                        160                   156                    140                  105                 125         125
       Thailand                                         640                   680                   1,192                 735                 800         800
       Vietnam                                          110                   195                    340                  360                 400         400
         Total                                        8,986                10,246                  12,752             12,697                13,405      12,305


     A conversion factor of 2.6 was used to convert soluble coffee to the green bean equivalent.

     Coffee marketing year for producer countries begins either in October (Colombia), April (Indonesia) or July (Brazil), as examples.
     Coffee marketing year for non-producer countries begins in October.
     For each non-producing country, the balance between imports and exports was used in order to remove double-counting
     from these trade figures.


Foreign Agricultural Service/USDA
Office of Global Analysis                                                                                                                            December 2012
Table 07A Total Coffee Imports
                                                                     Thousand 60-Kilogram Bags

                                                                                                                                              Jun        Dec
                                                 2008/09               2009/10               2010/11               2011/12                2012/13    2012/13

     Imports                                                                                                                                             none
       Algeria                                        2,070                 2,080                   1,815               2,240                2,050       2,350
       Argentina                                        680                   740                    790                  740                 875         775
       Australia                                      1,225                 1,330                   1,390               1,450                1,550       1,525
       Canada                                         2,865                 3,170                   3,375               3,345                3,600       3,450
       China                                            435                   610                    930                  925                1,050       1,100
       Colombia                                         660                   590                    795                1,105                1,040        960
       Costa Rica                                         15                  130                    175                   75                 120         120
       Croatia                                          380                   380                    380                  355                 380         380
       Cuba                                             240                   220                    225                  225                 225         225
       Ecuador                                          389                   732                    883                1,153                1,403       1,403
       El Salvador                                      157                   136                    147                  194                 214         214
       EU-27                                         43,350                44,200                  44,260             44,100                47,000      45,500
       Guatemala                                        188                   200                    150                  175                 150         150
       Honduras                                           18                   18                     23                   15                  15          15
       India                                               0                   80                    215                  100                 770          50
       Indonesia                                        290                   570                    565                1,435                1,000        950
       Iran                                             185                   335                    245                  260                 275         250
       Japan                                          7,005                 6,680                   7,460               6,565                7,150       7,100
       Jordan                                           420                   360                    330                  390                 375         425
       Kazakhstan                                       290                   270                    190                  200                 225         225
       Korea, South                                   1,680                 1,705                   1,930               1,725                2,100       2,000
       Malaysia                                         650                   960                   1,045               1,060                1,500       1,200
       Mexico                                           114                   245                    415                  280                 270         270
       Morocco                                          600                   580                    540                  700                 500         700
       New Zealand                                      280                   285                    270                  295                 280         310
       Norway                                           700                   670                    710                  660                 700         700
       Philippines                                    1,325                 2,320                   2,000               3,065                2,200       2,500
       Russia                                         3,190                 3,805                   4,190               3,700                4,900       3,900
       Serbia                                           660                   595                    620                  745                 650         750
       South Africa                                     390                   470                    550                  515                 575         550
       Switzerland                                    1,800                 1,950                   2,180               2,175                2,300       2,300
       Thailand                                         400                   545                   1,070                 910                 850         950
       Turkey                                           260                   275                    315                  350                 325         375
       Ukraine                                        1,670                 1,510                   1,370               1,100                1,500       1,100
       United States                                 22,250                20,870                  23,110             23,825                23,500      23,700
       Venezuela                                           5                  316                    622                  606                 400         400
       Vietnam                                            95                   75                    350                  220                 175         200
         Total                                       96,931               100,007              105,630               106,978               112,192     109,072


     A conversion factor of 2.6 was used to convert soluble coffee to the green bean equivalent.

     Coffee marketing year for producer countries begins either in October (Colombia), April (Indonesia) or July (Brazil), as examples.
     Coffee marketing year for non-producer countries begins in October.
     For each non-producing country, the balance between imports and exports was used in order to remove double-counting
     from these trade figures.


Foreign Agricultural Service/USDA
Office of Global Analysis                                                                                                                            December 2012
Tổng kết thị trường cà phê thế giới năm 2012

More Related Content

Similar to Tổng kết thị trường cà phê thế giới năm 2012

Supreme Flour World Wheat Presentation (October 2012)
Supreme Flour World Wheat Presentation (October 2012)Supreme Flour World Wheat Presentation (October 2012)
Supreme Flour World Wheat Presentation (October 2012)
Supreme Flour
 
Daily livestock report sep 10 2012
Daily livestock report sep 10 2012Daily livestock report sep 10 2012
Daily livestock report sep 10 2012
joseleorcasita
 
Daily livestock report sep 10 2012
Daily livestock report sep 10 2012Daily livestock report sep 10 2012
Daily livestock report sep 10 2012
joseleorcasita
 
Daily livestock report sep 17 2012
Daily livestock report sep 17 2012Daily livestock report sep 17 2012
Daily livestock report sep 17 2012
joseleorcasita
 
Supreme Flour World Wheat 2012
Supreme Flour World Wheat 2012Supreme Flour World Wheat 2012
Supreme Flour World Wheat 2012
wg2k
 
Rice production in the cone of South America – what can we learn for GRiSP-Asia?
Rice production in the cone of South America – what can we learn for GRiSP-Asia?Rice production in the cone of South America – what can we learn for GRiSP-Asia?
Rice production in the cone of South America – what can we learn for GRiSP-Asia?
CIAT
 
Daily livestock report apr 09 2013
Daily livestock report apr 09 2013Daily livestock report apr 09 2013
Daily livestock report apr 09 2013
joseleorcasita
 

Similar to Tổng kết thị trường cà phê thế giới năm 2012 (20)

Supreme Flour World Wheat Presentation (October 2012)
Supreme Flour World Wheat Presentation (October 2012)Supreme Flour World Wheat Presentation (October 2012)
Supreme Flour World Wheat Presentation (October 2012)
 
Daily livestock report sep 10 2012
Daily livestock report sep 10 2012Daily livestock report sep 10 2012
Daily livestock report sep 10 2012
 
Daily livestock report sep 10 2012
Daily livestock report sep 10 2012Daily livestock report sep 10 2012
Daily livestock report sep 10 2012
 
More trouble ahead for the cotton sector
More trouble ahead for the cotton sectorMore trouble ahead for the cotton sector
More trouble ahead for the cotton sector
 
Supreme Flour World Wheat Presentation (August 2012)
Supreme Flour World Wheat Presentation (August 2012)Supreme Flour World Wheat Presentation (August 2012)
Supreme Flour World Wheat Presentation (August 2012)
 
FAO - agribusiness handbook: malt beer
FAO - agribusiness handbook: malt beerFAO - agribusiness handbook: malt beer
FAO - agribusiness handbook: malt beer
 
Cellulose in Brazil
Cellulose in BrazilCellulose in Brazil
Cellulose in Brazil
 
Dairy sector 2016
Dairy sector 2016Dairy sector 2016
Dairy sector 2016
 
14th september 2020 daily global regional,local rice e newsletter
14th september 2020 daily global regional,local rice e newsletter14th september 2020 daily global regional,local rice e newsletter
14th september 2020 daily global regional,local rice e newsletter
 
Daily livestock report sep 17 2012
Daily livestock report sep 17 2012Daily livestock report sep 17 2012
Daily livestock report sep 17 2012
 
Supreme Flour World Wheat 2012
Supreme Flour World Wheat 2012Supreme Flour World Wheat 2012
Supreme Flour World Wheat 2012
 
Market Report Summer 2015
Market Report Summer 2015Market Report Summer 2015
Market Report Summer 2015
 
Market Report Summer 2015
Market Report Summer 2015Market Report Summer 2015
Market Report Summer 2015
 
A competitive South African Wheat Industry Is Paramount To Food Security
A competitive South African Wheat Industry Is Paramount To Food SecurityA competitive South African Wheat Industry Is Paramount To Food Security
A competitive South African Wheat Industry Is Paramount To Food Security
 
Rice production in the cone of South America – what can we learn for GRiSP-Asia?
Rice production in the cone of South America – what can we learn for GRiSP-Asia?Rice production in the cone of South America – what can we learn for GRiSP-Asia?
Rice production in the cone of South America – what can we learn for GRiSP-Asia?
 
Cgc presentation
Cgc presentationCgc presentation
Cgc presentation
 
14th september 2020 daily global regional,local rice e newsletter
14th september 2020 daily global regional,local rice e newsletter14th september 2020 daily global regional,local rice e newsletter
14th september 2020 daily global regional,local rice e newsletter
 
Daily livestock report apr 09 2013
Daily livestock report apr 09 2013Daily livestock report apr 09 2013
Daily livestock report apr 09 2013
 
Global Feed Markets: November - December 2012
Global Feed Markets: November - December 2012Global Feed Markets: November - December 2012
Global Feed Markets: November - December 2012
 
Soyatech_Minneapolis_Oct_2010
Soyatech_Minneapolis_Oct_2010Soyatech_Minneapolis_Oct_2010
Soyatech_Minneapolis_Oct_2010
 

More from CoffeePlus Corp

More from CoffeePlus Corp (6)

Thuật ngữ và định nghĩa về cà phê
 Thuật ngữ và định nghĩa về cà phê Thuật ngữ và định nghĩa về cà phê
Thuật ngữ và định nghĩa về cà phê
 
Triển vọng thị trường cà phê thế giới 2013
Triển vọng thị trường cà phê thế giới 2013Triển vọng thị trường cà phê thế giới 2013
Triển vọng thị trường cà phê thế giới 2013
 
Chiến tranh cà phê đã nổ
Chiến tranh cà phê đã nổChiến tranh cà phê đã nổ
Chiến tranh cà phê đã nổ
 
Hãi hùng cà phê bẩn ở Việt Nam
Hãi hùng cà phê bẩn ở Việt NamHãi hùng cà phê bẩn ở Việt Nam
Hãi hùng cà phê bẩn ở Việt Nam
 
Sản xuất cà phê bền vững sử dụng mô hình 4C
Sản xuất cà phê bền vững sử dụng mô hình 4CSản xuất cà phê bền vững sử dụng mô hình 4C
Sản xuất cà phê bền vững sử dụng mô hình 4C
 
Mau 2
Mau 2Mau 2
Mau 2
 

Tổng kết thị trường cà phê thế giới năm 2012

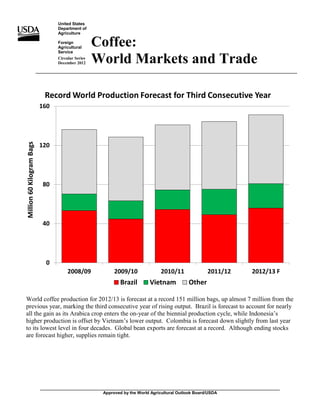
  • 1. United States Department of Agriculture Foreign Agricultural Service Coffee: Circular Series December 2012 World Markets and Trade Record World Production Forecast for Third Consecutive Year 160 120 Million 60 Kilogram Bags 80 40 0 2008/09 2009/10 2010/11 2011/12 2012/13 F Brazil Vietnam Other World coffee production for 2012/13 is forecast at a record 151 million bags, up almost 7 million from the previous year, marking the third consecutive year of rising output. Brazil is forecast to account for nearly all the gain as its Arabica crop enters the on-year of the biennial production cycle, while Indonesia’s higher production is offset by Vietnam’s lower output. Colombia is forecast down slightly from last year to its lowest level in four decades. Global bean exports are forecast at a record. Although ending stocks are forecast higher, supplies remain tight. _______________________________________________________________________________________________________ Approved by the World Agricultural Outlook Board/USDA
  • 2. 2012/13 Forecast Overview Brazil’s production is forecast at a Brazil’s Arabica Production Below Previous On-Cycle record 55.9 million bags, up 6.7 million 60 from the previous year due primarily to the Arabica trees entering the on-year of the biennial production cycle. Whereas Million 60 Kilogram Bags previous cycles grew steadily, this year 40 it is forecast slightly below the last on- year due to frost damage and dry conditions in Minas Gerais, its main growing region. The Robusta harvest is 20 forecast to continue expanding as favorable weather and good crop management aided fruit settings and development in Espirito Santo, where 0 the vast majority is grown. Nearly half 06/07 07/08 08/09 09/10 10/11 11/12 12/13 F of the additional supply is expected to Arabica Robusta augment exports, with the rest going to modest gains in consumption and stocks. Vietnam’s production is forecast at 25.0 Vietnam’s Production Forecast to Retreat from Record 30 million bags, down 1.0 million from last year’s record harvest (significant area expansion and record yield caused last year’s unexpected 30 percent production 20 Million 60 Kilogram Bags spike). Pre-season rain throughout the growing region caused an early bloom which lowered yield. Bean exports are forecast 2.0 million bags lower to 22.0 million, while ending stocks are 10 expected to almost double to 1.8 million bags. Consumption is forecast to continue rising as the coffee culture spreads. - 08/09 09/10 10/11 11/12 12/13 F Indonesia’s production is forecast to rebound 1.4 million bags to 9.7 million on favorable growing conditions, whereas the previous two harvests suffered from excessive rainfall. The forecast falls short of the record 2009/10 harvest because coffee area has since declined over 5 percent as higher prices for cocoa, rubber, and palm oil encouraged substitution. Bean exports are forecast to recover 1.2 million bags to 6.1 million as production gains are mostly exported. India’s production is forecast to rise 100,000 bags to a record 5.3 million on higher Robusta output. Growers in Karnataka, the largest coffee producing state, are anticipating a record Robusta harvest due to increased area and yield. Although bean exports are forecast to slip 100,000 bags to 4.1 million, this marks the third year of strong exports and declining stocks. Foreign Agricultural Service/USDA Office of Global Analysis December 2012
  • 3. Colombia’s production is forecast to Colombia’s Production Forecast at Four-Decade Low slide nearly 200,000 bags to 7.5 million 20 following reports that production in the first two months of the October- September marketing year was down 5 15 Million 60 Kilogram Bags percent compared to the same period last year. This marks the lowest production in four decades and well 10 below the record 18 million bags reached in 1991/92. For the fifth consecutive year, problems are 5 expected to persist related to the coffee cherry borer and rust. Also, the ongoing tree renovation program has - 72/73 74/75 76/77 78/79 80/81 82/83 84/85 86/87 88/89 90/91 92/93 94/95 96/97 98/99 00/01 02/03 04/05 06/07 08/09 10/11 12/13 F the near-term effect of lowering output until these trees reach maturity. As a result, bean exports are forecast at just 6.5 million bags, down 3 percent from the previous year. Bean imports, which jumped to 1.1 million bags last year to supply consumption, are forecast to remain elevated at 900,000 bags. Central America’s production is forecast to add 200,000 bags to total 14.6 million as modest gains in El Salvador and Honduras more than offset a slight decline in Costa Rica. Leaf rust was recently detected in several countries, constraining production. The region’s bean exports are forecast to rise 300,000 bags to 13.6 million. The EU accounts for nearly half of world bean imports and is forecast to increase slightly to 45.5 million, with top suppliers including Brazil (28%), Vietnam (25%) and Honduras (7%). As a result, ending stocks are expected to remain tight near the decade low. The United States imports the second-largest amount of coffee beans and is forecast to decrease slightly to 23.4 million, with top suppliers including Brazil (25%), Vietnam (18%) and Colombia (13%). Ending stocks as well as consumption are forecast to rise incrementally. Revised 2011/12 World production is revised up from the June estimate by 6.8 million bags to 144.4 million. • Vietnam is revised up 5.0 million bags to 26.0 million due to higher-than-anticipated area and yield. • Honduras is raised 1.0 million bags to 5.6 million as more trees reached fruit bearing maturity earlier than expected, following previous year’s area expansion. World bean exports are raised 6.4 million bags to 101.5 million. • Vietnam is revised up 5.0 million bags to 24.0 million following higher available exportable supplies. • Honduras is raised 1.1 million bags to 5.3 million due to increased production. For additional information, please contact Tony Halstead at 202-720-4620, or Tony.Halstead@fas.usda.gov Foreign Agricultural Service/USDA Office of Global Analysis December 2012
  • 4. Table 01 Coffee World Production, Supply and Distribution Thousand 60-Kilogram Bags Beginning Arabica Robusta Production Imports Total Supply Exports Domestic Ending Total Exportable Stocks Production Production Consumption Stocks Distribution Production Coffee, Green 1978/79 29,435 59,847 18,770 79,018 678 109,131 64,612 19,462 25,057 109,131 60,035 1979/80 25,057 62,302 19,207 81,906 653 107,616 62,130 19,963 25,523 107,616 62,283 1980/81 25,523 63,154 22,584 86,174 675 112,372 60,955 20,438 30,979 112,372 66,007 1981/82 30,979 75,132 22,396 98,023 755 129,757 65,359 20,556 43,842 129,757 77,771 1982/83 43,842 59,258 22,196 81,904 733 126,479 66,059 20,221 40,199 126,479 61,916 1983/84 40,199 70,459 17,905 88,801 606 129,606 68,191 20,577 40,838 129,606 68,490 1984/85 40,838 65,302 24,591 90,362 456 131,656 72,322 21,968 37,366 131,656 68,591 1985/86 37,366 71,299 23,998 95,750 397 133,513 70,478 21,220 41,815 133,513 74,777 1986/87 41,815 52,812 26,121 79,394 262 121,471 66,982 21,202 33,287 121,471 58,416 1987/88 33,287 78,985 23,810 103,170 296 136,753 67,504 21,075 48,174 136,753 82,310 1988/89 48,174 64,934 28,901 94,165 415 142,754 71,371 21,190 50,193 142,754 73,168 1989/90 50,193 69,118 27,542 96,958 258 147,409 83,402 20,995 43,012 147,409 76,157 1990/91 43,012 72,143 27,768 100,181 331 143,524 76,163 22,265 45,096 143,524 78,131 1991/92 45,096 73,980 29,809 104,064 291 149,451 80,887 22,266 46,298 149,451 81,950 1992/93 46,298 65,234 27,455 92,959 713 139,970 77,869 21,579 40,522 139,970 71,722 1993/94 40,522 65,052 27,146 92,406 585 133,513 76,284 22,928 34,301 133,513 69,764 1994/95 34,301 68,809 28,033 97,042 1,070 132,413 68,672 22,526 41,215 132,413 74,978 1995/96 41,215 61,394 27,372 88,946 1,079 131,240 74,103 24,049 33,088 131,240 65,393 1996/97 33,088 66,452 37,236 103,786 1,091 137,965 84,509 24,361 29,095 137,965 79,780 1997/98 29,095 64,712 32,940 97,687 1,220 128,002 77,939 25,180 24,883 128,002 72,986 1998/99 24,883 74,859 34,060 108,953 1,435 135,271 85,133 25,738 24,400 135,271 83,533 1999/00 24,400 73,281 40,853 114,164 1,303 139,867 93,464 25,588 20,815 139,867 88,735 2000/01 20,815 70,362 46,820 117,217 1,488 139,520 90,847 26,303 22,370 139,520 91,069 2001/02 22,370 68,298 43,297 111,625 7,024 141,019 88,292 27,490 25,237 141,019 84,385 2002/03 39,452 85,085 41,855 126,968 87,976 254,396 93,936 112,832 47,628 254,396 99,628 2003/04 47,628 66,674 44,197 110,896 87,734 246,258 90,171 116,307 39,780 246,258 81,111 2004/05 39,780 77,898 43,668 121,591 89,163 250,534 93,313 115,792 41,429 250,534 90,673 2005/06 41,429 70,563 47,011 117,599 91,018 250,046 93,377 123,633 33,036 250,046 86,020 2006/07 33,036 83,690 49,903 133,618 97,018 263,672 104,554 123,036 36,082 263,672 101,795 2007/08 36,082 74,368 49,555 123,948 97,198 257,228 97,844 127,704 31,680 257,228 91,002 2008/09 31,680 85,152 51,062 136,239 96,931 264,850 100,442 124,596 39,812 264,850 102,026 2009/10 39,812 76,501 51,979 128,505 100,007 268,324 102,236 137,179 28,909 268,324 93,042 2010/11 28,909 86,948 53,951 140,924 105,630 275,463 113,458 133,098 28,907 275,463 104,603 2011/12 28,907 83,185 61,210 144,420 106,978 280,305 114,408 140,970 24,927 280,305 105,620 2012/13 24,927 88,818 62,440 151,283 109,072 285,282 116,012 141,373 27,897 285,282 111,710 Prior to 2002/03, the database does not include import, consumption or stocks data for non-producing countries such as the United States, EU-27 and Japan. Foreign Agricultural Service/USDA Office of Global Analysis December 2012
  • 5. Table 02 Coffee Summary Thousand 60-Kilogram Bags Jun Dec 2008/09 2009/10 2010/11 2011/12 2012/13 2012/13 Production none Brazil 53,300 44,800 54,500 49,200 55,900 55,900 Vietnam 16,980 18,500 20,000 26,000 22,400 25,000 Indonesia 10,000 10,500 9,325 8,300 9,700 9,700 Colombia 8,664 8,100 8,525 7,655 7,500 7,500 Ethiopia 5,500 6,000 6,125 6,000 6,500 6,500 Honduras 3,225 3,550 3,975 5,600 5,000 5,800 India 4,375 4,825 5,035 5,200 5,100 5,300 Peru 4,000 3,300 4,100 5,200 4,800 4,800 Mexico 4,550 4,150 4,000 5,000 4,300 4,700 Guatemala 3,980 4,010 3,810 3,860 3,850 3,850 Other 21,665 20,770 21,529 22,405 22,875 22,233 Total 136,239 128,505 140,924 144,420 147,925 151,283 Domestic Consumption none EU-27 39,575 49,505 41,725 46,190 44,500 44,800 United States 22,650 22,060 22,880 23,410 23,300 23,600 Brazil 18,030 18,760 19,420 19,980 20,760 20,690 Japan 6,915 6,780 6,860 6,975 7,050 7,050 Russia 3,190 3,805 4,190 3,700 4,900 3,900 Canada 2,865 3,170 3,375 3,345 3,600 3,450 Ethiopia 2,500 2,800 2,860 2,900 3,000 3,000 Other 28,871 30,299 31,788 34,470 34,598 34,883 Total 124,596 137,179 133,098 140,970 141,708 141,373 Ending Stocks none EU-27 16,325 10,850 12,900 10,400 12,500 10,700 United States 5,333 4,250 4,580 5,100 5,200 5,300 Brazil 6,576 2,836 2,906 2,283 2,926 4,543 Japan 2,050 1,950 2,550 2,140 2,500 2,190 Vietnam 2,307 1,012 800 950 864 1,825 Other 7,221 8,011 5,171 4,054 3,211 3,339 Total 39,812 28,909 28,907 24,927 27,201 27,897 Bean Exports none Brazil 28,396 26,580 31,810 26,556 30,630 29,600 Vietnam 15,430 18,425 18,800 23,950 20,000 22,000 Colombia 8,160 6,445 7,400 6,675 6,500 6,500 Indonesia 6,625 7,425 7,415 4,950 6,100 6,100 Honduras 3,050 3,200 3,900 5,290 4,500 5,500 Peru 3,830 3,150 3,880 5,125 4,600 4,600 India 2,125 3,040 4,160 4,200 4,000 4,100 Guatemala 3,783 3,860 3,650 3,775 3,650 3,650 Ethiopia 3,000 3,250 3,235 3,100 3,500 3,500 Uganda 3,050 2,670 3,150 3,200 3,400 3,400 Other 13,803 13,731 13,104 14,711 14,876 14,574 Total 91,252 91,776 100,504 101,532 101,756 103,524 Bean Imports none EU-27 43,350 44,200 44,260 44,100 47,000 45,500 United States 21,660 20,240 22,460 23,700 23,000 23,400 Japan 6,375 6,160 6,900 5,975 6,500 6,500 Algeria 2,045 2,060 1,770 2,200 2,000 2,300 Canada 1,940 2,010 2,305 2,180 2,300 2,300 Switzerland 1,800 1,950 2,180 2,175 2,300 2,300 Korea, South 1,680 1,705 1,930 1,725 2,100 2,000 Russia 1,240 1,430 1,540 1,720 1,900 1,900 Ecuador 310 650 820 1,150 1,400 1,400 Australia 950 1,040 1,115 1,140 1,225 1,200 Other 6,142 7,520 8,815 9,400 9,550 9,010 Total 87,492 88,965 94,095 95,465 99,275 97,810 Coffee marketing year for producer countries begins either in October (Colombia), April (Indonesia) or July (Brazil), as examples. Coffee marketing year for non-producer countries begins in October. Bean export and bean import data exclude soluble trade. Soluble trade data is in Tables 6C and 7C and total trade is in Tables 6A and 7A. Foreign Agricultural Service/USDA Office of Global Analysis December 2012
  • 6. Table 03A Coffee Production Thousand 60-Kilogram Bags Jun Dec 2008/09 2009/10 2010/11 2011/12 2012/13 2012/13 Production none Angola 30 30 25 25 30 30 Bolivia 135 140 125 140 150 150 Brazil 53,300 44,800 54,500 49,200 55,900 55,900 Burundi 250 300 235 205 225 225 Cameroon 650 590 715 765 900 800 Central African Republic 10 30 27 10 20 15 Colombia 8,664 8,100 8,525 7,655 7,500 7,500 Congo (Kinshasa) 300 305 265 255 265 265 Costa Rica 1,580 1,475 1,575 1,700 1,800 1,600 Cote d'Ivoire 1,853 2,350 1,600 1,600 1,800 1,800 Cuba 127 120 120 125 125 125 Dominican Republic 545 500 500 500 500 475 Ecuador 635 635 650 600 605 605 El Salvador 1,550 1,300 1,860 1,250 1,475 1,475 Ethiopia 5,500 6,000 6,125 6,000 6,500 6,500 Ghana 19 30 57 70 100 90 Guatemala 3,980 4,010 3,810 3,860 3,850 3,850 Guinea 400 445 325 450 425 425 Haiti 360 275 300 300 300 300 Honduras 3,225 3,550 3,975 5,600 5,000 5,800 India 4,375 4,825 5,035 5,200 5,100 5,300 Indonesia 10,000 10,500 9,325 8,300 9,700 9,700 Jamaica 31 28 23 22 20 20 Kenya 900 700 680 825 850 850 Laos 350 390 500 450 575 575 Liberia 7 2 4 5 5 5 Madagascar 530 475 550 550 575 525 Malawi 25 25 25 25 25 25 Malaysia 975 1,000 1,100 1,450 1,000 1,000 Mexico 4,550 4,150 4,000 5,000 4,300 4,700 Nicaragua 1,650 1,925 1,740 1,880 1,800 1,800 Nigeria 30 30 30 35 30 30 Panama 100 100 87 85 90 90 Papua New Guinea 1,035 1,085 865 1,400 1,150 1,150 Paraguay 25 25 25 25 25 25 Peru 4,000 3,300 4,100 5,200 4,800 4,800 Philippines 360 245 460 455 455 455 Rwanda 340 240 317 240 300 250 Sierra Leone 87 90 45 95 70 70 Sri Lanka 35 35 35 30 35 35 Tanzania 1,150 600 1,050 850 1,000 800 Thailand 800 900 900 900 900 900 Togo 185 450 615 635 650 650 Uganda 3,260 2,870 3,212 3,330 3,450 3,450 United States 133 107 100 105 100 100 Venezuela 1,000 725 625 850 880 880 Vietnam 16,980 18,500 20,000 26,000 22,400 25,000 Yemen 150 150 145 150 150 150 Zambia 39 27 7 10 10 10 Zimbabwe 22 21 10 8 10 8 Total 136,239 128,505 140,924 144,420 147,925 151,283 Coffee marketing year for producer countries begins either in October (Colombia), April (Indonesia) or July (Brazil), as examples. Coffee marketing year for non-producer countries begins in October. Foreign Agricultural Service/USDA Office of Global Analysis December 2012
  • 7. Table 03B Arabica Coffee Production Thousand 60-Kilogram Bags Jun Dec 2008/09 2009/10 2010/11 2011/12 2012/13 2012/13 Arabica Production none Bolivia 135 140 125 140 150 150 Brazil 40,500 33,000 41,800 34,700 40,200 40,200 Burundi 250 300 235 205 225 225 Cameroon 90 90 90 90 100 100 Colombia 8,664 8,100 8,525 7,655 7,500 7,500 Congo (Kinshasa) 100 105 100 90 100 100 Costa Rica 1,580 1,475 1,575 1,700 1,800 1,600 Cuba 127 120 120 125 125 125 Dominican Republic 545 500 500 500 500 475 Ecuador 360 375 400 400 415 415 El Salvador 1,550 1,300 1,860 1,250 1,475 1,475 Ethiopia 5,500 6,000 6,125 6,000 6,500 6,500 Guatemala 3,970 4,000 3,800 3,850 3,840 3,840 Haiti 360 275 300 300 300 300 Honduras 3,225 3,550 3,975 5,600 5,000 5,800 India 1,325 1,575 1,570 1,660 1,675 1,640 Indonesia 1,300 1,500 1,375 1,300 1,700 1,700 Jamaica 31 28 23 22 20 20 Kenya 900 700 680 825 850 850 Madagascar 30 25 25 25 25 25 Malawi 25 25 25 25 25 25 Mexico 4,300 3,950 3,800 4,800 4,100 4,500 Nicaragua 1,650 1,925 1,740 1,880 1,800 1,800 Panama 100 100 87 85 90 90 Papua New Guinea 1,000 1,050 825 1,350 1,100 1,100 Paraguay 25 25 25 25 25 25 Peru 4,000 3,300 4,100 5,200 4,800 4,800 Philippines 35 20 35 30 30 30 Rwanda 340 240 317 240 300 250 Tanzania 650 400 600 550 700 500 Uganda 650 818 644 630 650 650 United States 133 107 100 105 100 100 Venezuela 1,000 725 625 850 880 880 Vietnam 480 450 650 800 800 850 Yemen 150 150 145 150 150 150 Zambia 39 27 7 10 10 10 Zimbabwe 22 21 10 8 10 8 Total 85,152 76,501 86,948 83,185 88,080 88,818 Coffee marketing year for producer countries begins either in October (Colombia), April (Indonesia) or July (Brazil), as examples. Coffee marketing year for non-producer countries begins in October. Foreign Agricultural Service/USDA Office of Global Analysis December 2012
  • 8. Table 03C Robusta Coffee Production Thousand 60-Kilogram Bags Jun Dec 2008/09 2009/10 2010/11 2011/12 2012/13 2012/13 Robusta Production none Angola 30 30 25 25 30 30 Brazil 12,800 11,800 12,700 14,500 15,700 15,700 Cameroon 560 500 625 675 800 700 Central African Republic 10 30 27 10 20 15 Congo (Kinshasa) 200 200 165 165 165 165 Cote d'Ivoire 1,853 2,350 1,600 1,600 1,800 1,800 Ecuador 275 260 250 200 190 190 Ghana 19 30 57 70 100 90 Guatemala 10 10 10 10 10 10 Guinea 400 445 325 450 425 425 India 3,050 3,250 3,465 3,540 3,425 3,660 Indonesia 8,700 9,000 7,950 7,000 8,000 8,000 Laos 350 390 500 450 575 575 Liberia 7 2 4 5 5 5 Madagascar 500 450 525 525 550 500 Malaysia 975 1,000 1,100 1,450 1,000 1,000 Mexico 250 200 200 200 200 200 Nigeria 30 30 30 35 30 30 Papua New Guinea 35 35 40 50 50 50 Philippines 300 200 400 400 400 400 Sierra Leone 87 90 45 95 70 70 Sri Lanka 25 25 25 20 25 25 Tanzania 500 200 450 300 300 300 Thailand 800 900 900 900 900 900 Togo 185 450 615 635 650 650 Uganda 2,610 2,052 2,568 2,700 2,800 2,800 Vietnam 16,500 18,050 19,350 25,200 21,600 24,150 Total 51,062 51,979 53,951 61,210 59,820 62,440 Coffee marketing year for producer countries begins either in October (Colombia), April (Indonesia) or July (Brazil), as examples. Coffee marketing year for non-producer countries begins in October. Foreign Agricultural Service/USDA Office of Global Analysis December 2012
  • 9. Table 04 Coffee Consumption Thousand 60-Kilogram Bags Jun Dec 2008/09 2009/10 2010/11 2011/12 2012/13 2012/13 Domestic Consumption none Algeria 2,070 2,080 1,815 2,240 2,050 2,350 Argentina 680 740 790 740 875 775 Australia 1,225 1,330 1,390 1,450 1,550 1,525 Bolivia 80 75 75 70 75 75 Brazil 18,030 18,760 19,420 19,980 20,760 20,690 Cameroon 75 75 75 75 75 75 Canada 2,865 3,170 3,375 3,345 3,600 3,450 China 435 610 930 925 1,050 1,100 Colombia 1,065 1,180 1,120 1,300 1,200 1,300 Congo (Kinshasa) 200 200 200 200 200 190 Costa Rica 261 305 423 462 415 415 Cote d'Ivoire 300 300 300 300 108 108 Croatia 380 380 380 355 380 380 Cuba 361 333 340 340 340 340 Dominican Republic 503 464 452 450 450 435 Ecuador 167 169 205 238 223 223 El Salvador 170 180 270 270 270 270 Ethiopia 2,500 2,800 2,860 2,900 3,000 3,000 EU-27 39,575 49,505 41,725 46,190 44,500 44,800 Guatemala 325 340 350 400 375 375 Haiti 340 284 294 291 300 300 Honduras 200 200 286 265 465 260 India 1,210 1,260 938 1,195 1,045 1,065 Indonesia 1,890 1,925 1,690 2,280 2,540 2,490 Iran 185 335 245 260 275 250 Japan 6,915 6,780 6,860 6,975 7,050 7,050 Jordan 420 360 330 390 375 425 Kazakhstan 290 270 190 200 225 225 Kenya 50 50 50 50 50 50 Korea, South 1,680 1,705 1,930 1,725 2,100 2,000 Laos 100 100 100 100 100 100 Madagascar 450 450 455 450 450 440 Malaysia 525 500 470 610 600 600 Mexico 1,950 1,900 1,990 1,950 2,050 1,950 Morocco 600 580 540 700 500 700 New Zealand 280 285 270 295 280 310 Nicaragua 90 90 90 90 90 90 Nigeria 29 27 28 28 25 25 Norway 700 670 710 660 700 700 Panama 55 47 50 50 50 50 Papua New Guinea 30 30 30 40 46 46 Paraguay 35 35 34 25 20 20 Peru 150 160 170 170 170 170 Philippines 1,690 2,220 2,839 3,445 2,670 2,970 Russia 3,190 3,805 4,190 3,700 4,900 3,900 Serbia 660 595 620 745 650 750 South Africa 390 470 550 515 575 550 Sri Lanka 41 35 35 30 35 35 Switzerland 1,800 1,950 2,180 2,175 2,300 2,300 Tanzania 25 35 35 45 45 45 Thailand 616 711 795 1,040 900 1,000 Turkey 260 275 315 350 325 375 Uganda 130 140 150 150 150 150 Ukraine 1,670 1,510 1,370 1,100 1,500 1,100 United States 22,650 22,060 22,880 23,410 23,300 23,600 Venezuela 835 875 1,305 1,315 1,320 1,320 Vietnam 950 1,200 1,337 1,665 1,775 1,825 Yemen 115 120 125 130 130 130 Total 124,596 137,179 133,098 140,970 141,708 141,373 Foreign Agricultural Service/USDA Office of Global Analysis December 2012
  • 10. Table 05 Green Coffee Bean Ending Stocks Thousand 60-Kilogram Bags Jun Dec 2008/09 2009/10 2010/11 2011/12 2012/13 2012/13 Ending Stocks none Angola 20 11 5 3 2 2 Bolivia 44 35 19 4 4 4 Brazil 6,576 2,836 2,906 2,283 2,926 4,543 Burundi 18 23 15 15 5 5 Cameroon 219 44 34 24 24 24 Central African Republic 137 112 87 60 32 35 Colombia 209 284 99 249 179 284 Congo (Kinshasa) 31 34 24 10 4 10 Costa Rica 25 125 197 180 84 85 Cote d'Ivoire 88 93 408 118 100 110 EU-27 16,325 10,850 12,900 10,400 12,500 10,700 Ecuador 7 65 143 137 122 122 El Salvador 32 48 13 14 25 30 Ethiopia 120 70 100 100 100 100 Ghana 5 4 3 2 6 6 Guatemala 229 239 199 59 159 34 Guinea 12 7 2 12 22 22 Haiti 44 25 25 25 15 15 Honduras 50 218 30 90 105 145 India 2,523 2,578 2,000 1,100 425 580 Indonesia 1,208 1,603 83 88 148 148 Japan 2,050 1,950 2,550 2,140 2,500 2,190 Kenya 140 50 30 25 35 25 Madagascar 37 22 12 12 12 12 Mexico 109 124 89 104 129 124 Nicaragua 8 37 22 32 17 17 Norway 125 125 125 125 125 125 Papua New Guinea 21 36 21 31 35 35 Paraguay 39 24 10 5 5 5 Peru 84 74 124 29 84 59 Philippines 124 469 90 165 150 150 Switzerland 200 200 200 200 200 200 Tanzania 280 40 50 100 150 100 Thailand 42 92 60 63 55 73 Togo 1 9 7 7 7 7 Uganda 641 701 613 593 493 493 United States 5,333 4,250 4,580 5,100 5,200 5,300 Venezuela 349 390 232 273 153 153 Vietnam 2,307 1,012 800 950 864 1,825 Total 39,812 28,909 28,907 24,927 27,201 27,897 Coffee marketing year for producer countries begins either in October (Colombia), April (Indonesia) or July (Brazil), as examples. Coffee marketing year for non-producer countries begins in October. Foreign Agricultural Service/USDA Office of Global Analysis December 2012
  • 11. Table 06A Total Coffee Exports Thousand 60-Kilogram Bags Jun Dec 2008/09 2009/10 2010/11 2011/12 2012/13 2012/13 Exports none Angola 4 8 5 8 7 7 Bolivia 73 74 66 85 75 75 Brazil 31,475 29,780 35,010 29,843 34,000 32,950 Burundi 250 290 235 200 230 230 Cameroon 480 690 650 700 825 725 Central African Republic 6 25 22 7 15 10 Colombia 8,935 7,435 8,385 7,310 7,300 7,125 Congo (Kinshasa) 117 102 75 69 75 75 Costa Rica 1,385 1,200 1,255 1,330 1,600 1,400 Cote d'Ivoire 1,555 2,045 985 1,590 1,700 1,700 Cuba 6 7 5 10 10 10 Dominican Republic 42 36 48 50 50 40 Ecuador 861 1,140 1,250 1,521 1,800 1,800 El Salvador 1,510 1,240 1,772 1,173 1,403 1,403 Ethiopia 3,000 3,250 3,235 3,100 3,500 3,500 EU-27 225 170 485 410 500 400 Ghana 18 30 57 70 95 85 Guatemala 3,783 3,860 3,650 3,775 3,650 3,650 Guinea 375 410 300 400 375 375 Haiti 17 10 6 9 10 10 Honduras 3,050 3,200 3,900 5,290 4,500 5,500 India 2,415 3,590 4,890 5,005 5,400 4,805 Indonesia 7,700 8,750 9,720 7,450 8,100 8,100 Jamaica 26 23 18 17 15 15 Kenya 980 740 650 780 800 800 Laos 250 290 400 350 475 475 Liberia 7 2 4 5 5 5 Madagascar 115 40 105 100 125 85 Malawi 25 24 24 24 24 24 Malaysia 1,100 1,460 1,675 1,900 1,900 1,600 Mexico 2,735 2,480 2,460 3,315 2,500 3,000 Nicaragua 1,585 1,806 1,665 1,780 1,725 1,725 Nigeria 1 3 2 7 5 5 Panama 45 53 37 35 40 40 Papua New Guinea 1,070 1,040 850 1,350 1,100 1,100 Paraguay 5 5 5 5 5 5 Peru 3,830 3,150 3,880 5,125 4,600 4,600 Rwanda 340 240 317 240 300 250 Sierra Leone 70 70 25 75 50 50 Tanzania 1,205 805 1,005 755 955 755 Thailand 644 684 1,207 767 850 840 Togo 185 440 615 635 650 650 Uganda 3,050 2,670 3,150 3,200 3,400 3,400 Venezuela 235 125 100 100 80 80 Vietnam 15,565 18,670 19,225 24,405 20,450 22,500 Yemen 35 30 20 20 20 20 Zambia 39 27 7 10 10 10 Zimbabwe 18 17 6 3 5 3 Total 100,442 102,236 113,458 114,408 115,309 116,012 A conversion factor of 2.6 was used to convert soluble coffee to the green bean equivalent. Coffee marketing year for producer countries begins either in October (Colombia), April (Indonesia) or July (Brazil), as examples. Coffee marketing year for non-producer countries begins in October. For each non-producing country, the balance between imports and exports was used in order to remove double-counting from these trade figures. Foreign Agricultural Service/USDA Office of Global Analysis December 2012
  • 12. Table 06B Green Coffee Bean Exports Thousand 60-Kilogram Bags Jun Dec 2008/09 2009/10 2010/11 2011/12 2012/13 2012/13 Bean Exports none Angola 4 8 5 8 7 7 Bolivia 73 74 66 85 75 75 Brazil 28,396 26,580 31,810 26,556 30,630 29,600 Burundi 250 290 235 200 230 230 Cameroon 480 690 650 700 825 725 Central African Republic 6 25 22 7 15 10 Colombia 8,160 6,445 7,400 6,675 6,500 6,500 Congo (Kinshasa) 117 102 75 69 75 75 Costa Rica 1,385 1,200 1,255 1,330 1,600 1,400 Cote d'Ivoire 1,180 1,755 725 1,290 1,400 1,400 Cuba 6 7 5 10 10 10 Dominican Republic 42 36 48 50 50 40 Ecuador 179 450 425 575 600 525 El Salvador 1,506 1,236 1,770 1,170 1,400 1,400 Ethiopia 3,000 3,250 3,235 3,100 3,500 3,500 Ghana 18 30 57 70 95 85 Guatemala 3,783 3,860 3,650 3,775 3,650 3,650 Guinea 375 410 300 400 375 375 Haiti 17 10 6 9 10 10 Honduras 3,050 3,200 3,900 5,290 4,500 5,500 India 2,125 3,040 4,160 4,200 4,000 4,100 Indonesia 6,625 7,425 7,415 4,950 6,100 6,100 Jamaica 26 23 18 17 15 15 Kenya 980 740 650 780 800 800 Laos 250 290 400 350 475 475 Liberia 7 2 4 5 5 5 Madagascar 115 40 105 100 125 85 Malawi 25 24 24 24 24 24 Mexico 2,125 1,790 1,735 2,525 1,800 2,200 Nicaragua 1,425 1,650 1,525 1,675 1,600 1,600 Nigeria 1 3 2 7 5 5 Panama 45 53 37 35 40 40 Papua New Guinea 1,070 1,040 850 1,350 1,100 1,100 Paraguay 5 5 5 5 5 5 Peru 3,830 3,150 3,880 5,125 4,600 4,600 Rwanda 340 240 317 240 300 250 Sierra Leone 70 70 25 75 50 50 Tanzania 1,200 800 1,000 750 950 750 Thailand 4 4 15 32 50 40 Togo 185 440 615 635 650 650 Uganda 3,050 2,670 3,150 3,200 3,400 3,400 Venezuela 200 120 100 100 80 80 Vietnam 15,430 18,425 18,800 23,950 20,000 22,000 Yemen 35 30 20 20 20 20 Zambia 39 27 7 10 10 10 Zimbabwe 18 17 6 3 5 3 Total 91,252 91,776 100,504 101,532 101,756 103,524 Coffee marketing year for producer countries begins either in October (Colombia), April (Indonesia) or July (Brazil), as examples. Coffee marketing year for non-producer countries begins in October. For each non-producing country, the balance between imports and exports was used in order to remove double-counting from these trade figures. Foreign Agricultural Service/USDA Office of Global Analysis December 2012
  • 13. Table 06C Soluble Coffee Exports Thousand 60-Kilogram Bags Jun Dec 2008/09 2009/10 2010/11 2011/12 2012/13 2012/13 Soluble Exports none Brazil 2,991 3,120 3,140 3,236 3,300 3,300 Colombia 725 925 935 610 775 600 Cote d'Ivoire 375 290 260 300 300 300 Ecuador 680 680 825 946 1,200 1,275 EU-27 225 170 485 410 500 400 India 290 550 725 800 1,400 700 Indonesia 1,075 1,325 2,305 2,500 2,000 2,000 Malaysia 1,100 1,460 1,675 1,900 1,900 1,600 Mexico 610 690 725 790 700 800 Nicaragua 160 156 140 105 125 125 Thailand 640 680 1,192 735 800 800 Vietnam 110 195 340 360 400 400 Total 8,986 10,246 12,752 12,697 13,405 12,305 A conversion factor of 2.6 was used to convert soluble coffee to the green bean equivalent. Coffee marketing year for producer countries begins either in October (Colombia), April (Indonesia) or July (Brazil), as examples. Coffee marketing year for non-producer countries begins in October. For each non-producing country, the balance between imports and exports was used in order to remove double-counting from these trade figures. Foreign Agricultural Service/USDA Office of Global Analysis December 2012
  • 14. Table 07A Total Coffee Imports Thousand 60-Kilogram Bags Jun Dec 2008/09 2009/10 2010/11 2011/12 2012/13 2012/13 Imports none Algeria 2,070 2,080 1,815 2,240 2,050 2,350 Argentina 680 740 790 740 875 775 Australia 1,225 1,330 1,390 1,450 1,550 1,525 Canada 2,865 3,170 3,375 3,345 3,600 3,450 China 435 610 930 925 1,050 1,100 Colombia 660 590 795 1,105 1,040 960 Costa Rica 15 130 175 75 120 120 Croatia 380 380 380 355 380 380 Cuba 240 220 225 225 225 225 Ecuador 389 732 883 1,153 1,403 1,403 El Salvador 157 136 147 194 214 214 EU-27 43,350 44,200 44,260 44,100 47,000 45,500 Guatemala 188 200 150 175 150 150 Honduras 18 18 23 15 15 15 India 0 80 215 100 770 50 Indonesia 290 570 565 1,435 1,000 950 Iran 185 335 245 260 275 250 Japan 7,005 6,680 7,460 6,565 7,150 7,100 Jordan 420 360 330 390 375 425 Kazakhstan 290 270 190 200 225 225 Korea, South 1,680 1,705 1,930 1,725 2,100 2,000 Malaysia 650 960 1,045 1,060 1,500 1,200 Mexico 114 245 415 280 270 270 Morocco 600 580 540 700 500 700 New Zealand 280 285 270 295 280 310 Norway 700 670 710 660 700 700 Philippines 1,325 2,320 2,000 3,065 2,200 2,500 Russia 3,190 3,805 4,190 3,700 4,900 3,900 Serbia 660 595 620 745 650 750 South Africa 390 470 550 515 575 550 Switzerland 1,800 1,950 2,180 2,175 2,300 2,300 Thailand 400 545 1,070 910 850 950 Turkey 260 275 315 350 325 375 Ukraine 1,670 1,510 1,370 1,100 1,500 1,100 United States 22,250 20,870 23,110 23,825 23,500 23,700 Venezuela 5 316 622 606 400 400 Vietnam 95 75 350 220 175 200 Total 96,931 100,007 105,630 106,978 112,192 109,072 A conversion factor of 2.6 was used to convert soluble coffee to the green bean equivalent. Coffee marketing year for producer countries begins either in October (Colombia), April (Indonesia) or July (Brazil), as examples. Coffee marketing year for non-producer countries begins in October. For each non-producing country, the balance between imports and exports was used in order to remove double-counting from these trade figures. Foreign Agricultural Service/USDA Office of Global Analysis December 2012