Apidays New York 2024 - APIs in 2030: The Risk of Technological Sleepwalk by ...
Artifact 3 clemson
1. Jimmy Clemson
Dr. Adu-Gyamfi
MATE 4001
12/3/13
Artifact 3
In this artifact we will explore quadratics and how they act as coefficients a,b, and c change. We
will also what different quadratics will look like given a certain parameter and how they can change
while still fulfilling that parameter.
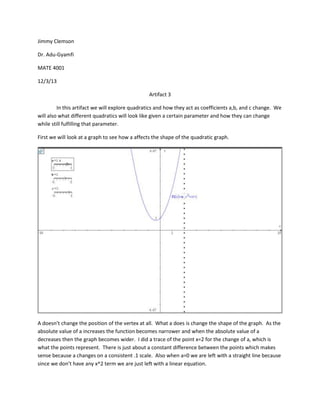
First we will look at a graph to see how a affects the shape of the quadratic graph.
A doesn’t change the position of the vertex at all. What a does is change the shape of the graph. As the
absolute value of a increases the function becomes narrower and when the absolute value of a
decreases then the graph becomes wider. I did a trace of the point x=2 for the change of a, which is
what the points represent. There is just about a constant difference between the points which makes
sense because a changes on a consistent .1 scale. Also when a=0 we are left with a straight line because
since we don’t have any x^2 term we are just left with a linear equation.
2. Now let’s take a look at how the graph changes when b is variable.
The coefficient b does not change the shape of the function at all. The b changes where the vertex is
located on the graph. After doing a trace on the vertex of the equation, I noticed that the vertex varies
based off of the mirror of the original equation. The function at its highest vertex is
and the
function of the varying vertex is
.
3. Now let’s take a look at how varying c changes the graph.
Once again c has no effect on the shape of the function. C also has no effect on the x value of the
vertex. I did a trace on the y intercepts of the different graphs and since the step of the c slider is 1, the
steps of the y intercepts are 1. Also if you notice the y-value of the vertex varies the same way the yintercepts do.
4. From here we will look to see if what it looks like when only a is changing again but in a different format.
The input here for the function was
. As a
changes and b and c do not the shape of the function changes. Each graph has a common point at (0,3)
since because that is the y intercept/ c value. In the same manner as stated above, when the absolute
value a increases the graph becomes narrower and vice versa. The graph also shifts based on the a
value. The more positive the a value the farther left and down the vertex becomes and the more
negative the a value becomes the higher and more to the right the vertex is.
5. Now let’s look at what happens again at what happens when the b value is changing.
The function that was inputed was this.
The change in b had no change on the shape of the graph but it did change the location of the vertex.
Once again the change in the vertex followed the opposite graph of when b=0, so the vertex moved
along the line
which is pretty neat. When b=0 you get the function
,
which has a vertex along the y axis. Each of these graphs also has one point in common which is the yintercept at (0,-1) since they all have the same c value.
6. Let’s do the same for c.
This is the graph of
. For each of the graphs they
have the same basic shape and all of their vertices are at the same x-value. The only difference between
them was that they are vertically shifted. When c=0 the y intercept is at 0 and like wise for every other c
value. There are no common points between any of these graphs. They will approach each other to
infinity but they will never intersect.
7. The next example to explore is one where the roots are 3 and 5 for every equation. Here is the graph of
Each of these graphs has roots at 3 and 5. They all have x intercepts at 3 and 5 but they each have
different y-intercepts, which makes sense because when a varies each graph is going to have a y
intercept of a*3*5 so each should have a different y intercept. Looking at these graphs, the only time
any of them intersect is at the roots. Nowhere else on the graph do they intersect. Another odd thing
to look at is the case when a=0. Since a times anything is 0 we just get the line y=0 which of course has
roots 3 and 5 because every number is a root of y=0. Look at the vertices of the graphs. They are all
lined up in a straight vertical line. It looks as though when graphs have the same roots that they also
share an axis of symmetry (common x-value of the vertex). The a value significantly determined the
vertex point (at least the y-value of the vertex). Take when a=-7. This graph is going to be a very narrow
parabola facing downward. Thus in order to have roots at 3 and 5 the vertex needed to be significantly
above the x-axis in order to keep its narrow and downward shape. The vertex gradually gets closer to 0
as the a values get closer to 0. Once the a value is positive, the vertices are all below the x-axis now.
The parabolas with positive a values are upward facing and thus to have roots that exist must have a
vertex at or below the x-axis.
8. IDP TPACK TEMPLATE (INSTRUCTIONAL DESIGN PROJECT TEMPLATE)
NAME: ___Mr Clemson_____ DATE:____12/3/12_____
Describe: content here.
Content.
(COMMON CORE STANDARDS)
CCSS.Math.Content.HSF-IF.C.7 Graph functions expressed symbolically
and show key features of the graph, by hand in simple cases and using
technology for more complicated cases.★
Describe:Standards of mathematical Practice
2. Reason abstractly and quantitatively.
3. Construct viable arguments and critique the reasoning of others.
5. Use appropriate tools strategically
1. 6. Attend to precision.
1. 8. Look for and express regularity in repeated reasoning.
Pedagogy.
Pedagogy includes
both what the teacher does and what
the student does. It includes where,
what, and how learning takes place. It
is about what works best for a
particular content with the needs of the
learner.
1. Describe instructional strategy (method) appropriate for the content, the learning
environment, and students. This is what the teacher will plan and implement.
This will be an exploratory lesson. I will go over the basic topics like, standard
form of an equation basic techniques that will be used in the lesson on TI-Inspire.
From there I will have a worksheet to guide the students along the lesson.
Walk around the class during the children’s investigation and ask any pertinent
information.
2. Describe what learner will be able to do, say, write, calculate, or solve as the
learning objective. This is what the student does.
The student will explore changes in the quadratic equation based on the changing
coefficients first using sliders and secondly using multiple graphs on the same page
in order to gain an understanding of each coefficients effect on the graph.
3. Describe how creative thinking--or, critical thinking, --or innovative problem
solving is reflected in the content.
Critical thinking is important in this lesson because the sliders will help show what
the effects of each coefficient but it will not explicitly tell the student. The student
still has to figure out what is actually going on with the graphs and interpret them.
9. Technology.
1. Describe the technology
TI-Inspire is a computer software that combine many elements of math in
order to show an in-depth view (in this case) the relationship between algebraic
and graphical representations of quadratic functions.
2.
Describe how the technology enhances the lesson, transforms
content, and/or supports pedagogy.
The technology in this lesson allows the students to play with different coefficient
values very simply. They can very easily manipulate coefficient value and instantly
see what that change has made to the graph as opposed to having to graph each
individual change in the graph. The students can much more easily make and test
conjectures about certain parts of the function. The geometry trace function in TIInspire is also really cool because it will trace a certain point on the graph and leave
the point on the graph so students can see how certain points are transformed.
3. Describe how the technology affects student’s thinking processes.
By tracing the vertex of the parabola’s the students should be able to make a
conjecture about how each of the coefficients transforms the parabola. When
they see the graphs all overlaid on each other will cement to the students how
that happens.
Reflect—how did the lesson
activity fit the content? How did the
technology enhance both the content
and the lesson activity?
Reflection
The lesson fit the content fairly well. Based on the standards, the students aren’t
necessarily picking out different pieces of the graph but they are using those pieces
to create an understanding of the transformations of the quadratic. The technology
10. made it feasible to put a slew of graphs on one page and be able to look at them and
pick out what the differences truly were in order to figure out the effects on the
graph.
Lesson Plan Template MATE 4001 (2013)
Title:Transformations on Quadratics
Subject Area: Math 2
Grade Level: Secondary
Concept/Topic to teach: Transformation on Quadratics in standard form
Learning Objectives:
Content objectives (students will be able to……….)
Know each coefficients effect on the graph and how they interact.
Essential Question
What question should student be able to answer as a result of completing this lesson?
What are the effects of a,b,and c on the quadratic equation and its graph?
Standards addressed:
Common Core State Mathematics Standards:
CCSS.Math.Content.HSF-IF.C.7 Graph functions expressed symbolically and show key features of the
graph, by hand in simple cases and using technology for more complicated cases. ★
Common Core State Mathematical Practice Standards:
11. 2. Reason abstractly and quantitatively.
3. Construct viable arguments and critique the reasoning of others.
5. Use appropriate tools strategically
6. Attend to precision.
8. Look for and express regularity in repeated reasoning.
Technology Standards:
HS.TT.1.1
Use appropriate technology tools and other resources to access information
(multi-database search engines, online primary resources, virtual interviews
with content experts).
HS.TT.1.2
Use appropriate technology tools and other resources to organize information
(e.g. online note-taking tools, collaborative wikis).
Required Materials:
List all materials needed for your lesson
Computers
Paper /Pencil
Projector
Notes to the reader:
Students already have a basic knowledge of basic parts of the quadratic function, TI-Inspire.
Time: Assume 60 minutes ***
Time
Teacher Actions
Student Engagement
I. Focus and
Review
(Establish
prior
knowledge)
Review basic part of parabola. Draw a
parabola and have students call out
parts of the graph they remember.
Call out the parts of the parabola.
II. Statement
(Inform
Students will use TI-Inspire to look at
12. student of
objectives)
the quadratic function.
III. Teacher
Input
(Present
tasks,
information,
and
guidance)
I would have a worksheet that would
take them through what is expected of
them this lesson. The first problem
would have the students looking at
the change in a. From a technology
standpoint I would teach them how to
make sliders and the different
intricacies of why theirs might not be
working at the time. Also teach them
how to do geometry traces. I would
also walk through the exploration of a
so that the students know what is
expected of them during the rest of
the exploration.
Pick up the techniques that will be
needed to complete the requirements
in TI-Inspire. Follow along on their
own computers and record
observations on the effects of a on the
graph and talk about their conjectures.
IV. Guided
Practice
(Elicit
performance,
provide
assessment
and
feedback)
Circulate and ask questions where
necessary.
The students will then have to move
on to b,c with the sliders. Then the
students will overlay graphs with only
a changing and likewise for b and c
and record their observations about
each.
V.
Independent
Practice -Seatwork
and
Homework
(Retention
and transfer)
Circulate and ask questions where
necessary. Provide assistance if
necessary for students to be able to
create 10 equations in a timely
manner.
Students will create 10 equations that
have the roots 3 and 5 and overlay
them on one graph and see the
changes that occur in those graphs
and their similarities.
VI. Closure
When a/b/c change what happens to
(Plan for
the graph?
maintenance)
Are there any common points to the
graphs?
Present findings in a whole class
discussion.
13. What is the significance when
a/b/c=0?
When all equations have roots of 3
and 5:
What do you notice about the
roots of all 15 graphs
What do you notice about the
Intercepts of these graphs
What do you notice about their
Intersection points
What do you notice about the
Orientation or Position of the
graphs
Do they have Common points?
What can you say about their
common points
What do you notice about the
correlation between the
orientation of the graphs and
the Sign or coefficient of the
x^2 term?
What do you notice about the
Locus of the vertex of each of
these graphs?
*** Your lesson plan should ALL be included here (the reader shouldn’t have to go anywhere else to find
the plans.) The teacher should be able to read it chronologically. The only things to be included at the
end of the plan are supplemental artifacts (e.g. handouts, tech files, ppt). If you chose not to use the
table then the time, teacher actions and student actions should be clearly noted throughout your plan.
Make sure that your lesson is detailed enough that someone else could teach from it. This is
especially important during class discussion phases. For example, be sure to detail what the
teacher should be sure to bring out in a whole class discussion, including questions to push
students to build conceptual understanding, questions to assess student understanding, and
transitions between portions of your lesson.
If students are working in pairs / small groups this should be noted (including how the groups
are to be determined)
All tasks / examples should be worked out and included in the body of the lesson plan
All HW should be worked out
14. Reflection
The TI-Inspire is really cool in the fact that you can do that geometry trace. I had no idea before
this exploration that the b value changed the vertex along a parabola with the opposite a value. That is
really neat and that is something I hope the students would pick up on, though that one might be harder
for them to do in only a 60 minute period. The technology also really helps with being able to input lots
of graphs simultaneously in a very timely manner, without this it would probably take most of the period
to do one or maybe two of the simultaneous graphs which would turn this lesson into a multiple day
lesson. By being able to see all the graphs on one page and be able to use the slider I think the students
will gain a better and deeper understanding of the concept.