State Energy Efficiency Standards
•Download as KEY, PDF•
0 likes•90 views

Description of state requirements.

Recommended
Recommended
More Related Content
What's hot
What's hot (20)
Similar to State Energy Efficiency Standards
Similar to State Energy Efficiency Standards (20)
More from Honolulu Civil Beat
More from Honolulu Civil Beat (20)
Recently uploaded
Recently uploaded (20)
State Energy Efficiency Standards
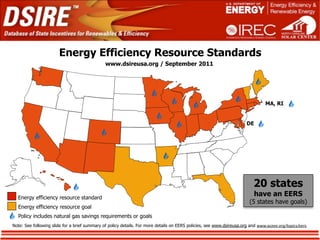
- 1. Energy Efficiency Resource Standards www.dsireusa.org / September 2011 MA, RI DE 20 states Energy efficiency resource standard have an EERS (5 states have goals) Energy efficiency resource goal Policy includes natural gas savings requirements or goals Note: See following slide for a brief summary of policy details. For more details on EERS policies, see www.dsireusa.org and www.aceee.org/topics/eers.
- 2. EERS Policy Details AZ: 22% cumula)ve electricity savings by 2020 IA: 1.5% electricity sales reduc)on by 2013; 1.5% OH: 22.0% reduc)on of previous 3‐year AR: 0.75% of 2010 electric sales reduc)on by 2013; 0.4% natural gas sales reduc)on by 2013 average retail electricity sales by 2025; 7.0% of 2010 gas sales reduc)on by 2013 ME: 30% reduc)on of electricity and natural gas reduc)on of previous 3‐year average peak sales by 2020 demand by 2017 CA: Varies by u)lity PA: 3% of projected June 2009 ‐ May 2010 CO: Electricity sales and demand reduc)on of 5% of 2006 MD: 15% reduc)on in per capita energy electricity consump)on by May 31, 2013; numbers by 2018 (statutory requirement); natural gas consump)on by 2015, compared to 2007; 15% 4.5% of measured June 2007 ‐ May 2008 savings requirements vary by u)lity reduc)on in per capital peak demand by 2015, compared to 2007 peak demand by May 31, 2013 CT: 4% of retail load (includes CHP and waste heat RI: Varies by u)lity recovery) MA: Reduce 1,103 GWh electricity in 2012 (statewide); reduce 24.7 million therms by 2012 TX: 25% reduc)on in annual growth in DE: Electricity and peak demand savings equivalent to (statewide) demand 2012; 30% reduc)on in annual 15% of 2007 numbers by 2015; natural gas savings growth in demand 2013 equivalent to 10% of 2007 natural gas consump)on by MI: 1.0% annual reduc)on of previous year retail 2015 electricity sales by 2012; 0.75% annual reduc)on VT: 360,000 MWh electricity savings (3‐year of previous year retail natural gas sales by 2012 goal for 2009, 2010, 2011); summer peak FL: 7,842 GWh cumula)ve reduc)ons from 2010‐2019 (statewide goal); 3,024 MW cumula)ve summer peak MN: 1.5% reduc)on of previous 3‐year average kW savings: 51,200 (3‐year goal for 2009, demand reduc)on from 2010‐2019, 1,937 MW, retail electric sales by 2010; 1.5% reduc)on of 2010, 2011), winter peak kW savings: cumula)ve winter peak demand reduc)on from previous 3‐year average retail natural gas sales by 54,000 (3‐year goal for 2009, 2010, 2011) 2010‐2019 (statewide goal) 2010 WA: Varies by u)lity HI: 4,300 GWh reduc)on in electricity use by 2030 NM: 10% of 2005 total retail kWh sales by 2020 WI: 1.5% electricity savings by 2014; 1.5% peak demand reduc)on by 2014; 1.0% IL: 2.0% reduc)on of 2008 electricity sales by 2015; 1.1% NY: 15% reduc)on rela)ve to projected electricity reduc)on of 2008 peak load demand by 2018; 8.6% use in 2015; gas savings of 112 Bcf annually by natural gas savings by 2014 cumula)ve natural gas savings by 2020 2020 IN: 2.0% electricity sales reduc)on by 2019 Note: For more details on EERS policies, see www.dsireusa.org and www.aceee.org/topics/eers.
Editor's Notes
- \n
- \n