
Recommended
More Related Content
Viewers also liked
Viewers also liked (20)
More from christjt
More from christjt (20)
Recently uploaded
Recently uploaded (20)
Ch. 8 Review
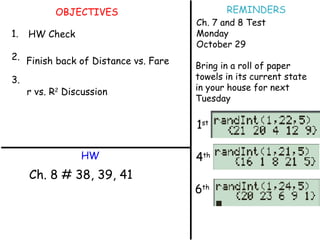
- 1. OBJECTIVES 1. 2. 3. HW REMINDERS HW Check Finish back of Distance vs. Fare Bring in a roll of paper towels in its current state in your house for next Tuesday Ch. 7 and 8 Test Monday October 29 Ch. 8 # 38, 39, 41 r vs. R 2 Discussion 1 st 4 th 6 th
- 2. RESIDUAL = ACTUAL - PREDICTED
- 3. r
- 4. What % of variation in Y is still in the residuals? Var( Y ) = Var( res ) = Distance vs. Fare What % of variation in Y is in the model? Y = Fare r = Residuals (as data) = S res =