SlideShare a Scribd company logo
1 of 11
Download to read offline
IPO Update
IPO UPDATE
Robust Business Model but Overpriced
Interglobe Aviation Ltd. (IAL) operates India’s largest passenger airline
under the brand “Indigo” and in terms of domestic passenger volume, it
had a market share of 36.5% Q2 FY16. The company operates under a
LCC business model with primary focus on the domestic Indian air travel
market.
IAL is coming with an initial public offering (IPO) of ~39.5mn shares in
offering to raise around Rs. 30,182mn, with subscription starting from
27th Oct. 2015. The issue will close on 29th Oct. 2015.
• Not more than 50% of the issue will be allocated to qualified
institutional buyers (QIBs). Further, not less than 15% of the issue
will be available for non-institutional bidders and the remaining 35%
for retail investors.
Net proceed from the issue will be used for following purpose:
• Retirement of outstanding debt related to the acquisition of aircrafts
(Rs. 11,656.6mn)
• Purchase of ground support equipment for airline operations (Rs.
342.6mn)
Valuation & Recommendation:
On profitability front, IAL’s EBITDA (13.4%) and PAT (9.3%) margins are
significantly lower than the peers average of 18.9% and 9%,
respectively. On valuation front, the company is available at significant
premium to its peers. The company is available at P/E, P/S and
EV/EBITDA of 21.3x, 2.1x and 15.3x, respectively, which are significantly
premium to its peers. Based on below parameters, we recommend
investors to “Avoid” the issue.
• Premium valuation
• Competitive advantage of the company, reflected in the issue price
• Hard to sustain a dominant market share
• Promoters already taken out around over Rs. 28bn as dividend in last
five years
• Uncertainty on future dividend policy
1
Oct. 27, 2015
Recommendation AVOID
Price Band Rs. 700 - Rs. 765
Total Issue Size Rs. 30,182.4mn
Fresh Issue Rs. 12,722mn
OFS Issue Rs. 17,460.4
Bidding Date 27th Oct. – 29th Oct. 2015
Book Running Lead
Manager
Citigroup Global Markets India Pvt.
Ltd., J.P. Morgan India Pvt. Ltd.,
Morgan Stanley India Company Pvt.
Ltd., Barclays Bank PLC, Kotak
Mahindra Capital Company Ltd. and
UBS Securities India Pvt. Ltd.
Registrar Karvy Computershare Pvt. Ltd.
Sector/Industry Airlines
Promoters
Mr. Rahul Bhatia, Mr. Rakesh
Gangwal, Acquire Services Pvt. Ltd.
and Interglobe Enterprises Ltd.
Shareholding Pattern
Pre-Issue Post-Issue
Promoters 94% 86.1%
Institutions 0% 0%%
Non-Institution 6% 13.9%
Total 100% 100%
Retail Application Money at Higher Cut-Off Price per Lot
Number of Shares per Lot 15
Application Money Rs. 11,475
Discount to Retail Investors 0%
Cheque Payable to “IGAL – Escrow – R”
Rajnath Yadav
Equity Research Analyst (022 - 6707 9999; Ext: 975)
Email: rajnath.yadav@choiceindia.com
Interglobe Aviation Ltd.
* Represents per share calculation based on number of shares o/s post issue; Source: Choice Broking Research, Company DRHP
FY11 FY12 FY13 FY14 FY15 Q1 FY16
Total Operating Revenue 38,334.2 55,646.6 92,031.3 111,165.8 139,253.4 42,115.4
Total Operating Expenditure (31,215.5) (55,157.7) (83,095.0) (106,099.5) (120,556.5) (32,391.3)
EBITDA 7,118.7 488.9 8,936.3 5,066.3 18,696.9 9,724.1
Depreciation Charge (628.7) (665.2) (856.2) (2,260.1) (3,022.1) (1,199.7)
Finance Cost (449.9) (514.3) (578.0) (1,225.8) (1,155.3) (328.4)
Finance Income 727.1 1,207.0 2,006.4 2,863.5 3,739.7 1,029.6
Other Income 380.3 232.6 364.7 291.8 98.4 26.9
Reported PAT 5,794.7 1,405.9 7,833.6 4,744.4 12,955.9 6,404.4
Restated EPS (Rs.) 16.1 3.9 21.7 13.2 36.0 17.8
Restated BVPS (Rs.) 2.9 6.8 10.8 11.7 11.8 (3.9)
EBITDA margin (%) 18.6% 0.9% 9.7% 4.6% 13.4% 23.1%
Reported PAT Margin (%) 15.1% 2.5% 8.5% 4.3% 9.3% 15.2%
RoE (%) 564.0% 81.3% 247.7% 117.0% 305.6% 446.6%
RoCE (%) 42.0% -0.9% 25.2% 5.4% 22.3% 11.3%
IPO Update
IPO UPDATE 2
Indian Air Travel Market Overview:
According to a report from Center for Asia Pacific Aviation India Pvt. Ltd. (CAPA), India is one of the world’s largest and
fastest-growing air travel markets. Historically, the Indian air travel market was comprised of individuals in relatively high
income brackets as well as corporate travellers. But since the liberalization in the air travel market, a number of low cost
carriers (LCC) have entered the market and stimulated prices through their low-cost business models. In the decade that
followed, Indian air travel entered a period of considerable growth registering a growth of 19.4% CAGR over FY04-10. By
CY14, India’s air travel market had become the sixth largest in the world as measured by total domestic seats (97.3mn) and
ninth largest in the world by total domestic and international seats (155.9mn). Going forward, the Indian air travel market is
expected to enter a period of accelerated growth and between FY15 and FY20, domestic available seat kilometer (ASK) are
forecast to grow at a CAGR of 12.7%, while domestic passenger volume is forecast to grow at a CAGR of 12.8% (Source:
Company DRHP).
According to the CAPA report, the period of accelerated growth is expected to be driven by numerous factors, which
includes:
• Strong economic growth
• Continued population growth
• Expansion of the middle class
• Strong growth in tourism
• Rail travel substitution
• Increasing aircraft penetration from currently low penetration levels
• Expansion in aviation infrastructure and
• An increasingly favorable regulatory environment
Source: Choice Broking Research, Company DRHP Source: Choice Broking Research, Company DRHP
Domestic Available Seat Kilometers Forecast (bn) Domestic Passengers Forecast (mn)
84.9
92.8
103.4
119.7
138.0
154.4
80
100
120
140
160
FY15 FY16E FY17E FY18E FY19E FY20E
70.0
81.0
92.0
103.0
115.0
128.0
60
70
80
90
100
110
120
130
FY15 FY16E FY17E FY18E FY19E FY20E
Oct. 27, 2015
Interglobe Aviation Ltd.
IPO Update
IPO UPDATE 3
Company Introduction:
Interglobe Aviation Ltd. (IAL) operates India’s largest passenger airline under the brand “Indigo” and in terms of domestic
passenger volume, it had a market share of 39.8% and 36.5% in Q1 FY16 and Q2 FY16, respectively. The company operates
under a LCC business model with primary focus on the domestic Indian air travel market. IAL aims to maintain its cost
advantage and high frequency of flights while striving to fulfil its simple brand message of providing “low fares, on-time
flights and a hassle-free experience” to its passengers. The company enjoyed the position of being the 7th largest LCC
globally in terms of seat capacity for FY15 as per CAPA.
IAL began its operations in August 2006 with a single aircraft and over the period till 31 Aug. 2015, it has expanded to 97
aircrafts all of which are Airbus A320’s. The company currently has an order book of 430 A320neo aircrafts, of which it
expects to take delivery of 9 of these by the end of FY16. As on 31 Aug. 2015, the average age of its fleet was 3.7 years,
which according to CAPA is the second youngest average fleet age in India and one of the youngest LCC fleet globally. As on
31 Aug. 2015, IAL operated its scheduled services from 33 airports in India, with a maximum of 603 domestic flights per day.
The company enjoyed the highest market share in each of the top five domestic routes in India by traffic in FY15 as well as
operated the most passenger flights during the FY15 winter season in India according to CAPA. With prime focus on Indian
domestic air market, IAL reported a domestic passenger volume of 23.7mn in FY15 as against 9.5mn in FY11, representing a
growth of 25.8% CAGR over FY11-15. During the same period, the domestic passenger volume market share also increased
from 17.6% in FY11 to 33.9% in FY15. As per the Directorate General of Civil Aviation (DGCA), the company had the second
highest load factor on domestic scheduled services and also received the second lowest level of complaints per 10000
passengers in FY15.
Source: Choice Broking Research, Company DRHP Source: Choice Broking Research, Company DRHP
IAL's Domestic Passenger Volume (mn) IAL's Domestic Passenger Volume Market Share (%)
9.5
12.3
15.7
18.1
23.7
7.8
6
9
12
15
18
21
24
FY11 FY12 FY13 FY14 FY15 Q1 FY16
17.6%
20.3%
27.3%
29.8%
33.9%
39.8%
36.5%
17%
23%
29%
35%
41%
FY11 FY12 FY13 FY14 FY15 Q1
FY16
Q2
FY16
Oct. 27, 2015
Interglobe Aviation Ltd.
IPO Update
IPO UPDATE 4
Competitive Strengths and Strategies:
• The largest domestic passenger airline in India and will continue to focus on enhancing its market position: IAL is the
domestic market leader in India, which is one of the largest and fastest growing aviation markets in the world, with a
market share of 36.5% as of 30 Sept. 2015. The company operated scheduled services to 33 airports in India with a
maximum of 603 domestic flights per day as of August 31, 2015. It has the highest market share in the top 5 domestic
routes in India and intends to continue to strengthen the density of its network by adding flights to existing key markets
and selectively adding routes and destination to enhance the breadth of its services in a sustainable and profitable
manner.
• Maintain disciplined execution of the low-cost carrier business model: IAL’s disciplined execution of low cost carrier
principles helps it to maintain low operating costs, this strategy helps it to maintain an advantage over other LCC
competitors in India who operate an hybrid business model between low-costs and full-service airlines. The company
employs a single aircraft type which helps it to reduce expenses related to maintenance, spare parts etc. IAL’s aircraft
utilization was among the highest of any airlines in FY15. The company operates a point to point route network with no
code-sharing with other airlines for passenger traffic, reducing turnaround time. Its operational reliability was 99.95% in
FY15 as well as the five months ended 31 Aug. 2015 (according to Airbus). IAL intends to reduce its distribution cost by
increasing direct sales via its websites, airports, call centre and mobile app and scaling down commissions to online and
traditional travel agents. As a percent of operating revenue, ancillary revenues of the company is substantially lower than
most international LCC’s. IAL plans to enhance its existing as well as introducing new streams of ancillary revenue upon
obtaining regulatory approvals.
• Structural cost advantage which is expected to be sustained: Magnitude of 2005, 2011 and 2015 aircraft orders helped
IAL to negotiate favourable terms with Airbus and other aircraft-related suppliers and service providers thereby reducing
the overall costs associated with the acquisition, maintenance and operation of its aircrafts. The company maintains a
young fleet by predominantly entering into short term sale-and-leaseback operating leases for the aircrafts purchased
from Airbus, ranging from 3-6 years. As of 31 Aug. 2015, the average age of its fleet is 3.7 years. The young fleet helps it
to achieve better reliability in terms of performance, lower maintenance costs, improved fuel-efficiency, higher flight
dispatch reliability and higher passenger appeal. The A320neo aircrafts which are expected to be delivered from 2015
onwards are expected to provide 15% fuel savings, thereby reducing the fuel consumption as these aircrafts enter the
fleet.
• Award winning service and Strong brand recognition: IAL has been awarded the “Best Low-cost Airline in Central Asia &
India” at the SkyTrax World Airline Awards for 6 consecutive years from 2010-15. It was also recognized as India’s
favourite airline for 2012, 2013 and 2014 by TripAdvisor’s Annual India Air Travel Survey. The company has achieved
recognition of its “Indigo” brand through its simple brand message of “providing low fares, on-time flights and a hassle-
free experience” to its passengers. Sales promotion and advertising expense accounted for less than 1% of its total
expenses for the three months ended June 30, 2015 and in FY15.
• Consistent Profitability and strong cash flow generation, balance sheet and liquidity position: According to CAPA, IAL is
the only Indian carrier to consistently remain profitable for the last seven fiscal years ending in FY15. A strong balance
sheet position, provides it a flexibility to fund future growth and not be constrained by reliance on non-aircraft financing
sources. Strong cash flows from operations for the seven fiscal years from 2009-15, has enabled to further invest in its
business and pay dividends to shareholders in four of the past five fiscals ending FY15. Strong liquidity position insulates
the company from sudden decline in Air demand or spikes in aircraft fuel prices. The liquidity position also enables the
purchase of imported fuel which requires advance payments and is cheaper than fuels purchased domestically and also
make payments to suppliers on time thereby benefiting from supplier discounts.
Oct. 27, 2015
Interglobe Aviation Ltd.
IPO Update
IPO UPDATE 5
Competitive Strengths and Strategies (Contd….):
• Attract and retain talented employees and management and leverage the strength of its promoters: IAL has been
ranked among the top companies to work for in India in 2015 for the eight consecutive year. They have been able to hire
sufficient pilots to facilitate its expansion, and currently have an average of 16 pilots per aircraft as of 31 Aug. 2015. The
management team has a strong background in leading global airlines, hospitality and travel-related business. They also
have the capability to expand business in accordance with the business model. The management team has successfully
guided the airline through industry down cycles and periods of fuel price and exchange rate volatility.
• Robust financial performance: On the back of 24.6% and 29.7% CAGR increase in feet size and available seat kilometer
over FY11-15, IAL reported a top-line growth of 38.1% CAGR to Rs. 139,253.4mn. Total operating expenditure increased
by 40.2%, mainly due to higher fuel cost, which forms around 50% of the total operating cost. Consequently, during the
same period, EBITDA increased by 27.3% with over 5ppts contraction in margin. Depreciation and finance charge
increased with the increase in fleet size. Finance income increased by 50.6% CAGR over FY11-15, resulting into a 22.3%
CAGR rise in reported profit to Rs. 12,955.9mn. During the period, EBITDAR of the company increased by 34.8% CAGR to
Rs. 38,317.6mn. With significant profitability, IAL in last three out of five years have rewarded its shareholders with hefty
dividend, which stood in the range of Rs. 15-45 per share. During Q1 FY16, the company reported a bottom-line of Rs.
6,404.4mn on a top-line of Rs. 42,115.4mn. IAL paid an interim dividend of Rs. 11,026.5mn, however, due to insufficient
cash flow, the networth went negative. Taking into consideration, the future anticipated cash flow generation ability, we
expect the company will return to its positive networth position.
Source: Choice Broking Research, Company DRHP Source: Choice Broking Research, Company DRHP
Annual Financial Performance
38.3
55.6
92.0
111.2
139.3
42.1
30.3%
15.7%
24.8%
19.8%
27.5%
37.4%
15.1%
2.5%
8.5%
4.3%
9.3%
15.2%
0%
5%
10%
15%
20%
25%
30%
35%
40%
30
60
90
120
150
FY11 FY12 FY13 FY14 FY15 Q1 FY16
Total Operating Income (Rs. bn)
EBITDAR Margin (%)
Reported PAT Margin (%)
2.9
6.8
10.8 11.7 11.8
(3.9)
564.0%
81.3%
247.7%
117.0%
305.6%
446.6%
42.0%
-0.9%
25.2% 5.4% 22.3% 11.3%
-100%
0%
100%
200%
300%
400%
500%
600%
(5)
0
5
10
15
20
25
30
35
40
FY11 FY12 FY13 FY14 FY15 Q1 FY16
Restated EPS (Rs.) Restated BVPS (Rs.)
RoE (%) RoCE (%)
Oct. 27, 2015
Interglobe Aviation Ltd.
IPO Update
IPO UPDATE 6
Risk and Concerns:
• Highly competitive airline industry and competition from Indian railways: IAL faces competition from both low-cost
airlines as well as full service carriers that service the same routes. The principal competitors include AirAsia India, Air
India, Go Air, Jet Airways, SpiceJet and Vistara as well as potential new entrants. The intensity of competition varies from
route to route and a number of factors including the strength of the competing airlines. Indian railways, which offers a
cheaper alternate mode of transportation than airlines will be a stiff source of competition given the Indian Governments
initiatives to introduce high speed rails as they are likely to attract the Indian middle class who are the current and
targeted passengers of the company.
• Maintaining a profitable route portfolio: IAL considers a number of factors when selecting its route which include ability
to sustain high passenger load factors and high aircraft utilization rates. The company’s aircraft utilization rate was the
highest in FY15, according to CAPA. Selecting and flying good routes, competing effectively and handling aircraft and
passengers effectively are crucial for the successful performance of its airline operations and as a result its financial
condition.
• Uncertain fuel expense: Aircraft fuel is a major component of cost for airlines. The cost of IAL’s aircraft fuel as a
percentage of its total expenses was 47.1%, 51%, 51%, 50.3%, 46.1% and 39.7% for FY11, FY12, FY13, FY14, FY15 and Q1
FY16. The cost of aircraft fuel cannot be predicted with any degree of certainty. Any unfavourable spikes in the oil prices
can affect the financial position of the company substantially.
• Unfavorable leasing conditions would affect the working capital requirements: IAL as of 30 June, 2015 stated that it has
not borrowed any additional money for its working capital and all the working capital requirements have been funded
from the company’s strong cash flows and incentives received from the lessors. However, unfavorable leasing conditions
could put pressure on the operating cash flows which could lead to the company borrowing money for funding its
working capital requirements.
• No clarity on the future dividend policy: During FY11-15, IAL promoters have taken out Rs. 28,204.4mn as dividend on a
net profit of Rs. 32,734.4mn. This translates into a dividend per share of Rs. 15-45 per share. Moreover, during Q1 FY16,
the company has paid an interim dividend of Rs. 11,026.5mn. No clarity from IAL on the future dividend policy, will be
negative for the investors, who are investing in the IPO with the intention to benefit from the hefty dividend payments.
Oct. 27, 2015
Interglobe Aviation Ltd.
IPO Update
IPO UPDATE 7
Peer Comparison:
There are no profitable listed peers in the domestic market. We have compared IAL with global LCC players. On profitability
front, the company’s EBITDA (13.4%) and PAT (9.3%) margins are significantly lower than the peers average of 18.9% and
9%, respectively. However, RoE and RoCE of IAL is higher than the peers.
On valuation front, the company is available at significant premium to its peers. The company is available at P/E, P/S and
EV/EBITDA of 21.3x, 2.1x and 15.3x, respectively, which are significantly premium to its peers.
Based on below parameters, we recommend investors to “Avoid” the issue.
• Premium valuation
• Competitive advantage of the company, reflected in the issue price
• To hard to sustain a dominant market share
• Promoters already taken out around over Rs. 28bn as dividend in last five years
• Uncertainty on future dividend policy
Company Name Currency CMP (Rs.)
MCAP
(Rs. mn)
Total Operating
Revenue (Rs. mn)
EBITDA Margin
(%)
Reported PAT
Margin (%)
Interglobe Aviation Ltd. INR 765 275,665 139,253 13.4% 9.3%
Jet Airways (India) Ltd INR 399 45,298 209,656 -0.4% -10.0%
Spicejet Ltd. INR 42 25,059 46,224 -9.7% -10.6%
Air Arabia PJSC AED 1.41 6,580 3,733.30 24.0% 14.4%
AirAsia Berhad MYR 1.52 4,230 5,416.80 29.5% -0.6%
Cebu Pacific PHP 87.40 52,964 54,788.80 21.8% 5.3%
Gol Linhas Aereas Inteligentes S.A. USD 0.92 187 9,989.10 7.9% -20.4%
JetBlue Airways Corp USD 24.97 7,861 6,110.00 20.0% 7.7%
Pegasus Hava Tasimaciligi AS TRY 19.10 1,954 3,186.30 11.9% 3.8%
Southwest Airlines Co. USD 45.23 29,825 19,471.00 23.9% 11.1%
Spirit Airlines Inc. USD 39.79 2,901 2,041.00 23.4% 13.1%
Thai Airways International Public Co. Ltd. THB 10.50 22,919 188,646.10 6.9% 7.2%
WestJet Airlines Ltd. CAD 24.89 2,673 4,029.60 19.7% 9.4%
Company Name
BVPS
(Rs.)
DPS
(Rs.)
Debt Equity
Ratio
RoE (%) RoCE (%)
P / E
(x)
P / B
(x)
EV / Sales
(x)
EV / EBITDA
(x)
Interglobe Aviation Ltd. 11.8 0.1 8.4 305.6% 22.3% 21.3 64.7 2.1 15.3
Jet Airways (India) Ltd (556.8) (0.0) (1.9) 33.1% 211.0% (2.2) (0.7) 0.7 (171.4)
Spicejet Ltd. (21.1) 0.0 (1.1) 38.8% 282.7% (5.1) (2.0) 0.8 (8.7)
Air Arabia PJSC 1.09 0.09 0.61 10.6% 9.0% 12.27 1.30 2.17 9.04
AirAsia Berhad 1.64 0.04 2.79 -0.7% 8.1% (137.01) 0.93 2.99 10.12
Cebu Pacific 35.54 1.00 1.57 13.4% 13.0% 18.41 2.46 1.51 6.94
Gol Linhas Aereas Inteligentes S.A. (1.64) 0.00 (18.72) 612.8% 20.3% (0.09) (0.56) 0.42 5.34
JetBlue Airways Corp 8.03 0.00 0.72 18.5% 16.0% 16.82 3.11 1.47 7.36
Pegasus Hava Tasimaciligi AS 11.35 0.00 1.17 10.3% 8.2% 16.31 1.68 0.77 6.45
Southwest Airlines Co. 10.27 0.27 0.36 32.0% 29.3% 13.75 4.40 1.50 6.30
Spirit Airlines Inc. 13.76 0.00 0.14 26.7% 35.7% 10.82 2.89 1.18 5.03
Thai Airways International Public Co. Ltd. 18.92 0.00 4.40 32.8% -4.0% 1.69 0.56 0.96 13.93
WestJet Airlines Ltd. 16.55 0.61 0.58 21.3% 17.0% 7.06 1.50 0.58 2.95
Source: Choice Broking Research, Company DRHP
Oct. 27, 2015
Interglobe Aviation Ltd.
IPO Update
IPO UPDATE 8
Consolidated Financial Statements:
Source: Choice Broking Research, Company DRHP
Consolidated Profit and Loss Statement
Particulars (Rs. mn) FY11 FY12 FY13 FY14 FY15 Q1 FY16
Revenue from Operations 38,334.2 55,646.6 92,031.3 111,165.8 139,253.4 42,115.4
Aircraft Fuel Expenses (15,213.3) (28,735.9) (43,126.3) (55,133.5) (57,484.9) (13,477.3)
Aircraft and Engine Rentals (6,372.4) (10,634.4) (17,149.5) (20,310.3) (23,075.5) (6,904.5)
Less: Cash and Non-Cash Incentives 2,273.9 2,627.3 3,588.0 3,607.2 3,553.1 887.7
Purchase of Stock in Trade (190.9) (341.8) (559.9) (584.0) (817.1) (231.9)
Changes in Inventories of SIT 1.1 6.8 18.7 (7.1) 31.7 2.2
Employee Benefits Expense (2,930.2) (5,118.6) (6,904.5) (9,205.5) (11,886.9) (3,825.1)
Other Expenses (8,783.7) (12,961.0) (18,961.4) (24,466.3) (30,877.0) (8,842.4)
EBITDA 7,118.7 488.9 8,936.4 5,066.3 18,696.9 9,724.1
Depreciation and Amortization (628.7) (665.2) (856.2) (2,260.1) (3,022.1) (1,199.7)
EBIT 6,490.0 (176.3) 8,080.2 2,806.3 15,674.7 8,524.5
Finance Cost (449.9) (514.3) (578.0) (1,225.8) (1,155.3) (328.4)
Finance Income 727.1 1,207.0 2,006.4 2,863.5 3,739.7 1,029.6
Other Income 380.3 232.6 364.7 291.8 98.4 26.9
EBT 7,147.5 749.0 9,873.2 4,735.8 18,357.5 9,252.7
Tax Expenses (1,352.9) 656.9 (2,039.6) 8.6 (5,401.6) (2,848.4)
Reported PAT 5,794.7 1,405.9 7,833.6 4,744.4 12,955.9 6,404.4
Consolidated Balance Sheet
Particulars (Rs. mn) FY11 FY12 FY13 FY14 FY15 Q1 FY16
Share Capital 343.7 343.7 343.7 343.7 343.7 3,437.2
Reserves and Surplus 683.7 2,089.6 3,546.8 3,873.7 3,918.5 (4,831.0)
Deferred Tax Liabilities (Net) 0.0 0.0 537.2 528.6 4,091.4 4,177.6
Long-Term Borrowings 8,069.8 9,055.5 16,173.3 30,807.4 35,884.0 35,667.2
Other Long-Term Liabilities 1,014.6 2,793.8 7,234.8 12,957.9 20,169.5 21,976.5
Long-Term Provisions 133.8 158.3 231.6 368.3 522.9 548.3
Deferred Incentives 4,678.2 8,748.4 11,677.5 13,654.3 13,317.4 12,294.5
Short-Term Borrowings 540.3 305.6 814.3 0.0 0.0 0.0
Trade Payables 1,076.2 1,584.8 2,647.9 3,827.6 4,754.8 5,771.1
Other Current Liabilities 4,624.9 8,149.0 11,383.3 16,149.4 19,008.0 17,660.8
Short-Term Provision 5,808.6 186.5 307.9 4,645.1 1,528.5 4,880.2
Deferred Incentives 2,220.8 3,055.4 3,626.6 3,878.4 4,199.0 4,172.2
Total Liabilities 29,194.5 36,470.6 58,524.9 91,034.4 107,737.7 105,754.4
Tangible Fixed Assets 8,310.1 8,813.1 17,547.9 39,407.2 48,664.0 48,318.4
Intangible Fixed Assets 1.3 47.0 96.7 152.5 96.4 106.3
Capital Work in Progress 0.0 0.0 68.5 0.0 4.5 6.1
Non-Current Investments 0.0 0.0 0.4 0.5 0.5 0.5
Deferred Tax Asset (Net) 8.2 665.1 0.0 0.0 0.0 0.0
Long-Term Loans and Advances 1,268.7 2,973.1 5,247.0 8,012.1 11,236.6 11,536.0
Other Non-Current Assets 119.0 885.3 4,857.7 14,315.2 16,055.6 15,100.0
Current Investments 8,022.4 5,234.2 11,383.4 12,714.8 5,167.5 0.0
Inventories 446.7 373.9 522.8 672.9 1,305.5 1,683.7
Trade Receivables 166.6 389.2 685.2 891.2 1,045.5 1,172.5
Cash and Bank Balances 7,756.9 13,088.3 13,405.9 11,015.3 19,993.8 22,694.2
Short-Term Loans and Advances 2,491.3 3,179.5 3,586.6 2,231.3 1,555.6 2,113.6
Other Current Assets 603.2 822.0 1,123.0 1,621.4 2,612.2 3,023.2
Total Assets 29,194.5 36,470.6 58,524.9 91,034.4 107,737.7 105,754.4
Oct. 27, 2015
Interglobe Aviation Ltd.
IPO Update
IPO UPDATE 9
Consolidated Financial Statements (Contd…):
Source: Choice Broking Research, Company DRHP
Cash Flow Statement
Particulars (Rs. mn) FY11 FY12 FY13 FY14 FY15 Q1 FY16
PBT 7,147.5 749.0 9,873.2 4,735.8 18,357.5 9,252.7
Depreciation and Amortisation Expenses 628.7 665.2 856.2 2,260.1 3,022.1 1,199.7
Interest Expense 143.5 144.0 178.9 192.9 107.3 25.2
Interest Income on Fixed Deposits (333.4) (804.4) (1,419.6) (1,868.6) (2,703.8) (815.9)
Dividend from Current Investments (382.6) (384.3) (328.8) (355.7) 0.0 0.0
Others 238.2 423.2 408.4 863.9 1,241.8 1,578.0
Change in Working Capital 2,600.1 8,535.0 9,696.3 11,202.1 7,765.2 (2,009.5)
Taxes Paid (1,322.2) (371.1) (1,851.5) (1,075.4) (3,951.2) (491.1)
Cash Flow from Operating Activities 8,719.8 8,956.7 17,413.0 15,955.0 23,838.8 8,739.0
Purchase of Fixed Assets (2,133.1) (331.7) (9,155.7) (23,241.7) (10,171.2) (338.2)
Deposits Made with Banks (4,749.9) (3,983.6) (5,288.9) (6,856.0) (9,121.9) (3,070.6)
Proceeds from Sale of Fixed Assets 1,657.0 0.7 2.6 4.6 1.6 0.6
Purchase of Mutual Funds / Shares (106,291.9) (45,218.8) (64,831.1) (71,175.8) (65,074.5) (16,915.0)
Proceeds from Sale of Mutual Funds 104,851.5 48,025.4 58,939.5 70,483.5 73,657.7 22,296.3
Interest Received 200.5 657.3 1,107.9 1,292.0 1,303.1 197.9
Dividend Received 382.6 384.3 328.8 355.7 0.0 0.0
Cash Flow Operating Activities (6,083.4) (466.5) (18,896.9) (29,137.8) (9,405.1) 2,171.0
Proceeds from Secured Loans 3,428.2 2,935.0 10,301.5 18,153.3 8,137.5 0.0
Repayment of Secured Loans (3,690.6) (2,475.7) (3,032.0) (4,515.8) (4,320.3) (1,109.9)
Repayment of Unsecured Loans 0.0 (678.6) 0.0 0.0 0.0 0.0
Interest Paid (143.5) (144.0) (169.1) (185.9) (100.5) (48.4)
Finance Lease Charges Paid (302.4) (312.7) (363.1) (603.2) (669.7) (170.8)
Repayment of Share Capital (2,012.4) 0.0 0.0 0.0 0.0 0.0
Dividend Paid 0.0 (4,904.3) (5,486.4) 0.0 (13,575.3) (11,026.5)
Tax Paid on Dividends 0.0 (795.6) (890.0) 0.0 (2,552.8) 0.0
Cash Flow from Financing Activities (2,720.7) (6,376.0) 360.8 12,848.4 (13,081.1) (12,355.5)
Net Cash Flow (84.3) 2,114.3 (1,123.0) (334.3) 1,352.7 (1,445.5)
Opening Balance of Cash and Cash Equivalents 540.3 456.0 2,574.7 1,445.5 1,106.4 2,467.5
Closing Balance of Cash and Cash Equivalents 456.0 2,570.3 1,451.6 1,111.2 2,459.1 1,022.0
Oct. 27, 2015
Interglobe Aviation Ltd.
IPO Update
IPO UPDATE 10
Financial Statements (Contd…):
* Represents per share calculation based on number of shares o/s post issue; Source: Choice Broking Research, Company DRHP
Consolidated Financial Ratios
Particulars (Rs. mn) FY11 FY12 FY13 FY14 FY15 Q1 FY16
Revenue Growth Rate (%) 45.2% 65.4% 20.8% 25.3% -69.8%
EBIDTA Growth Rate (%) -93.1% 1727.7% -43.3% 269.0% -48.0%
EBIDTA Margin (%) 18.6% 0.9% 9.7% 4.6% 13.4% 23.1%
EBIT Growth Rate (%) -102.7% -4683.4% -65.3% 458.6% -45.6%
EBIT Margin (%) 16.9% -0.3% 8.8% 2.5% 11.3% 20.2%
Reported PAT Growth Rate (%) -75.7% 457.2% -39.4% 173.1% -50.6%
Reported PAT Margin (%) 15.1% 2.5% 8.5% 4.3% 9.3% 15.2%
Liquidity Ratios
Current Ratio 0.8 1.4 1.1 0.6 0.9 0.9
Quick Ratio 0.8 1.3 1.0 0.6 0.9 0.9
Interest Coverage Ratio 14.4 0.3 14.0 2.3 13.6 26.0
Debt to Equity Ratio 8.4 3.8 4.4 7.3 8.4 (25.6)
Net Debt to EBITDA (1.0) (18.3) (0.9) 1.4 0.6 1.3
Net Debt to Equity (7.0) (3.7) (2.0) 1.7 2.5 (9.3)
Turnover Ratios
Inventory Turnover Ratio 85.8 148.8 176.1 165.2 106.7 25.0
Receivable Turnover Ratio 230.1 143.0 134.3 124.7 133.2 35.9
Accounts Payable Turnover Ratio 35.6 35.1 34.8 29.0 29.3 7.3
Fixed Asset Turnover Ratio 4.6 6.3 5.2 2.8 2.9 0.9
Total Asset Turnover Ratio 1.3 1.5 1.6 1.2 1.3 0.4
Working Capital Turnover Ratio (16.9) 11.4 67.8 (9.2) (46.8) (23.4)
Return Ratios
RoE (%) 564.0% 81.3% 247.7% 117.0% 305.6% 446.6%
RoCE (%) 42.0% -0.9% 25.2% 5.4% 22.3% 11.3%
Per Share Data
Restated EPS 16.1 3.9 21.7 13.2 36.0 17.8
Restated BVPS 2.9 6.8 10.8 11.7 11.8 (3.9)
Restated Cash EPS 17.8 5.7 24.1 19.4 44.3 21.1
Restated Operatiing Cash Flow per Share 24.2 24.9 48.3 44.3 66.2 24.3
Oct. 27, 2015
Interglobe Aviation Ltd.
IPO Update
IPO UPDATE
es
11Š CHOICE INSTITUTIONAL RESEARCH
Disclaimer
This is solely for information of clients of Choice Broking and does not construe to be an investment advice. It is also not intended as an offer or solicitation for
the purchase and sale of any financial instruments. Any action taken by you on the basis of the information contained herein is your responsibility alone and
Choice Broking its subsidiaries or its employees or associates will not be liable in any manner for the consequences of such action taken by you. We have
exercised due diligence in checking the correctness and authenticity of the information contained in this recommendation, but Choice Broking or any of its
subsidiaries or associates or employees shall not be in any way responsible for any loss or damage that may arise to any person from any inadvertent error in
the information contained in this recommendation or any action taken on basis of this information. This report is based on the fundamental analysis with a view
to forecast future price. The Research analysts for this report certifies that all of the views expressed in this report accurately reflect his or her personal views
about the subject company or companies and its or their securities, and no part of his or her compensation was, is or will be, directly or indirectly related to
specific recommendations or views expressed in this report. Choice Broking has based this document on information obtained from sources it believes to be
reliable but which it has not independently verified; Choice Broking makes no guarantee, representation or warranty and accepts no responsibility or liability as
to its accuracy or completeness. The opinions contained within the report are based upon publicly available information at the time of publication and are
subject to change without notice. The information and any disclosures provided herein are in summary form and have been prepared for informational
purposes. The recommendations and suggested price levels are intended purely for stock market investment purposes. The recommendations are valid for the
day of the report and will remain valid till the target period. The information and any disclosures provided herein may be considered confidential. Any use,
distribution, modification, copying, forwarding or disclosure by any person is strictly prohibited. The information and any disclosures provided herein do not
constitute a solicitation or offer to purchase or sell any security or other financial product or instrument. The current performance may be unaudited. Past
performance does not guarantee future returns. There can be no assurance that investments will achieve any targeted rates of return, and there is no guarantee
against the loss of your entire investment.
POTENTIAL CONFLICT OF INTEREST DISCLOSURE (as on date of report) Disclosure of interest statement – • Analyst interest of the stock /Instrument(s): - No. •
Firm interest of the stock / Instrument (s): - No.
Choice’s Rating Rationale
The price target for a large cap stock represents the value the analyst expects the stock to reach over next 12 months. For a
stock to be classified as Outperform, the expected return must exceed the local risk free return by at least 5% over the next
12 months. For a stock to be classified as Underperform, the stock return must be below the local risk free return by at least
5% over the next 12 months. Stocks between these bands are classified as Neutral.
Choice Equity Broking Pvt. Ltd.
Choice House, Shree Shakambhari Corporate Park, Plt No: -156-158,
J.B. Nagar, Andheri (East), Mumbai - 400 099.
+91-022-6707 9999
+91-022-6707 9959
www.choiceindia.com
Institutional Equity Team
Name Designation Email id Contact No.
Ajay Kejriwal President ajay@choiceindia.com 022- 6707 9850
Sumeet Bagadia Head of Research sumeet.bagadia@choiceindia.com 022 - 6707 9830
Amit Singh VP - Institutional Sales amit.singh@choiceindia.com 022 - 6707 9852
Devendra Gaikwad Sr. Manager - Institutional Sales devendra.gaikwad@choiceindia.com 022 - 6707 9877
Rajnath Yadav Research Analyst rajnath.yadav@choiceindia.com 022 - 6707 9975
Satish Kumar Research Analyst satish.kumar@choiceindia.com 022 - 6707 9974
Kunal Parmar Research Associate kunal.parmar@choiceindia.com 022 - 6707 9982
Ritesh Patel Research Associate ritesh.patel@choiceindia.com 022 - 6707 9978
Amit Pathania Research Associate amit.pathania@choiceindia.com 022 - 6707 9979
Vikas Chaudhari Research Associate vikas.chaudhari@choiceindia.com 022 - 6707 9988
Trirashmi Ghoderao Research Advisor trirashmi.ghoderao@choiceindia.com 022 - 6707 9972
Neeraj Yadav Research Advisor Neeraj.yadav@choiceindia.com 022 - 6707 9988
IPO Update

More Related Content

What's hot

COMPETITIVE POSITION : INDIGO AIRLINES
 COMPETITIVE POSITION : INDIGO AIRLINES COMPETITIVE POSITION : INDIGO AIRLINES
COMPETITIVE POSITION : INDIGO AIRLINESJatinder Singh
 
Indian aviation industry
Indian aviation industryIndian aviation industry
Indian aviation industrymarketingdaibs
 
IndiGo Airline Strategy_PPT by Suddhwasattwa Mukherjee
IndiGo Airline Strategy_PPT by Suddhwasattwa MukherjeeIndiGo Airline Strategy_PPT by Suddhwasattwa Mukherjee
IndiGo Airline Strategy_PPT by Suddhwasattwa MukherjeeSuddhwasattwa Mukherjee
 
Aviation industry
Aviation industryAviation industry
Aviation industryFedEx Express
 
10 key things to know about Indigo IPO
10 key things to know about Indigo IPO10 key things to know about Indigo IPO
10 key things to know about Indigo IPOLatin Manharlal
 
Indigo airlines
Indigo airlinesIndigo airlines
Indigo airlinesAbinav kumar
 
Indigo Airlines Strategy
Indigo Airlines StrategyIndigo Airlines Strategy
Indigo Airlines StrategyAbhishek Naik
 
Indigo Airlines - International Marketing - Met Students
Indigo Airlines - International Marketing - Met Students Indigo Airlines - International Marketing - Met Students
Indigo Airlines - International Marketing - Met Students Rajesh Shetty
 
Indigo Airlines
Indigo AirlinesIndigo Airlines
Indigo AirlinesZil Shah
 
Future development of India as Aviation Hub
Future development of India as Aviation HubFuture development of India as Aviation Hub
Future development of India as Aviation HubPrathiksha Gowda
 
Mapping the success of indigo airlines.
Mapping the success of indigo airlines.Mapping the success of indigo airlines.
Mapping the success of indigo airlines.Parth Singh
 
Strategy Management at IndiGo Airlines
Strategy Management at IndiGo AirlinesStrategy Management at IndiGo Airlines
Strategy Management at IndiGo AirlinesPramey Zode
 
CASE STUDY ON THE SUCCESSFUL JOURNEY OF INDIGO AIRLINES
CASE STUDY ON THE SUCCESSFUL JOURNEY OF INDIGO AIRLINES CASE STUDY ON THE SUCCESSFUL JOURNEY OF INDIGO AIRLINES
CASE STUDY ON THE SUCCESSFUL JOURNEY OF INDIGO AIRLINES VARUN KESAVAN
 
Indigo airlines case study
Indigo airlines   case studyIndigo airlines   case study
Indigo airlines case studyNilesh Mashru
 
SWOT analysis of Vistara ( PESTLE & Porter's Model on Indian Aviation Industry)
SWOT analysis of Vistara ( PESTLE & Porter's Model on Indian Aviation Industry)SWOT analysis of Vistara ( PESTLE & Porter's Model on Indian Aviation Industry)
SWOT analysis of Vistara ( PESTLE & Porter's Model on Indian Aviation Industry)Harshit Lokhande
 
indigo value chain ppt
indigo value chain pptindigo value chain ppt
indigo value chain pptWASEEM KHAN
 

What's hot (20)

COMPETITIVE POSITION : INDIGO AIRLINES
 COMPETITIVE POSITION : INDIGO AIRLINES COMPETITIVE POSITION : INDIGO AIRLINES
COMPETITIVE POSITION : INDIGO AIRLINES
 
Indian aviation industry
Indian aviation industryIndian aviation industry
Indian aviation industry
 
IndiGo Airline Strategy_PPT by Suddhwasattwa Mukherjee
IndiGo Airline Strategy_PPT by Suddhwasattwa MukherjeeIndiGo Airline Strategy_PPT by Suddhwasattwa Mukherjee
IndiGo Airline Strategy_PPT by Suddhwasattwa Mukherjee
 
Aviation industry
Aviation industryAviation industry
Aviation industry
 
10 key things to know about Indigo IPO
10 key things to know about Indigo IPO10 key things to know about Indigo IPO
10 key things to know about Indigo IPO
 
Indigo airlines
Indigo airlinesIndigo airlines
Indigo airlines
 
IndiGo airlines
IndiGo airlinesIndiGo airlines
IndiGo airlines
 
Indigo Airlines Strategy
Indigo Airlines StrategyIndigo Airlines Strategy
Indigo Airlines Strategy
 
Indigo Airlines - International Marketing - Met Students
Indigo Airlines - International Marketing - Met Students Indigo Airlines - International Marketing - Met Students
Indigo Airlines - International Marketing - Met Students
 
Indigo Airlines
Indigo AirlinesIndigo Airlines
Indigo Airlines
 
Future development of India as Aviation Hub
Future development of India as Aviation HubFuture development of India as Aviation Hub
Future development of India as Aviation Hub
 
Mapping the success of indigo airlines.
Mapping the success of indigo airlines.Mapping the success of indigo airlines.
Mapping the success of indigo airlines.
 
Strategy Management at IndiGo Airlines
Strategy Management at IndiGo AirlinesStrategy Management at IndiGo Airlines
Strategy Management at IndiGo Airlines
 
CASE STUDY ON THE SUCCESSFUL JOURNEY OF INDIGO AIRLINES
CASE STUDY ON THE SUCCESSFUL JOURNEY OF INDIGO AIRLINES CASE STUDY ON THE SUCCESSFUL JOURNEY OF INDIGO AIRLINES
CASE STUDY ON THE SUCCESSFUL JOURNEY OF INDIGO AIRLINES
 
Aviation Sector Report September 2017
Aviation Sector Report September 2017Aviation Sector Report September 2017
Aviation Sector Report September 2017
 
Indigo airlines case study
Indigo airlines   case studyIndigo airlines   case study
Indigo airlines case study
 
Automobiles Sector Report September 2017
Automobiles Sector Report September 2017Automobiles Sector Report September 2017
Automobiles Sector Report September 2017
 
SWOT analysis of Vistara ( PESTLE & Porter's Model on Indian Aviation Industry)
SWOT analysis of Vistara ( PESTLE & Porter's Model on Indian Aviation Industry)SWOT analysis of Vistara ( PESTLE & Porter's Model on Indian Aviation Industry)
SWOT analysis of Vistara ( PESTLE & Porter's Model on Indian Aviation Industry)
 
indigo value chain ppt
indigo value chain pptindigo value chain ppt
indigo value chain ppt
 
Automobiles Sector Report - April 2019
Automobiles Sector Report - April 2019Automobiles Sector Report - April 2019
Automobiles Sector Report - April 2019
 

Viewers also liked

Choice - Morning Tea
Choice - Morning TeaChoice - Morning Tea
Choice - Morning Teachoice broking
 
Choice - Morning Tea
Choice - Morning TeaChoice - Morning Tea
Choice - Morning Teachoice broking
 
Choice - Morning Tea
Choice - Morning TeaChoice - Morning Tea
Choice - Morning Teachoice broking
 
Ambuja Cements Ltd. Q3 CY15 Result Update
Ambuja Cements Ltd. Q3 CY15 Result UpdateAmbuja Cements Ltd. Q3 CY15 Result Update
Ambuja Cements Ltd. Q3 CY15 Result Updatechoice broking
 
Morning Tea 09-09-2015
Morning Tea 09-09-2015Morning Tea 09-09-2015
Morning Tea 09-09-2015choice broking
 
Choice - Morning Tea
Choice - Morning Tea  Choice - Morning Tea
Choice - Morning Tea choice broking
 
Ultratech cement ltd. Q2 FY16 result analysis
Ultratech cement ltd. Q2 FY16 result analysisUltratech cement ltd. Q2 FY16 result analysis
Ultratech cement ltd. Q2 FY16 result analysischoice broking
 
Morning Tea 14-09-15
Morning Tea 14-09-15Morning Tea 14-09-15
Morning Tea 14-09-15choice broking
 
ChoiceBroking - Morning Tea
ChoiceBroking - Morning Tea ChoiceBroking - Morning Tea
ChoiceBroking - Morning Tea choice broking
 
Morning Tea : ‪ONGC‬, CANBK‬
 Morning Tea : ‪ONGC‬, CANBK‬ Morning Tea : ‪ONGC‬, CANBK‬
Morning Tea : ‪ONGC‬, CANBK‬choice broking
 
‬ Morning Tea
‬ Morning Tea‬ Morning Tea
‬ Morning Teachoice broking
 
AxisBank‬ Ltd.Q2 FY16 Result Analysis
AxisBank‬ Ltd.Q2 FY16 Result AnalysisAxisBank‬ Ltd.Q2 FY16 Result Analysis
AxisBank‬ Ltd.Q2 FY16 Result Analysischoice broking
 
IPO Update: Dr. Lal PathLabs Ltd.
IPO Update: Dr. Lal PathLabs Ltd.IPO Update: Dr. Lal PathLabs Ltd.
IPO Update: Dr. Lal PathLabs Ltd.choice broking
 
Morning tea 04-11-2015
Morning tea 04-11-2015 Morning tea 04-11-2015
Morning tea 04-11-2015 choice broking
 
Morning tea 28-10-2015
Morning tea 28-10-2015Morning tea 28-10-2015
Morning tea 28-10-2015choice broking
 
Choice - Morning Tea
Choice - Morning TeaChoice - Morning Tea
Choice - Morning Teachoice broking
 
Commodities Call Tracker of Jan'15
Commodities Call Tracker of Jan'15Commodities Call Tracker of Jan'15
Commodities Call Tracker of Jan'15choice broking
 

Viewers also liked (19)

Choice - Morning Tea
Choice - Morning TeaChoice - Morning Tea
Choice - Morning Tea
 
Choice - Morning Tea
Choice - Morning TeaChoice - Morning Tea
Choice - Morning Tea
 
Choice - Morning Tea
Choice - Morning TeaChoice - Morning Tea
Choice - Morning Tea
 
Ambuja Cements Ltd. Q3 CY15 Result Update
Ambuja Cements Ltd. Q3 CY15 Result UpdateAmbuja Cements Ltd. Q3 CY15 Result Update
Ambuja Cements Ltd. Q3 CY15 Result Update
 
Morning Tea 09-09-2015
Morning Tea 09-09-2015Morning Tea 09-09-2015
Morning Tea 09-09-2015
 
Morning Tea
Morning TeaMorning Tea
Morning Tea
 
Choice - Morning Tea
Choice - Morning Tea  Choice - Morning Tea
Choice - Morning Tea
 
Morning Tea
Morning TeaMorning Tea
Morning Tea
 
Ultratech cement ltd. Q2 FY16 result analysis
Ultratech cement ltd. Q2 FY16 result analysisUltratech cement ltd. Q2 FY16 result analysis
Ultratech cement ltd. Q2 FY16 result analysis
 
Morning Tea 14-09-15
Morning Tea 14-09-15Morning Tea 14-09-15
Morning Tea 14-09-15
 
ChoiceBroking - Morning Tea
ChoiceBroking - Morning Tea ChoiceBroking - Morning Tea
ChoiceBroking - Morning Tea
 
Morning Tea : ‪ONGC‬, CANBK‬
 Morning Tea : ‪ONGC‬, CANBK‬ Morning Tea : ‪ONGC‬, CANBK‬
Morning Tea : ‪ONGC‬, CANBK‬
 
‬ Morning Tea
‬ Morning Tea‬ Morning Tea
‬ Morning Tea
 
AxisBank‬ Ltd.Q2 FY16 Result Analysis
AxisBank‬ Ltd.Q2 FY16 Result AnalysisAxisBank‬ Ltd.Q2 FY16 Result Analysis
AxisBank‬ Ltd.Q2 FY16 Result Analysis
 
IPO Update: Dr. Lal PathLabs Ltd.
IPO Update: Dr. Lal PathLabs Ltd.IPO Update: Dr. Lal PathLabs Ltd.
IPO Update: Dr. Lal PathLabs Ltd.
 
Morning tea 04-11-2015
Morning tea 04-11-2015 Morning tea 04-11-2015
Morning tea 04-11-2015
 
Morning tea 28-10-2015
Morning tea 28-10-2015Morning tea 28-10-2015
Morning tea 28-10-2015
 
Choice - Morning Tea
Choice - Morning TeaChoice - Morning Tea
Choice - Morning Tea
 
Commodities Call Tracker of Jan'15
Commodities Call Tracker of Jan'15Commodities Call Tracker of Jan'15
Commodities Call Tracker of Jan'15
 

Similar to Interglobe aviation ltd. ipo update

B3 final presentation
B3 final presentationB3 final presentation
B3 final presentationNeha Garg
 
Industry Analysis- Indian aviation industry
Industry Analysis- Indian aviation industryIndustry Analysis- Indian aviation industry
Industry Analysis- Indian aviation industryAshish Otwal Rajput
 
Marketing case study on Indigo Airlines
Marketing case study on Indigo AirlinesMarketing case study on Indigo Airlines
Marketing case study on Indigo AirlinesNeelutpal Saha
 
Indian Aviation Industry analysis
Indian Aviation Industry  analysis Indian Aviation Industry  analysis
Indian Aviation Industry analysis shivam patel
 
Aviation, Automobile and Leather Industry of INDIA
Aviation, Automobile and Leather Industry of INDIAAviation, Automobile and Leather Industry of INDIA
Aviation, Automobile and Leather Industry of INDIAAshish Otwal Rajput
 
Aviation Sector In India
Aviation Sector In IndiaAviation Sector In India
Aviation Sector In IndiaJatin Tanwar
 
Aviation industry
Aviation industryAviation industry
Aviation industryPriyesh Neema
 
Pitchbook for Ashok Leyland
Pitchbook for Ashok LeylandPitchbook for Ashok Leyland
Pitchbook for Ashok LeylandAbhirup Lahiri
 
Aviation Industry
Aviation IndustryAviation Industry
Aviation Industryxmuzik
 
Indian civil aviation industry
Indian civil aviation industryIndian civil aviation industry
Indian civil aviation industryAman Kaushal
 
Indian civil aviation industry
Indian civil aviation industry Indian civil aviation industry
Indian civil aviation industry Dr. C.VIJAI
 
Civil aviation 07_15_18_32_53
Civil aviation 07_15_18_32_53Civil aviation 07_15_18_32_53
Civil aviation 07_15_18_32_53domsr
 
Civil aviation
Civil aviationCivil aviation
Civil aviationdashaa08
 
Analysis of annual report of Jet Airways
Analysis of annual report of Jet AirwaysAnalysis of annual report of Jet Airways
Analysis of annual report of Jet AirwaysSunny Agarwal
 
7P's _Aviation sector _ India
7P's _Aviation sector _ India7P's _Aviation sector _ India
7P's _Aviation sector _ IndiaAnuranjan Kumar
 

Similar to Interglobe aviation ltd. ipo update (20)

B3 final presentation
B3 final presentationB3 final presentation
B3 final presentation
 
Industry Analysis- Indian aviation industry
Industry Analysis- Indian aviation industryIndustry Analysis- Indian aviation industry
Industry Analysis- Indian aviation industry
 
Marketing case study on Indigo Airlines
Marketing case study on Indigo AirlinesMarketing case study on Indigo Airlines
Marketing case study on Indigo Airlines
 
Indian Aviation Industry analysis
Indian Aviation Industry  analysis Indian Aviation Industry  analysis
Indian Aviation Industry analysis
 
Aviation, Automobile and Leather Industry of INDIA
Aviation, Automobile and Leather Industry of INDIAAviation, Automobile and Leather Industry of INDIA
Aviation, Automobile and Leather Industry of INDIA
 
Indian Aviation sector analysis
Indian Aviation sector analysisIndian Aviation sector analysis
Indian Aviation sector analysis
 
Aviation Sector In India
Aviation Sector In IndiaAviation Sector In India
Aviation Sector In India
 
Aviation industry
Aviation industryAviation industry
Aviation industry
 
Indigo
IndigoIndigo
Indigo
 
Aviation Sector Report - April 2019
Aviation Sector Report - April 2019Aviation Sector Report - April 2019
Aviation Sector Report - April 2019
 
Pitchbook for Ashok Leyland
Pitchbook for Ashok LeylandPitchbook for Ashok Leyland
Pitchbook for Ashok Leyland
 
Aviation Industry
Aviation IndustryAviation Industry
Aviation Industry
 
Indian civil aviation industry
Indian civil aviation industryIndian civil aviation industry
Indian civil aviation industry
 
Indian civil aviation industry
Indian civil aviation industry Indian civil aviation industry
Indian civil aviation industry
 
Civil aviation 07_15_18_32_53
Civil aviation 07_15_18_32_53Civil aviation 07_15_18_32_53
Civil aviation 07_15_18_32_53
 
Civil aviation
Civil aviationCivil aviation
Civil aviation
 
Analysis of annual report of Jet Airways
Analysis of annual report of Jet AirwaysAnalysis of annual report of Jet Airways
Analysis of annual report of Jet Airways
 
Asian-Anubhav Singh
Asian-Anubhav SinghAsian-Anubhav Singh
Asian-Anubhav Singh
 
7P's _Aviation sector _ India
7P's _Aviation sector _ India7P's _Aviation sector _ India
7P's _Aviation sector _ India
 
Anubhav Singh IJIKMC
Anubhav Singh IJIKMCAnubhav Singh IJIKMC
Anubhav Singh IJIKMC
 

Recently uploaded

(ANIKA) Budhwar Peth Call Girls Just Call 7001035870 [ Cash on Delivery ] Pun...
(ANIKA) Budhwar Peth Call Girls Just Call 7001035870 [ Cash on Delivery ] Pun...(ANIKA) Budhwar Peth Call Girls Just Call 7001035870 [ Cash on Delivery ] Pun...
(ANIKA) Budhwar Peth Call Girls Just Call 7001035870 [ Cash on Delivery ] Pun...ranjana rawat
 
Booking open Available Pune Call Girls Shivane 6297143586 Call Hot Indian Gi...
Booking open Available Pune Call Girls Shivane  6297143586 Call Hot Indian Gi...Booking open Available Pune Call Girls Shivane  6297143586 Call Hot Indian Gi...
Booking open Available Pune Call Girls Shivane 6297143586 Call Hot Indian Gi...Call Girls in Nagpur High Profile
 
High Class Call Girls Nagpur Grishma Call 7001035870 Meet With Nagpur Escorts
High Class Call Girls Nagpur Grishma Call 7001035870 Meet With Nagpur EscortsHigh Class Call Girls Nagpur Grishma Call 7001035870 Meet With Nagpur Escorts
High Class Call Girls Nagpur Grishma Call 7001035870 Meet With Nagpur Escortsranjana rawat
 
Call Girls Service Nagpur Maya Call 7001035870 Meet With Nagpur Escorts
Call Girls Service Nagpur Maya Call 7001035870 Meet With Nagpur EscortsCall Girls Service Nagpur Maya Call 7001035870 Meet With Nagpur Escorts
Call Girls Service Nagpur Maya Call 7001035870 Meet With Nagpur Escortsranjana rawat
 
The Economic History of the U.S. Lecture 30.pdf
The Economic History of the U.S. Lecture 30.pdfThe Economic History of the U.S. Lecture 30.pdf
The Economic History of the U.S. Lecture 30.pdfGale Pooley
 
20240417-Calibre-April-2024-Investor-Presentation.pdf
20240417-Calibre-April-2024-Investor-Presentation.pdf20240417-Calibre-April-2024-Investor-Presentation.pdf
20240417-Calibre-April-2024-Investor-Presentation.pdfAdnet Communications
 
VIP Call Girls Service Dilsukhnagar Hyderabad Call +91-8250192130
VIP Call Girls Service Dilsukhnagar Hyderabad Call +91-8250192130VIP Call Girls Service Dilsukhnagar Hyderabad Call +91-8250192130
VIP Call Girls Service Dilsukhnagar Hyderabad Call +91-8250192130Suhani Kapoor
 
02_Fabio Colombo_Accenture_MeetupDora&Cybersecurity.pptx
02_Fabio Colombo_Accenture_MeetupDora&Cybersecurity.pptx02_Fabio Colombo_Accenture_MeetupDora&Cybersecurity.pptx
02_Fabio Colombo_Accenture_MeetupDora&Cybersecurity.pptxFinTech Belgium
 
Russian Call Girls In Gtb Nagar (Delhi) 9711199012 💋✔💕😘 Naughty Call Girls Se...
Russian Call Girls In Gtb Nagar (Delhi) 9711199012 💋✔💕😘 Naughty Call Girls Se...Russian Call Girls In Gtb Nagar (Delhi) 9711199012 💋✔💕😘 Naughty Call Girls Se...
Russian Call Girls In Gtb Nagar (Delhi) 9711199012 💋✔💕😘 Naughty Call Girls Se...shivangimorya083
 
20240429 Calibre April 2024 Investor Presentation.pdf
20240429 Calibre April 2024 Investor Presentation.pdf20240429 Calibre April 2024 Investor Presentation.pdf
20240429 Calibre April 2024 Investor Presentation.pdfAdnet Communications
 
CALL ON ➥8923113531 🔝Call Girls Gomti Nagar Lucknow best sexual service
CALL ON ➥8923113531 🔝Call Girls Gomti Nagar Lucknow best sexual serviceCALL ON ➥8923113531 🔝Call Girls Gomti Nagar Lucknow best sexual service
CALL ON ➥8923113531 🔝Call Girls Gomti Nagar Lucknow best sexual serviceanilsa9823
 
03_Emmanuel Ndiaye_Degroof Petercam.pptx
03_Emmanuel Ndiaye_Degroof Petercam.pptx03_Emmanuel Ndiaye_Degroof Petercam.pptx
03_Emmanuel Ndiaye_Degroof Petercam.pptxFinTech Belgium
 
The Economic History of the U.S. Lecture 23.pdf
The Economic History of the U.S. Lecture 23.pdfThe Economic History of the U.S. Lecture 23.pdf
The Economic History of the U.S. Lecture 23.pdfGale Pooley
 
Solution Manual for Principles of Corporate Finance 14th Edition by Richard B...
Solution Manual for Principles of Corporate Finance 14th Edition by Richard B...Solution Manual for Principles of Corporate Finance 14th Edition by Richard B...
Solution Manual for Principles of Corporate Finance 14th Edition by Richard B...ssifa0344
 
Malad Call Girl in Services 9892124323 | ₹,4500 With Room Free Delivery
Malad Call Girl in Services  9892124323 | ₹,4500 With Room Free DeliveryMalad Call Girl in Services  9892124323 | ₹,4500 With Room Free Delivery
Malad Call Girl in Services 9892124323 | ₹,4500 With Room Free DeliveryPooja Nehwal
 
The Economic History of the U.S. Lecture 18.pdf
The Economic History of the U.S. Lecture 18.pdfThe Economic History of the U.S. Lecture 18.pdf
The Economic History of the U.S. Lecture 18.pdfGale Pooley
 
VIP Kolkata Call Girl Serampore 👉 8250192130 Available With Room
VIP Kolkata Call Girl Serampore 👉 8250192130  Available With RoomVIP Kolkata Call Girl Serampore 👉 8250192130  Available With Room
VIP Kolkata Call Girl Serampore 👉 8250192130 Available With Roomdivyansh0kumar0
 
OAT_RI_Ep19 WeighingTheRisks_Apr24_TheYellowMetal.pptx
OAT_RI_Ep19 WeighingTheRisks_Apr24_TheYellowMetal.pptxOAT_RI_Ep19 WeighingTheRisks_Apr24_TheYellowMetal.pptx
OAT_RI_Ep19 WeighingTheRisks_Apr24_TheYellowMetal.pptxhiddenlevers
 
Instant Issue Debit Cards - School Designs
Instant Issue Debit Cards - School DesignsInstant Issue Debit Cards - School Designs
Instant Issue Debit Cards - School Designsegoetzinger
 

Recently uploaded (20)

(ANIKA) Budhwar Peth Call Girls Just Call 7001035870 [ Cash on Delivery ] Pun...
(ANIKA) Budhwar Peth Call Girls Just Call 7001035870 [ Cash on Delivery ] Pun...(ANIKA) Budhwar Peth Call Girls Just Call 7001035870 [ Cash on Delivery ] Pun...
(ANIKA) Budhwar Peth Call Girls Just Call 7001035870 [ Cash on Delivery ] Pun...
 
Booking open Available Pune Call Girls Shivane 6297143586 Call Hot Indian Gi...
Booking open Available Pune Call Girls Shivane  6297143586 Call Hot Indian Gi...Booking open Available Pune Call Girls Shivane  6297143586 Call Hot Indian Gi...
Booking open Available Pune Call Girls Shivane 6297143586 Call Hot Indian Gi...
 
High Class Call Girls Nagpur Grishma Call 7001035870 Meet With Nagpur Escorts
High Class Call Girls Nagpur Grishma Call 7001035870 Meet With Nagpur EscortsHigh Class Call Girls Nagpur Grishma Call 7001035870 Meet With Nagpur Escorts
High Class Call Girls Nagpur Grishma Call 7001035870 Meet With Nagpur Escorts
 
Call Girls Service Nagpur Maya Call 7001035870 Meet With Nagpur Escorts
Call Girls Service Nagpur Maya Call 7001035870 Meet With Nagpur EscortsCall Girls Service Nagpur Maya Call 7001035870 Meet With Nagpur Escorts
Call Girls Service Nagpur Maya Call 7001035870 Meet With Nagpur Escorts
 
The Economic History of the U.S. Lecture 30.pdf
The Economic History of the U.S. Lecture 30.pdfThe Economic History of the U.S. Lecture 30.pdf
The Economic History of the U.S. Lecture 30.pdf
 
20240417-Calibre-April-2024-Investor-Presentation.pdf
20240417-Calibre-April-2024-Investor-Presentation.pdf20240417-Calibre-April-2024-Investor-Presentation.pdf
20240417-Calibre-April-2024-Investor-Presentation.pdf
 
VIP Call Girls Service Dilsukhnagar Hyderabad Call +91-8250192130
VIP Call Girls Service Dilsukhnagar Hyderabad Call +91-8250192130VIP Call Girls Service Dilsukhnagar Hyderabad Call +91-8250192130
VIP Call Girls Service Dilsukhnagar Hyderabad Call +91-8250192130
 
02_Fabio Colombo_Accenture_MeetupDora&Cybersecurity.pptx
02_Fabio Colombo_Accenture_MeetupDora&Cybersecurity.pptx02_Fabio Colombo_Accenture_MeetupDora&Cybersecurity.pptx
02_Fabio Colombo_Accenture_MeetupDora&Cybersecurity.pptx
 
Russian Call Girls In Gtb Nagar (Delhi) 9711199012 💋✔💕😘 Naughty Call Girls Se...
Russian Call Girls In Gtb Nagar (Delhi) 9711199012 💋✔💕😘 Naughty Call Girls Se...Russian Call Girls In Gtb Nagar (Delhi) 9711199012 💋✔💕😘 Naughty Call Girls Se...
Russian Call Girls In Gtb Nagar (Delhi) 9711199012 💋✔💕😘 Naughty Call Girls Se...
 
20240429 Calibre April 2024 Investor Presentation.pdf
20240429 Calibre April 2024 Investor Presentation.pdf20240429 Calibre April 2024 Investor Presentation.pdf
20240429 Calibre April 2024 Investor Presentation.pdf
 
CALL ON ➥8923113531 🔝Call Girls Gomti Nagar Lucknow best sexual service
CALL ON ➥8923113531 🔝Call Girls Gomti Nagar Lucknow best sexual serviceCALL ON ➥8923113531 🔝Call Girls Gomti Nagar Lucknow best sexual service
CALL ON ➥8923113531 🔝Call Girls Gomti Nagar Lucknow best sexual service
 
03_Emmanuel Ndiaye_Degroof Petercam.pptx
03_Emmanuel Ndiaye_Degroof Petercam.pptx03_Emmanuel Ndiaye_Degroof Petercam.pptx
03_Emmanuel Ndiaye_Degroof Petercam.pptx
 
The Economic History of the U.S. Lecture 23.pdf
The Economic History of the U.S. Lecture 23.pdfThe Economic History of the U.S. Lecture 23.pdf
The Economic History of the U.S. Lecture 23.pdf
 
Solution Manual for Principles of Corporate Finance 14th Edition by Richard B...
Solution Manual for Principles of Corporate Finance 14th Edition by Richard B...Solution Manual for Principles of Corporate Finance 14th Edition by Richard B...
Solution Manual for Principles of Corporate Finance 14th Edition by Richard B...
 
Malad Call Girl in Services 9892124323 | ₹,4500 With Room Free Delivery
Malad Call Girl in Services  9892124323 | ₹,4500 With Room Free DeliveryMalad Call Girl in Services  9892124323 | ₹,4500 With Room Free Delivery
Malad Call Girl in Services 9892124323 | ₹,4500 With Room Free Delivery
 
The Economic History of the U.S. Lecture 18.pdf
The Economic History of the U.S. Lecture 18.pdfThe Economic History of the U.S. Lecture 18.pdf
The Economic History of the U.S. Lecture 18.pdf
 
VIP Kolkata Call Girl Serampore 👉 8250192130 Available With Room
VIP Kolkata Call Girl Serampore 👉 8250192130  Available With RoomVIP Kolkata Call Girl Serampore 👉 8250192130  Available With Room
VIP Kolkata Call Girl Serampore 👉 8250192130 Available With Room
 
OAT_RI_Ep19 WeighingTheRisks_Apr24_TheYellowMetal.pptx
OAT_RI_Ep19 WeighingTheRisks_Apr24_TheYellowMetal.pptxOAT_RI_Ep19 WeighingTheRisks_Apr24_TheYellowMetal.pptx
OAT_RI_Ep19 WeighingTheRisks_Apr24_TheYellowMetal.pptx
 
Veritas Interim Report 1 January–31 March 2024
Veritas Interim Report 1 January–31 March 2024Veritas Interim Report 1 January–31 March 2024
Veritas Interim Report 1 January–31 March 2024
 
Instant Issue Debit Cards - School Designs
Instant Issue Debit Cards - School DesignsInstant Issue Debit Cards - School Designs
Instant Issue Debit Cards - School Designs
 

Interglobe aviation ltd. ipo update

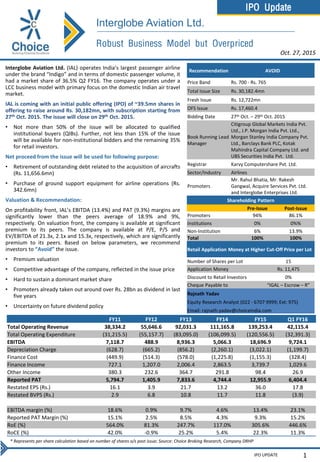
  • 1. IPO Update IPO UPDATE Robust Business Model but Overpriced Interglobe Aviation Ltd. (IAL) operates India’s largest passenger airline under the brand “Indigo” and in terms of domestic passenger volume, it had a market share of 36.5% Q2 FY16. The company operates under a LCC business model with primary focus on the domestic Indian air travel market. IAL is coming with an initial public offering (IPO) of ~39.5mn shares in offering to raise around Rs. 30,182mn, with subscription starting from 27th Oct. 2015. The issue will close on 29th Oct. 2015. • Not more than 50% of the issue will be allocated to qualified institutional buyers (QIBs). Further, not less than 15% of the issue will be available for non-institutional bidders and the remaining 35% for retail investors. Net proceed from the issue will be used for following purpose: • Retirement of outstanding debt related to the acquisition of aircrafts (Rs. 11,656.6mn) • Purchase of ground support equipment for airline operations (Rs. 342.6mn) Valuation & Recommendation: On profitability front, IAL’s EBITDA (13.4%) and PAT (9.3%) margins are significantly lower than the peers average of 18.9% and 9%, respectively. On valuation front, the company is available at significant premium to its peers. The company is available at P/E, P/S and EV/EBITDA of 21.3x, 2.1x and 15.3x, respectively, which are significantly premium to its peers. Based on below parameters, we recommend investors to “Avoid” the issue. • Premium valuation • Competitive advantage of the company, reflected in the issue price • Hard to sustain a dominant market share • Promoters already taken out around over Rs. 28bn as dividend in last five years • Uncertainty on future dividend policy 1 Oct. 27, 2015 Recommendation AVOID Price Band Rs. 700 - Rs. 765 Total Issue Size Rs. 30,182.4mn Fresh Issue Rs. 12,722mn OFS Issue Rs. 17,460.4 Bidding Date 27th Oct. – 29th Oct. 2015 Book Running Lead Manager Citigroup Global Markets India Pvt. Ltd., J.P. Morgan India Pvt. Ltd., Morgan Stanley India Company Pvt. Ltd., Barclays Bank PLC, Kotak Mahindra Capital Company Ltd. and UBS Securities India Pvt. Ltd. Registrar Karvy Computershare Pvt. Ltd. Sector/Industry Airlines Promoters Mr. Rahul Bhatia, Mr. Rakesh Gangwal, Acquire Services Pvt. Ltd. and Interglobe Enterprises Ltd. Shareholding Pattern Pre-Issue Post-Issue Promoters 94% 86.1% Institutions 0% 0%% Non-Institution 6% 13.9% Total 100% 100% Retail Application Money at Higher Cut-Off Price per Lot Number of Shares per Lot 15 Application Money Rs. 11,475 Discount to Retail Investors 0% Cheque Payable to “IGAL – Escrow – R” Rajnath Yadav Equity Research Analyst (022 - 6707 9999; Ext: 975) Email: rajnath.yadav@choiceindia.com Interglobe Aviation Ltd. * Represents per share calculation based on number of shares o/s post issue; Source: Choice Broking Research, Company DRHP FY11 FY12 FY13 FY14 FY15 Q1 FY16 Total Operating Revenue 38,334.2 55,646.6 92,031.3 111,165.8 139,253.4 42,115.4 Total Operating Expenditure (31,215.5) (55,157.7) (83,095.0) (106,099.5) (120,556.5) (32,391.3) EBITDA 7,118.7 488.9 8,936.3 5,066.3 18,696.9 9,724.1 Depreciation Charge (628.7) (665.2) (856.2) (2,260.1) (3,022.1) (1,199.7) Finance Cost (449.9) (514.3) (578.0) (1,225.8) (1,155.3) (328.4) Finance Income 727.1 1,207.0 2,006.4 2,863.5 3,739.7 1,029.6 Other Income 380.3 232.6 364.7 291.8 98.4 26.9 Reported PAT 5,794.7 1,405.9 7,833.6 4,744.4 12,955.9 6,404.4 Restated EPS (Rs.) 16.1 3.9 21.7 13.2 36.0 17.8 Restated BVPS (Rs.) 2.9 6.8 10.8 11.7 11.8 (3.9) EBITDA margin (%) 18.6% 0.9% 9.7% 4.6% 13.4% 23.1% Reported PAT Margin (%) 15.1% 2.5% 8.5% 4.3% 9.3% 15.2% RoE (%) 564.0% 81.3% 247.7% 117.0% 305.6% 446.6% RoCE (%) 42.0% -0.9% 25.2% 5.4% 22.3% 11.3%
  • 2. IPO Update IPO UPDATE 2 Indian Air Travel Market Overview: According to a report from Center for Asia Pacific Aviation India Pvt. Ltd. (CAPA), India is one of the world’s largest and fastest-growing air travel markets. Historically, the Indian air travel market was comprised of individuals in relatively high income brackets as well as corporate travellers. But since the liberalization in the air travel market, a number of low cost carriers (LCC) have entered the market and stimulated prices through their low-cost business models. In the decade that followed, Indian air travel entered a period of considerable growth registering a growth of 19.4% CAGR over FY04-10. By CY14, India’s air travel market had become the sixth largest in the world as measured by total domestic seats (97.3mn) and ninth largest in the world by total domestic and international seats (155.9mn). Going forward, the Indian air travel market is expected to enter a period of accelerated growth and between FY15 and FY20, domestic available seat kilometer (ASK) are forecast to grow at a CAGR of 12.7%, while domestic passenger volume is forecast to grow at a CAGR of 12.8% (Source: Company DRHP). According to the CAPA report, the period of accelerated growth is expected to be driven by numerous factors, which includes: • Strong economic growth • Continued population growth • Expansion of the middle class • Strong growth in tourism • Rail travel substitution • Increasing aircraft penetration from currently low penetration levels • Expansion in aviation infrastructure and • An increasingly favorable regulatory environment Source: Choice Broking Research, Company DRHP Source: Choice Broking Research, Company DRHP Domestic Available Seat Kilometers Forecast (bn) Domestic Passengers Forecast (mn) 84.9 92.8 103.4 119.7 138.0 154.4 80 100 120 140 160 FY15 FY16E FY17E FY18E FY19E FY20E 70.0 81.0 92.0 103.0 115.0 128.0 60 70 80 90 100 110 120 130 FY15 FY16E FY17E FY18E FY19E FY20E Oct. 27, 2015 Interglobe Aviation Ltd.
  • 3. IPO Update IPO UPDATE 3 Company Introduction: Interglobe Aviation Ltd. (IAL) operates India’s largest passenger airline under the brand “Indigo” and in terms of domestic passenger volume, it had a market share of 39.8% and 36.5% in Q1 FY16 and Q2 FY16, respectively. The company operates under a LCC business model with primary focus on the domestic Indian air travel market. IAL aims to maintain its cost advantage and high frequency of flights while striving to fulfil its simple brand message of providing “low fares, on-time flights and a hassle-free experience” to its passengers. The company enjoyed the position of being the 7th largest LCC globally in terms of seat capacity for FY15 as per CAPA. IAL began its operations in August 2006 with a single aircraft and over the period till 31 Aug. 2015, it has expanded to 97 aircrafts all of which are Airbus A320’s. The company currently has an order book of 430 A320neo aircrafts, of which it expects to take delivery of 9 of these by the end of FY16. As on 31 Aug. 2015, the average age of its fleet was 3.7 years, which according to CAPA is the second youngest average fleet age in India and one of the youngest LCC fleet globally. As on 31 Aug. 2015, IAL operated its scheduled services from 33 airports in India, with a maximum of 603 domestic flights per day. The company enjoyed the highest market share in each of the top five domestic routes in India by traffic in FY15 as well as operated the most passenger flights during the FY15 winter season in India according to CAPA. With prime focus on Indian domestic air market, IAL reported a domestic passenger volume of 23.7mn in FY15 as against 9.5mn in FY11, representing a growth of 25.8% CAGR over FY11-15. During the same period, the domestic passenger volume market share also increased from 17.6% in FY11 to 33.9% in FY15. As per the Directorate General of Civil Aviation (DGCA), the company had the second highest load factor on domestic scheduled services and also received the second lowest level of complaints per 10000 passengers in FY15. Source: Choice Broking Research, Company DRHP Source: Choice Broking Research, Company DRHP IAL's Domestic Passenger Volume (mn) IAL's Domestic Passenger Volume Market Share (%) 9.5 12.3 15.7 18.1 23.7 7.8 6 9 12 15 18 21 24 FY11 FY12 FY13 FY14 FY15 Q1 FY16 17.6% 20.3% 27.3% 29.8% 33.9% 39.8% 36.5% 17% 23% 29% 35% 41% FY11 FY12 FY13 FY14 FY15 Q1 FY16 Q2 FY16 Oct. 27, 2015 Interglobe Aviation Ltd.
  • 4. IPO Update IPO UPDATE 4 Competitive Strengths and Strategies: • The largest domestic passenger airline in India and will continue to focus on enhancing its market position: IAL is the domestic market leader in India, which is one of the largest and fastest growing aviation markets in the world, with a market share of 36.5% as of 30 Sept. 2015. The company operated scheduled services to 33 airports in India with a maximum of 603 domestic flights per day as of August 31, 2015. It has the highest market share in the top 5 domestic routes in India and intends to continue to strengthen the density of its network by adding flights to existing key markets and selectively adding routes and destination to enhance the breadth of its services in a sustainable and profitable manner. • Maintain disciplined execution of the low-cost carrier business model: IAL’s disciplined execution of low cost carrier principles helps it to maintain low operating costs, this strategy helps it to maintain an advantage over other LCC competitors in India who operate an hybrid business model between low-costs and full-service airlines. The company employs a single aircraft type which helps it to reduce expenses related to maintenance, spare parts etc. IAL’s aircraft utilization was among the highest of any airlines in FY15. The company operates a point to point route network with no code-sharing with other airlines for passenger traffic, reducing turnaround time. Its operational reliability was 99.95% in FY15 as well as the five months ended 31 Aug. 2015 (according to Airbus). IAL intends to reduce its distribution cost by increasing direct sales via its websites, airports, call centre and mobile app and scaling down commissions to online and traditional travel agents. As a percent of operating revenue, ancillary revenues of the company is substantially lower than most international LCC’s. IAL plans to enhance its existing as well as introducing new streams of ancillary revenue upon obtaining regulatory approvals. • Structural cost advantage which is expected to be sustained: Magnitude of 2005, 2011 and 2015 aircraft orders helped IAL to negotiate favourable terms with Airbus and other aircraft-related suppliers and service providers thereby reducing the overall costs associated with the acquisition, maintenance and operation of its aircrafts. The company maintains a young fleet by predominantly entering into short term sale-and-leaseback operating leases for the aircrafts purchased from Airbus, ranging from 3-6 years. As of 31 Aug. 2015, the average age of its fleet is 3.7 years. The young fleet helps it to achieve better reliability in terms of performance, lower maintenance costs, improved fuel-efficiency, higher flight dispatch reliability and higher passenger appeal. The A320neo aircrafts which are expected to be delivered from 2015 onwards are expected to provide 15% fuel savings, thereby reducing the fuel consumption as these aircrafts enter the fleet. • Award winning service and Strong brand recognition: IAL has been awarded the “Best Low-cost Airline in Central Asia & India” at the SkyTrax World Airline Awards for 6 consecutive years from 2010-15. It was also recognized as India’s favourite airline for 2012, 2013 and 2014 by TripAdvisor’s Annual India Air Travel Survey. The company has achieved recognition of its “Indigo” brand through its simple brand message of “providing low fares, on-time flights and a hassle- free experience” to its passengers. Sales promotion and advertising expense accounted for less than 1% of its total expenses for the three months ended June 30, 2015 and in FY15. • Consistent Profitability and strong cash flow generation, balance sheet and liquidity position: According to CAPA, IAL is the only Indian carrier to consistently remain profitable for the last seven fiscal years ending in FY15. A strong balance sheet position, provides it a flexibility to fund future growth and not be constrained by reliance on non-aircraft financing sources. Strong cash flows from operations for the seven fiscal years from 2009-15, has enabled to further invest in its business and pay dividends to shareholders in four of the past five fiscals ending FY15. Strong liquidity position insulates the company from sudden decline in Air demand or spikes in aircraft fuel prices. The liquidity position also enables the purchase of imported fuel which requires advance payments and is cheaper than fuels purchased domestically and also make payments to suppliers on time thereby benefiting from supplier discounts. Oct. 27, 2015 Interglobe Aviation Ltd.
  • 5. IPO Update IPO UPDATE 5 Competitive Strengths and Strategies (Contd….): • Attract and retain talented employees and management and leverage the strength of its promoters: IAL has been ranked among the top companies to work for in India in 2015 for the eight consecutive year. They have been able to hire sufficient pilots to facilitate its expansion, and currently have an average of 16 pilots per aircraft as of 31 Aug. 2015. The management team has a strong background in leading global airlines, hospitality and travel-related business. They also have the capability to expand business in accordance with the business model. The management team has successfully guided the airline through industry down cycles and periods of fuel price and exchange rate volatility. • Robust financial performance: On the back of 24.6% and 29.7% CAGR increase in feet size and available seat kilometer over FY11-15, IAL reported a top-line growth of 38.1% CAGR to Rs. 139,253.4mn. Total operating expenditure increased by 40.2%, mainly due to higher fuel cost, which forms around 50% of the total operating cost. Consequently, during the same period, EBITDA increased by 27.3% with over 5ppts contraction in margin. Depreciation and finance charge increased with the increase in fleet size. Finance income increased by 50.6% CAGR over FY11-15, resulting into a 22.3% CAGR rise in reported profit to Rs. 12,955.9mn. During the period, EBITDAR of the company increased by 34.8% CAGR to Rs. 38,317.6mn. With significant profitability, IAL in last three out of five years have rewarded its shareholders with hefty dividend, which stood in the range of Rs. 15-45 per share. During Q1 FY16, the company reported a bottom-line of Rs. 6,404.4mn on a top-line of Rs. 42,115.4mn. IAL paid an interim dividend of Rs. 11,026.5mn, however, due to insufficient cash flow, the networth went negative. Taking into consideration, the future anticipated cash flow generation ability, we expect the company will return to its positive networth position. Source: Choice Broking Research, Company DRHP Source: Choice Broking Research, Company DRHP Annual Financial Performance 38.3 55.6 92.0 111.2 139.3 42.1 30.3% 15.7% 24.8% 19.8% 27.5% 37.4% 15.1% 2.5% 8.5% 4.3% 9.3% 15.2% 0% 5% 10% 15% 20% 25% 30% 35% 40% 30 60 90 120 150 FY11 FY12 FY13 FY14 FY15 Q1 FY16 Total Operating Income (Rs. bn) EBITDAR Margin (%) Reported PAT Margin (%) 2.9 6.8 10.8 11.7 11.8 (3.9) 564.0% 81.3% 247.7% 117.0% 305.6% 446.6% 42.0% -0.9% 25.2% 5.4% 22.3% 11.3% -100% 0% 100% 200% 300% 400% 500% 600% (5) 0 5 10 15 20 25 30 35 40 FY11 FY12 FY13 FY14 FY15 Q1 FY16 Restated EPS (Rs.) Restated BVPS (Rs.) RoE (%) RoCE (%) Oct. 27, 2015 Interglobe Aviation Ltd.
  • 6. IPO Update IPO UPDATE 6 Risk and Concerns: • Highly competitive airline industry and competition from Indian railways: IAL faces competition from both low-cost airlines as well as full service carriers that service the same routes. The principal competitors include AirAsia India, Air India, Go Air, Jet Airways, SpiceJet and Vistara as well as potential new entrants. The intensity of competition varies from route to route and a number of factors including the strength of the competing airlines. Indian railways, which offers a cheaper alternate mode of transportation than airlines will be a stiff source of competition given the Indian Governments initiatives to introduce high speed rails as they are likely to attract the Indian middle class who are the current and targeted passengers of the company. • Maintaining a profitable route portfolio: IAL considers a number of factors when selecting its route which include ability to sustain high passenger load factors and high aircraft utilization rates. The company’s aircraft utilization rate was the highest in FY15, according to CAPA. Selecting and flying good routes, competing effectively and handling aircraft and passengers effectively are crucial for the successful performance of its airline operations and as a result its financial condition. • Uncertain fuel expense: Aircraft fuel is a major component of cost for airlines. The cost of IAL’s aircraft fuel as a percentage of its total expenses was 47.1%, 51%, 51%, 50.3%, 46.1% and 39.7% for FY11, FY12, FY13, FY14, FY15 and Q1 FY16. The cost of aircraft fuel cannot be predicted with any degree of certainty. Any unfavourable spikes in the oil prices can affect the financial position of the company substantially. • Unfavorable leasing conditions would affect the working capital requirements: IAL as of 30 June, 2015 stated that it has not borrowed any additional money for its working capital and all the working capital requirements have been funded from the company’s strong cash flows and incentives received from the lessors. However, unfavorable leasing conditions could put pressure on the operating cash flows which could lead to the company borrowing money for funding its working capital requirements. • No clarity on the future dividend policy: During FY11-15, IAL promoters have taken out Rs. 28,204.4mn as dividend on a net profit of Rs. 32,734.4mn. This translates into a dividend per share of Rs. 15-45 per share. Moreover, during Q1 FY16, the company has paid an interim dividend of Rs. 11,026.5mn. No clarity from IAL on the future dividend policy, will be negative for the investors, who are investing in the IPO with the intention to benefit from the hefty dividend payments. Oct. 27, 2015 Interglobe Aviation Ltd.
  • 7. IPO Update IPO UPDATE 7 Peer Comparison: There are no profitable listed peers in the domestic market. We have compared IAL with global LCC players. On profitability front, the company’s EBITDA (13.4%) and PAT (9.3%) margins are significantly lower than the peers average of 18.9% and 9%, respectively. However, RoE and RoCE of IAL is higher than the peers. On valuation front, the company is available at significant premium to its peers. The company is available at P/E, P/S and EV/EBITDA of 21.3x, 2.1x and 15.3x, respectively, which are significantly premium to its peers. Based on below parameters, we recommend investors to “Avoid” the issue. • Premium valuation • Competitive advantage of the company, reflected in the issue price • To hard to sustain a dominant market share • Promoters already taken out around over Rs. 28bn as dividend in last five years • Uncertainty on future dividend policy Company Name Currency CMP (Rs.) MCAP (Rs. mn) Total Operating Revenue (Rs. mn) EBITDA Margin (%) Reported PAT Margin (%) Interglobe Aviation Ltd. INR 765 275,665 139,253 13.4% 9.3% Jet Airways (India) Ltd INR 399 45,298 209,656 -0.4% -10.0% Spicejet Ltd. INR 42 25,059 46,224 -9.7% -10.6% Air Arabia PJSC AED 1.41 6,580 3,733.30 24.0% 14.4% AirAsia Berhad MYR 1.52 4,230 5,416.80 29.5% -0.6% Cebu Pacific PHP 87.40 52,964 54,788.80 21.8% 5.3% Gol Linhas Aereas Inteligentes S.A. USD 0.92 187 9,989.10 7.9% -20.4% JetBlue Airways Corp USD 24.97 7,861 6,110.00 20.0% 7.7% Pegasus Hava Tasimaciligi AS TRY 19.10 1,954 3,186.30 11.9% 3.8% Southwest Airlines Co. USD 45.23 29,825 19,471.00 23.9% 11.1% Spirit Airlines Inc. USD 39.79 2,901 2,041.00 23.4% 13.1% Thai Airways International Public Co. Ltd. THB 10.50 22,919 188,646.10 6.9% 7.2% WestJet Airlines Ltd. CAD 24.89 2,673 4,029.60 19.7% 9.4% Company Name BVPS (Rs.) DPS (Rs.) Debt Equity Ratio RoE (%) RoCE (%) P / E (x) P / B (x) EV / Sales (x) EV / EBITDA (x) Interglobe Aviation Ltd. 11.8 0.1 8.4 305.6% 22.3% 21.3 64.7 2.1 15.3 Jet Airways (India) Ltd (556.8) (0.0) (1.9) 33.1% 211.0% (2.2) (0.7) 0.7 (171.4) Spicejet Ltd. (21.1) 0.0 (1.1) 38.8% 282.7% (5.1) (2.0) 0.8 (8.7) Air Arabia PJSC 1.09 0.09 0.61 10.6% 9.0% 12.27 1.30 2.17 9.04 AirAsia Berhad 1.64 0.04 2.79 -0.7% 8.1% (137.01) 0.93 2.99 10.12 Cebu Pacific 35.54 1.00 1.57 13.4% 13.0% 18.41 2.46 1.51 6.94 Gol Linhas Aereas Inteligentes S.A. (1.64) 0.00 (18.72) 612.8% 20.3% (0.09) (0.56) 0.42 5.34 JetBlue Airways Corp 8.03 0.00 0.72 18.5% 16.0% 16.82 3.11 1.47 7.36 Pegasus Hava Tasimaciligi AS 11.35 0.00 1.17 10.3% 8.2% 16.31 1.68 0.77 6.45 Southwest Airlines Co. 10.27 0.27 0.36 32.0% 29.3% 13.75 4.40 1.50 6.30 Spirit Airlines Inc. 13.76 0.00 0.14 26.7% 35.7% 10.82 2.89 1.18 5.03 Thai Airways International Public Co. Ltd. 18.92 0.00 4.40 32.8% -4.0% 1.69 0.56 0.96 13.93 WestJet Airlines Ltd. 16.55 0.61 0.58 21.3% 17.0% 7.06 1.50 0.58 2.95 Source: Choice Broking Research, Company DRHP Source: Choice Broking Research, Company DRHP Oct. 27, 2015 Interglobe Aviation Ltd.
  • 8. IPO Update IPO UPDATE 8 Consolidated Financial Statements: Source: Choice Broking Research, Company DRHP Source: Choice Broking Research, Company DRHP Consolidated Profit and Loss Statement Particulars (Rs. mn) FY11 FY12 FY13 FY14 FY15 Q1 FY16 Revenue from Operations 38,334.2 55,646.6 92,031.3 111,165.8 139,253.4 42,115.4 Aircraft Fuel Expenses (15,213.3) (28,735.9) (43,126.3) (55,133.5) (57,484.9) (13,477.3) Aircraft and Engine Rentals (6,372.4) (10,634.4) (17,149.5) (20,310.3) (23,075.5) (6,904.5) Less: Cash and Non-Cash Incentives 2,273.9 2,627.3 3,588.0 3,607.2 3,553.1 887.7 Purchase of Stock in Trade (190.9) (341.8) (559.9) (584.0) (817.1) (231.9) Changes in Inventories of SIT 1.1 6.8 18.7 (7.1) 31.7 2.2 Employee Benefits Expense (2,930.2) (5,118.6) (6,904.5) (9,205.5) (11,886.9) (3,825.1) Other Expenses (8,783.7) (12,961.0) (18,961.4) (24,466.3) (30,877.0) (8,842.4) EBITDA 7,118.7 488.9 8,936.4 5,066.3 18,696.9 9,724.1 Depreciation and Amortization (628.7) (665.2) (856.2) (2,260.1) (3,022.1) (1,199.7) EBIT 6,490.0 (176.3) 8,080.2 2,806.3 15,674.7 8,524.5 Finance Cost (449.9) (514.3) (578.0) (1,225.8) (1,155.3) (328.4) Finance Income 727.1 1,207.0 2,006.4 2,863.5 3,739.7 1,029.6 Other Income 380.3 232.6 364.7 291.8 98.4 26.9 EBT 7,147.5 749.0 9,873.2 4,735.8 18,357.5 9,252.7 Tax Expenses (1,352.9) 656.9 (2,039.6) 8.6 (5,401.6) (2,848.4) Reported PAT 5,794.7 1,405.9 7,833.6 4,744.4 12,955.9 6,404.4 Consolidated Balance Sheet Particulars (Rs. mn) FY11 FY12 FY13 FY14 FY15 Q1 FY16 Share Capital 343.7 343.7 343.7 343.7 343.7 3,437.2 Reserves and Surplus 683.7 2,089.6 3,546.8 3,873.7 3,918.5 (4,831.0) Deferred Tax Liabilities (Net) 0.0 0.0 537.2 528.6 4,091.4 4,177.6 Long-Term Borrowings 8,069.8 9,055.5 16,173.3 30,807.4 35,884.0 35,667.2 Other Long-Term Liabilities 1,014.6 2,793.8 7,234.8 12,957.9 20,169.5 21,976.5 Long-Term Provisions 133.8 158.3 231.6 368.3 522.9 548.3 Deferred Incentives 4,678.2 8,748.4 11,677.5 13,654.3 13,317.4 12,294.5 Short-Term Borrowings 540.3 305.6 814.3 0.0 0.0 0.0 Trade Payables 1,076.2 1,584.8 2,647.9 3,827.6 4,754.8 5,771.1 Other Current Liabilities 4,624.9 8,149.0 11,383.3 16,149.4 19,008.0 17,660.8 Short-Term Provision 5,808.6 186.5 307.9 4,645.1 1,528.5 4,880.2 Deferred Incentives 2,220.8 3,055.4 3,626.6 3,878.4 4,199.0 4,172.2 Total Liabilities 29,194.5 36,470.6 58,524.9 91,034.4 107,737.7 105,754.4 Tangible Fixed Assets 8,310.1 8,813.1 17,547.9 39,407.2 48,664.0 48,318.4 Intangible Fixed Assets 1.3 47.0 96.7 152.5 96.4 106.3 Capital Work in Progress 0.0 0.0 68.5 0.0 4.5 6.1 Non-Current Investments 0.0 0.0 0.4 0.5 0.5 0.5 Deferred Tax Asset (Net) 8.2 665.1 0.0 0.0 0.0 0.0 Long-Term Loans and Advances 1,268.7 2,973.1 5,247.0 8,012.1 11,236.6 11,536.0 Other Non-Current Assets 119.0 885.3 4,857.7 14,315.2 16,055.6 15,100.0 Current Investments 8,022.4 5,234.2 11,383.4 12,714.8 5,167.5 0.0 Inventories 446.7 373.9 522.8 672.9 1,305.5 1,683.7 Trade Receivables 166.6 389.2 685.2 891.2 1,045.5 1,172.5 Cash and Bank Balances 7,756.9 13,088.3 13,405.9 11,015.3 19,993.8 22,694.2 Short-Term Loans and Advances 2,491.3 3,179.5 3,586.6 2,231.3 1,555.6 2,113.6 Other Current Assets 603.2 822.0 1,123.0 1,621.4 2,612.2 3,023.2 Total Assets 29,194.5 36,470.6 58,524.9 91,034.4 107,737.7 105,754.4 Oct. 27, 2015 Interglobe Aviation Ltd.
  • 9. IPO Update IPO UPDATE 9 Consolidated Financial Statements (Contd…): Source: Choice Broking Research, Company DRHP Cash Flow Statement Particulars (Rs. mn) FY11 FY12 FY13 FY14 FY15 Q1 FY16 PBT 7,147.5 749.0 9,873.2 4,735.8 18,357.5 9,252.7 Depreciation and Amortisation Expenses 628.7 665.2 856.2 2,260.1 3,022.1 1,199.7 Interest Expense 143.5 144.0 178.9 192.9 107.3 25.2 Interest Income on Fixed Deposits (333.4) (804.4) (1,419.6) (1,868.6) (2,703.8) (815.9) Dividend from Current Investments (382.6) (384.3) (328.8) (355.7) 0.0 0.0 Others 238.2 423.2 408.4 863.9 1,241.8 1,578.0 Change in Working Capital 2,600.1 8,535.0 9,696.3 11,202.1 7,765.2 (2,009.5) Taxes Paid (1,322.2) (371.1) (1,851.5) (1,075.4) (3,951.2) (491.1) Cash Flow from Operating Activities 8,719.8 8,956.7 17,413.0 15,955.0 23,838.8 8,739.0 Purchase of Fixed Assets (2,133.1) (331.7) (9,155.7) (23,241.7) (10,171.2) (338.2) Deposits Made with Banks (4,749.9) (3,983.6) (5,288.9) (6,856.0) (9,121.9) (3,070.6) Proceeds from Sale of Fixed Assets 1,657.0 0.7 2.6 4.6 1.6 0.6 Purchase of Mutual Funds / Shares (106,291.9) (45,218.8) (64,831.1) (71,175.8) (65,074.5) (16,915.0) Proceeds from Sale of Mutual Funds 104,851.5 48,025.4 58,939.5 70,483.5 73,657.7 22,296.3 Interest Received 200.5 657.3 1,107.9 1,292.0 1,303.1 197.9 Dividend Received 382.6 384.3 328.8 355.7 0.0 0.0 Cash Flow Operating Activities (6,083.4) (466.5) (18,896.9) (29,137.8) (9,405.1) 2,171.0 Proceeds from Secured Loans 3,428.2 2,935.0 10,301.5 18,153.3 8,137.5 0.0 Repayment of Secured Loans (3,690.6) (2,475.7) (3,032.0) (4,515.8) (4,320.3) (1,109.9) Repayment of Unsecured Loans 0.0 (678.6) 0.0 0.0 0.0 0.0 Interest Paid (143.5) (144.0) (169.1) (185.9) (100.5) (48.4) Finance Lease Charges Paid (302.4) (312.7) (363.1) (603.2) (669.7) (170.8) Repayment of Share Capital (2,012.4) 0.0 0.0 0.0 0.0 0.0 Dividend Paid 0.0 (4,904.3) (5,486.4) 0.0 (13,575.3) (11,026.5) Tax Paid on Dividends 0.0 (795.6) (890.0) 0.0 (2,552.8) 0.0 Cash Flow from Financing Activities (2,720.7) (6,376.0) 360.8 12,848.4 (13,081.1) (12,355.5) Net Cash Flow (84.3) 2,114.3 (1,123.0) (334.3) 1,352.7 (1,445.5) Opening Balance of Cash and Cash Equivalents 540.3 456.0 2,574.7 1,445.5 1,106.4 2,467.5 Closing Balance of Cash and Cash Equivalents 456.0 2,570.3 1,451.6 1,111.2 2,459.1 1,022.0 Oct. 27, 2015 Interglobe Aviation Ltd.
  • 10. IPO Update IPO UPDATE 10 Financial Statements (Contd…): * Represents per share calculation based on number of shares o/s post issue; Source: Choice Broking Research, Company DRHP Consolidated Financial Ratios Particulars (Rs. mn) FY11 FY12 FY13 FY14 FY15 Q1 FY16 Revenue Growth Rate (%) 45.2% 65.4% 20.8% 25.3% -69.8% EBIDTA Growth Rate (%) -93.1% 1727.7% -43.3% 269.0% -48.0% EBIDTA Margin (%) 18.6% 0.9% 9.7% 4.6% 13.4% 23.1% EBIT Growth Rate (%) -102.7% -4683.4% -65.3% 458.6% -45.6% EBIT Margin (%) 16.9% -0.3% 8.8% 2.5% 11.3% 20.2% Reported PAT Growth Rate (%) -75.7% 457.2% -39.4% 173.1% -50.6% Reported PAT Margin (%) 15.1% 2.5% 8.5% 4.3% 9.3% 15.2% Liquidity Ratios Current Ratio 0.8 1.4 1.1 0.6 0.9 0.9 Quick Ratio 0.8 1.3 1.0 0.6 0.9 0.9 Interest Coverage Ratio 14.4 0.3 14.0 2.3 13.6 26.0 Debt to Equity Ratio 8.4 3.8 4.4 7.3 8.4 (25.6) Net Debt to EBITDA (1.0) (18.3) (0.9) 1.4 0.6 1.3 Net Debt to Equity (7.0) (3.7) (2.0) 1.7 2.5 (9.3) Turnover Ratios Inventory Turnover Ratio 85.8 148.8 176.1 165.2 106.7 25.0 Receivable Turnover Ratio 230.1 143.0 134.3 124.7 133.2 35.9 Accounts Payable Turnover Ratio 35.6 35.1 34.8 29.0 29.3 7.3 Fixed Asset Turnover Ratio 4.6 6.3 5.2 2.8 2.9 0.9 Total Asset Turnover Ratio 1.3 1.5 1.6 1.2 1.3 0.4 Working Capital Turnover Ratio (16.9) 11.4 67.8 (9.2) (46.8) (23.4) Return Ratios RoE (%) 564.0% 81.3% 247.7% 117.0% 305.6% 446.6% RoCE (%) 42.0% -0.9% 25.2% 5.4% 22.3% 11.3% Per Share Data Restated EPS 16.1 3.9 21.7 13.2 36.0 17.8 Restated BVPS 2.9 6.8 10.8 11.7 11.8 (3.9) Restated Cash EPS 17.8 5.7 24.1 19.4 44.3 21.1 Restated Operatiing Cash Flow per Share 24.2 24.9 48.3 44.3 66.2 24.3 Oct. 27, 2015 Interglobe Aviation Ltd.
  • 11. IPO Update IPO UPDATE es 11Š CHOICE INSTITUTIONAL RESEARCH Disclaimer This is solely for information of clients of Choice Broking and does not construe to be an investment advice. It is also not intended as an offer or solicitation for the purchase and sale of any financial instruments. Any action taken by you on the basis of the information contained herein is your responsibility alone and Choice Broking its subsidiaries or its employees or associates will not be liable in any manner for the consequences of such action taken by you. We have exercised due diligence in checking the correctness and authenticity of the information contained in this recommendation, but Choice Broking or any of its subsidiaries or associates or employees shall not be in any way responsible for any loss or damage that may arise to any person from any inadvertent error in the information contained in this recommendation or any action taken on basis of this information. This report is based on the fundamental analysis with a view to forecast future price. The Research analysts for this report certifies that all of the views expressed in this report accurately reflect his or her personal views about the subject company or companies and its or their securities, and no part of his or her compensation was, is or will be, directly or indirectly related to specific recommendations or views expressed in this report. Choice Broking has based this document on information obtained from sources it believes to be reliable but which it has not independently verified; Choice Broking makes no guarantee, representation or warranty and accepts no responsibility or liability as to its accuracy or completeness. The opinions contained within the report are based upon publicly available information at the time of publication and are subject to change without notice. The information and any disclosures provided herein are in summary form and have been prepared for informational purposes. The recommendations and suggested price levels are intended purely for stock market investment purposes. The recommendations are valid for the day of the report and will remain valid till the target period. The information and any disclosures provided herein may be considered confidential. Any use, distribution, modification, copying, forwarding or disclosure by any person is strictly prohibited. The information and any disclosures provided herein do not constitute a solicitation or offer to purchase or sell any security or other financial product or instrument. The current performance may be unaudited. Past performance does not guarantee future returns. There can be no assurance that investments will achieve any targeted rates of return, and there is no guarantee against the loss of your entire investment. POTENTIAL CONFLICT OF INTEREST DISCLOSURE (as on date of report) Disclosure of interest statement – • Analyst interest of the stock /Instrument(s): - No. • Firm interest of the stock / Instrument (s): - No. Choice’s Rating Rationale The price target for a large cap stock represents the value the analyst expects the stock to reach over next 12 months. For a stock to be classified as Outperform, the expected return must exceed the local risk free return by at least 5% over the next 12 months. For a stock to be classified as Underperform, the stock return must be below the local risk free return by at least 5% over the next 12 months. Stocks between these bands are classified as Neutral. Choice Equity Broking Pvt. Ltd. Choice House, Shree Shakambhari Corporate Park, Plt No: -156-158, J.B. Nagar, Andheri (East), Mumbai - 400 099. +91-022-6707 9999 +91-022-6707 9959 www.choiceindia.com Institutional Equity Team Name Designation Email id Contact No. Ajay Kejriwal President ajay@choiceindia.com 022- 6707 9850 Sumeet Bagadia Head of Research sumeet.bagadia@choiceindia.com 022 - 6707 9830 Amit Singh VP - Institutional Sales amit.singh@choiceindia.com 022 - 6707 9852 Devendra Gaikwad Sr. Manager - Institutional Sales devendra.gaikwad@choiceindia.com 022 - 6707 9877 Rajnath Yadav Research Analyst rajnath.yadav@choiceindia.com 022 - 6707 9975 Satish Kumar Research Analyst satish.kumar@choiceindia.com 022 - 6707 9974 Kunal Parmar Research Associate kunal.parmar@choiceindia.com 022 - 6707 9982 Ritesh Patel Research Associate ritesh.patel@choiceindia.com 022 - 6707 9978 Amit Pathania Research Associate amit.pathania@choiceindia.com 022 - 6707 9979 Vikas Chaudhari Research Associate vikas.chaudhari@choiceindia.com 022 - 6707 9988 Trirashmi Ghoderao Research Advisor trirashmi.ghoderao@choiceindia.com 022 - 6707 9972 Neeraj Yadav Research Advisor Neeraj.yadav@choiceindia.com 022 - 6707 9988 IPO Update