SlideShare a Scribd company logo
1 of 9
Download to read offline
Copyright © 2012 by Common Sense Advisory, Inc. 31 May 2012
Unauthorized Reproduction & Distribution Prohibited www.commonsenseadvisory.com
TheTop100LanguageServiceProviders
by Nataly Kelly and Donald A. DePalma
This brief presents the world’s leading providers of translation, localization, and
interpreting services. We also size the market based on reported revenue data, and
present our projections for the next five years. Due in part to the growth of the
industry, we expanded this year’s ranking to include the 100 largest providers of
language services and technology (see Table 1). Because there were several instances
of companies reporting identical revenue, the list includes three ties, resulting in 104
companies claiming or sharing the top 100 spots. The two-letter country codes listed
correspond to ISO 3166-1 alpha 2, the most commonly used abbreviations.
Company HQ
Country
2011
Revenue in
US$M
Employees Offices Status
1 Mission Essential
Personnel
US $725.50 8,300 20 Private
2 Lionbridge Technologies US $427.86 4,500 45 Public
3 HP ACG FR $418.00 4,200 15 Public
4 TransPerfect /
Translations.com
US $300.60 1,763 74 Private
5 SDL UK $282.85 2,700 70 Public
6 STAR Group CH $148.00 890 43 Private
7 euroscript International
S.A.
LU $133.71 1,400 27 Private
8 ManpowerGroup US $113.00 350 11 Public
9 RWS Holdings PLC UK $105.06 529 10 Public
10 Welocalize, Inc. US $82.20 615 12 Private
11 CLS Communication CH $81.52 550 19 Private
12 Honyaku Center Inc. JP $70.14 254 5 Public
13 thebigword Group UK $65.12 440 9 Private
14 Yamagata Intech
Corporation
JP $60.42 800 15 Private
15 Semantix SE $56.46 240 13 Private
16 Logos Group IT $51.75 200 7 Private
17 Moravia Worldwide CZ $44.30 469 8 Private
This nine-page extract from “The Language Services
Market: 2012” is subject to Common Sense
Advisory’s standard terms of use. Unauthorized
reproduction and distribution are strictly prohibited.
The Top 100 Language Service Providers 2
Copyright © 2012 by Common Sense Advisory, Inc. 31 May 2012
Unauthorized Reproduction & Distribution Prohibited www.commonsenseadvisory.com
Company HQ
Country
2011
Revenue in
US$M
Employees Offices Status
18 Cyracom International,
Inc.
US $43.74 692 4 Private
19 hiSoft Technology
International Ltd.
CN $40.80 1,020 21 Public
20 ONCALL Language
Services Pty Ltd
AU $36.39 92 5 Private
21 Hogarth Worldwide UK $36.10 350 7 Private
22 Pacific Interpreters US $35.15 400 5 Private
23 Crestec, Inc. JP $33.62 2,000 26 Private
24 Merrill Brink International US $32.00 100 4 Private
25 AAC Global FI $30.40 432 13 Public
26 Skrivanek Group CZ $29.02 295 44 Private
27 CSOFT International, Ltd. CN $28.60 400 14 Private
28 Alpha CRC UK $28.56 348 15 Private
29 Language Services
Associates
US $28.00 160 3 Private
30 Språkservice Sverige AB SE $27.78 40 2 Private
31 CBG Konsult AB SE $27.47 190 9 Private
32 LanguageWire DK $27.11 95 8 Private
33 Concorde Group NL $24.65 110 1 Private
34 PTSGI TW $24.61 290 5 Private
35 Jonckers Translation &
Engineering s.a.
BE $24.23 171 10 Private
36 Telelingua BE $23.06 220 7 Private
37 TRANSN Information
Technology Co., Ltd.
CN $23.00 550 19 Private
38 Transvoice Sweden AB SE $22.50 85 4 Private
39 TextMinded, EEIG BE $21.97 115 12 Private
40 SeproTec Multilingual
Solutions
ES $21.11 279 17 Private
41 Sajan US $20.90 125 6 Public
42 ALAYA INC. JP $20.72 137 7 Private
43 Verztec Consulting PTE
LTD
SG $19.84 155 7 Private
44 TOIN Corporation JP $19.23 90 6 Private
45 Amesto Translations NO $19.00 80 5 Private
The Top 100 Language Service Providers 3
Copyright © 2012 by Common Sense Advisory, Inc. 31 May 2012
Unauthorized Reproduction & Distribution Prohibited www.commonsenseadvisory.com
Company HQ
Country
2011
Revenue in
US$M
Employees Offices Status
46 Xplanation Language
Services NV
BE $17.97 76 5 Private
47 Applied Language
Solutions
UK $17.07 145 9 Private
48 Chizai Corporation JP $16.51 79 4 Private
49 SYSTRAN FR $14.76 80 2 Public
50 Global LT, Inc. US $13.40 75 3 Private
51 Human Science Co., Ltd. JP $12.80 95 1 Private
52 Certified Languages
International
US $12.51 60 2 Private
53 Janus Worldwide Inc. RU $11.92 172 9 Private
54 beo Gesellschaft für
Sprachen und
Technologie mbh
DE $11.84 65 5 Private
55 Arancho Doc IT $11.77 96 10 Private
56 EGO Translating
Company
RU $11.41 207 9 Private
57 OMNIA S.r.l. IT $11.32 41 8 Private
58 Fasttranslator.com /
Snelvertaler BV
NL $10.85 54 6 Private
59 Wordbank UK $10.67 80 2 Private
60 4-Text Software-
Lokalisierung und
technische
Übersetzungen GmbH
DE $10.59 55 1 Private
61 itl AG DE $10.45 90 6 Private
62 APOSTROPH AG CH $10.08 74 1 Private
63 Interpreters Unlimited US $10.00 28 4 Private
64 Logrus Group RU $9.92 150 6 Private
65 ABBYY Language
Services
RU $9.80 118 5 Private
66 Woods Media Group FR $9.75 20 2 Private
67 Global Language
Solutions
US $9.50 34 4 Private
68 mt-g medical translation
GmbH & Co KG
DE $9.48 49 1 Private
69 Transline Deutschland
Dr. Sturz GmbH
DE $9.47 80 5 Private
70 Neotech RU $9.46 188 3 Private
71 LanguageWorks US $9.40 35 1 Private
The Top 100 Language Service Providers 4
Copyright © 2012 by Common Sense Advisory, Inc. 31 May 2012
Unauthorized Reproduction & Distribution Prohibited www.commonsenseadvisory.com
Company HQ
Country
2011
Revenue in
US$M
Employees Offices Status
72 Lingo24 UK $9.31 166 8 Private
73 Elanex, Inc. US $9.15 58 7 Private
74 Lingsoft Group FI $8.23 50 2 Private
74 CTS LanguageLink US $8.23 68 2 Private
75 Lemoine International,
Inc.
US $8.10 68 6 Private
76 Geneva Worldwide US $7.90 25 1 Private
76 VITS LANGUAGELINK
AU $7.90 15 1
Government-
owned
77 CPSL (Celer Pawlowsky
SL)
ES $7.79 40 3 Private
78 arvato technical
information
DE $7.66 420 14 Private
79 TranslateMedia / Central
Translations
UK $7.58 45 6 Private
80 nlg GmbH DE $7.52 42 2 Private
81 ENLASO Corporation US $7.00 43 2 Private
82 Translate Plus Limited UK $6.63 47 10 Private
83 Cintra Ltd. UK $6.55 26 1 Non-profit
83 eurocom Translation
Services GmbH
AT $6.55 30 1 Private
83 text & form DE $6.55 45 2 Private
84 Aspena, s.r.o. CZ $6.35 70 8 Private
85 AVB Vertalingen / AVB
Translations
NL $6.34 23 2 Private
86 Tetras GmbH DE $5.93 40 5 Private
87 Cogen BE $5.85 32 2 Private
88 HL TRAD FR $5.43 20 3 Private
89 U-TRAX NL $5.34 22 4 Private
90 Ofilingua S.L. ES $5.32 180 2 Private
91 Mc LEHM Language
Services
ES $5.26 27 3 Private
92 Sandberg Translation
Partners / STP Nordic
UK $5.12 41 1 Private
93 Transatlantic Translations US $5.10 24 6 Private
94 Jensen Localization BV NL $4.87 27 3 Private
95 Translation Empire UK $4.81 25 5 Private
The Top 100 Language Service Providers 5
Copyright © 2012 by Common Sense Advisory, Inc. 31 May 2012
Unauthorized Reproduction & Distribution Prohibited www.commonsenseadvisory.com
Company HQ
Country
2011
Revenue in
US$M
Employees Offices Status
96 LIDEX PL $4.77 58 4 Private
97 ida Corporation JP $4.75 40 2 Private
98 IDEST Communication
SA
BE $4.74 16 1 Private
99 Lyric Labs IN $4.38 41 5 Private
100 Intrawelt IT $4.18 16 4 Private
Table 1: The Top 100 Global Language Service Providers in 2012
Source: Common Sense Advisory, Inc.
Observations on the Top 100 Global LSPs in 2012
How have the top-ranked companies changed since last year? This year, there are
several important developments worth highlighting:
 Most of the largest players grew by leaps and bounds. At the very top of the list,
we see U.S. military contractor Mission Essential Personnel, which added more
than US$100 million in revenue compared to the previous year. Lionbridge grew
by more than US$20 million, TransPerfect increased by US$50 million, and SDL
added more than US$40 million. All in all, it was a lucrative year for most of the
top-ranked providers. With a decrease in revenue, HP ACG dropped one spot in
the list.
 Other top firms also reported growth. Also at the top of the list, we find STAR,
euroscript, ManpowerGroup, and RWS. Each of these companies reported
increases in 2011 as well, with euroscript and RWS growing by nearly US$10
million. Welocalize vaults to the top 10 largest companies this year, jumping up
eight spots since last year and adding more revenue than most firms in its size
range.
 Companies in the top fifth of the ranking post solid numbers. CLS had a banner
year, adding more than US$10 million in revenue, while Honyaku grew by US$14
million, pushing past fellow Japanese competitor Yamagata, which reported a
slight decrease. Semantix added a noteworthy US$8 million over the past year,
while firms like thebigword, Moravia, Logos Group, and hiSoft all posted smaller
but respectable increases. This year’s Top 20 also sees a telephone interpreting
provider, Cyracom, which grew by around US$6 million. Australian provider
ONCALL also hits near the top of the list, adding US$8 million since last year.
The Top 100 Language Service Providers 6
Copyright © 2012 by Common Sense Advisory, Inc. 31 May 2012
Unauthorized Reproduction & Distribution Prohibited www.commonsenseadvisory.com
The Size of the Language Services Market in 2012
Our market sizing exercise draws on multiple sets of data. The first dataset is our
global directory of language service providers (LSPs) that we maintain and update on
a continuing basis throughout the year. At the time of publication, our directory
contained 26,104 LSPs – that is, companies with two or more employees. Our second
dataset consists of the respondents to our annual survey of suppliers. This year, we
had 1,119 respondents in total. Finally, we use a subset of the survey respondents who
report their exact revenue to us for purposes of collective analysis or for inclusion in
global or regional rankings.
The vast majority of LSPs are privately owned – 94.18%, according to this year’s
survey. Because they do not generally publish financial data, these firms submit their
revenue and other financial data to us confidentially. This year, we had 672 LSPs that
provided us with their actual revenue data. While many language service providers
are reluctant to share this, enables us to reveal even more detailed information about
the market itself, including its regional and sector-specific breakdowns.
Common Sense Advisory calculates that the market for outsourced language
services is worth US$33.523 billion in 2012.
To derive this estimate, we measured actual financial activity for the fiscal year most
recently completed (2011). According to the year-to-year changes in revenue and the
expected earnings reported by the LSPs we surveyed, we calculate that the language
services market is growing in 2012 at an annual rate of 12.17%.
As of 2012, Common Sense Advisory calculates that the language services
market is growing at an annual rate of 12.17%.
The current growth rate is positive news. Prior to 2010, our estimates showed stable
double-digit growth rates for the language services industry, even during 2008 and
2009, when the global economy took a tumble. In 2010, the market fell to a slightly
lower rate of more than 13%. However, in 2011, the growth rate dropped significantly
to just 7.41%. While overall growth has not yet returned to its pre-recession rates, it
appears that 2011 was a much better year for the market than 2010, and on par with
the growth experienced in 2009.
Last year, we estimated that the market would reach US$31.44 billion in 2011. The
actual reported data from 2011 shows that the number was actually US$29.89 billion
instead. Why the shortfall? Our estimated growth rate uses a weighted average of the
actual reported growth rate for the prior year and suppliers’ projected growth rates for
The Top 100 Language Service Providers 7
Copyright © 2012 by Common Sense Advisory, Inc. 31 May 2012
Unauthorized Reproduction & Distribution Prohibited www.commonsenseadvisory.com
the year ahead. LSPs do not always perfectly estimate how much they will earn in the
year to come. For this reason, we look backward at the amount of revenue suppliers
actually reported in the prior year, so that we can fine-tune our adjustments for the
next five-year period. Our prior estimate for 2012 showed that the market would reach
US$33.77 billion, while this year’s estimates show that it will reach US$33.52 billion. In
other words, our 2012 estimates are highly consistent with the projected estimates for
2012 we issued last year.
North America Shrinks While Europe and Asia Grow
To divide up the world, we follow the classifications developed by the United Nations.
How much revenue does each part of the world receive from language services?
Europe (49.38%) makes up the largest region this year, followed by North America
(34.85%) and Asia (12.88%) (see Table 1). The smallest geographic tier consists of
Oceania (2.00%), Latin America (0.63%), and Africa (0.27%). Because Europe is such a
large market, we divide it up into four main parts. This gives us a total of nine major
regions (see Figure 1).
Region
Market
Share
2011
US$ M
2012
US$ M
2013
US$ M
2014
US$ M
2015
US$ M
Africa 0.27% 81 91 102 114 128
Asia 12.88% 3,849 4,318 4,843 5,433 6,094
Europe 49.38% 14,757 16,553 18,569 20,830 23,365
Europe - Eastern 4.39% 1,312 1,472 1,651 1,852 2,077
Europe - Northern 18.86% 5,636 6,322 7,092 7,956 8,924
Europe - Southern 3.44% 1,028 1,153 1,294 1,451 1,628
Europe - Western 22.69% 6,781 7,606 8,532 9,571 10,736
Latin America 0.63% 188 211 237 266 298
North America 34.85% 10,415 11,683 13,105 14,700 16,490
Oceania 2.00% 598 670 752 844 946
TOTALS 100.00% 29,885 33,523 37,604 42,182 47,317
Table 2: Language Services Market Share by Region
Source: Common Sense Advisory, Inc.
Let us look at the recent historical and current market shares for each area of the world
for each of the years for which we have collected data in our most recent format (see
Table 2). We can observe several important changes in the geographic composition of
the market from 2011 to 2012:
The Top 100 Language Service Providers 8
Copyright © 2012 by Common Sense Advisory, Inc. 31 May 2012
Unauthorized Reproduction & Distribution Prohibited www.commonsenseadvisory.com
Figure 1: Global Language Services Market Share by Region
Source: Common Sense Advisory, Inc.
 North America cuts spending. As the U.S. has reduced its military involvement in
Afghanistan and Iraq, the total amount spent on language services in North
America appears to have decreased. In the private sector, businesses have been
cautious with their spending and many have attempted to slow or reduce their
expenditures on translation (see “Understanding Your Customer’s Translation
Performance,” Dec11.)
The Top 100 Language Service Providers 9
Copyright © 2012 by Common Sense Advisory, Inc. 31 May 2012
Unauthorized Reproduction & Distribution Prohibited www.commonsenseadvisory.com
Region
Market
Share
2010
Market
Share
2011
Market
Share
2012
Africa 0.13% 0.26% 0.27%
Asia 8.59% 7.43% 12.88%
Europe 42.26% 42.07% 49.38%
Europe - Eastern 4.49% 2.84% 4.39%
Europe - Northern 11.10% 12.71% 18.86%
Europe - Southern 7.67% 5.39% 3.44%
Europe - Western 19.00% 21.13% 22.69%
North America 48.50% 49.25% 34.85%
Oceania 0.35% 0.66% 2.00%
Latin America 0.18% 0.32% 0.63%
Totals 100.00% 100.00% 100.00%
Table 3: Historical Change in Market Share by Region
Source: Common Sense Advisory, Inc.
 Asia gains significant ground. Asia lost language services market share slightly in
2011 when compared with other regions, but appears to be gaining in 2012, fueled
largely by China. This is the first year in our study that Asia reaches a double-digit
percentage of total market share, an important milestone for this part of the world.
 Western and Northern Europe keep climbing. Led by France, Germany, and the
United Kingdom, these two sub-regions of Europe show impressive increases in
market share. Southern Europe continued to lose out on market share overall,
while Eastern Europe returned to the same share it had two years prior.
Our survey sample, with 1,119 LSPs out of 26,104 companies globally, represents
4.29% of the total population. This year, we collected exact revenue from 672
companies that contributed a total of US$4.92 billion to the market in 2011. According
to our calculations based on the exact revenue provided, the 2011 market was
US$29.885 billion. In other words, our sample made up 4.29% of language service
providers worldwide that accounted for 14.30% of global revenue.
What about the remaining 25,432 LSPs in our directory? Most of them contribute much
smaller amounts, but their revenue accounts for the majority of the market. On
average, each of these companies earns less than US$1 million annually. However, the
scope ranges tremendously in size. There are LSPs we are aware of in this group that
earn tens or even hundreds of millions of dollars – including some military contractors
for the U.S. government. This group also includes LSPs in low-cost locations that
might employ dozens of workers but take in less than US$10,000 per year, reflecting
once again the highly fragmented nature of the market.

More Related Content

Similar to Top 100 Languages Services Provider in World

Ibm company prsenation
Ibm company prsenationIbm company prsenation
Ibm company prsenationSana Khan
 
InSync10 Implement JDE Financial Analytics and Make Better Decisions
InSync10  Implement JDE Financial Analytics and Make Better DecisionsInSync10  Implement JDE Financial Analytics and Make Better Decisions
InSync10 Implement JDE Financial Analytics and Make Better DecisionsInSync Conference
 
Best Buy Finance MBA Recruiting Presentation 2010
Best Buy Finance MBA Recruiting Presentation 2010Best Buy Finance MBA Recruiting Presentation 2010
Best Buy Finance MBA Recruiting Presentation 2010Brian Kohlbeck
 
NOAH 2015 Disruptor List
NOAH 2015 Disruptor ListNOAH 2015 Disruptor List
NOAH 2015 Disruptor ListNOAH Advisors
 
NOAH Disruptor List 2015
NOAH Disruptor List 2015NOAH Disruptor List 2015
NOAH Disruptor List 2015NOAH Advisors
 
Towards a sustainable solution to open source sustainability, OW2online20, Ju...
Towards a sustainable solution to open source sustainability, OW2online20, Ju...Towards a sustainable solution to open source sustainability, OW2online20, Ju...
Towards a sustainable solution to open source sustainability, OW2online20, Ju...OW2
 
How to win in tech m&a v f
How to win in tech m&a v fHow to win in tech m&a v f
How to win in tech m&a v fMaurice Watkins
 
Technology, Media & Telecommunications Predictions - Deloitte - 2012
Technology, Media & Telecommunications Predictions - Deloitte - 2012Technology, Media & Telecommunications Predictions - Deloitte - 2012
Technology, Media & Telecommunications Predictions - Deloitte - 2012Romain Fonnier
 
Fintech100 2018, KPMG report
Fintech100 2018, KPMG reportFintech100 2018, KPMG report
Fintech100 2018, KPMG reportGaudefroy Ariane
 
NOAH Advisors - NOAH13 London
NOAH Advisors - NOAH13 LondonNOAH Advisors - NOAH13 London
NOAH Advisors - NOAH13 LondonNOAH Advisors
 
Global PE Challenges & Opportunities July 2020
Global PE Challenges & Opportunities July 2020Global PE Challenges & Opportunities July 2020
Global PE Challenges & Opportunities July 2020Jordan Selleck
 
Mutual fund monthly review 06 2013
Mutual fund monthly review 06 2013Mutual fund monthly review 06 2013
Mutual fund monthly review 06 2013jonathangeorges
 
The JOBS Act Implementation Update
The JOBS Act Implementation UpdateThe JOBS Act Implementation Update
The JOBS Act Implementation UpdateMarketNexus Media
 

Similar to Top 100 Languages Services Provider in World (20)

Ibm company prsenation
Ibm company prsenationIbm company prsenation
Ibm company prsenation
 
InSync10 Implement JDE Financial Analytics and Make Better Decisions
InSync10  Implement JDE Financial Analytics and Make Better DecisionsInSync10  Implement JDE Financial Analytics and Make Better Decisions
InSync10 Implement JDE Financial Analytics and Make Better Decisions
 
Dealbook 2017
Dealbook 2017Dealbook 2017
Dealbook 2017
 
Best Buy Finance MBA Recruiting Presentation 2010
Best Buy Finance MBA Recruiting Presentation 2010Best Buy Finance MBA Recruiting Presentation 2010
Best Buy Finance MBA Recruiting Presentation 2010
 
NOAH 2015 Disruptor List
NOAH 2015 Disruptor ListNOAH 2015 Disruptor List
NOAH 2015 Disruptor List
 
NOAH Disruptor List 2015
NOAH Disruptor List 2015NOAH Disruptor List 2015
NOAH Disruptor List 2015
 
Towards a sustainable solution to open source sustainability, OW2online20, Ju...
Towards a sustainable solution to open source sustainability, OW2online20, Ju...Towards a sustainable solution to open source sustainability, OW2online20, Ju...
Towards a sustainable solution to open source sustainability, OW2online20, Ju...
 
How to win in tech m&a v f
How to win in tech m&a v fHow to win in tech m&a v f
How to win in tech m&a v f
 
Technology, Media & Telecommunications Predictions - Deloitte - 2012
Technology, Media & Telecommunications Predictions - Deloitte - 2012Technology, Media & Telecommunications Predictions - Deloitte - 2012
Technology, Media & Telecommunications Predictions - Deloitte - 2012
 
Fintech100 2018, KPMG report
Fintech100 2018, KPMG reportFintech100 2018, KPMG report
Fintech100 2018, KPMG report
 
NOAH Advisors - NOAH13 London
NOAH Advisors - NOAH13 LondonNOAH Advisors - NOAH13 London
NOAH Advisors - NOAH13 London
 
Tmt predictions 2012
Tmt predictions 2012Tmt predictions 2012
Tmt predictions 2012
 
Tbl business plan
Tbl business planTbl business plan
Tbl business plan
 
Global PE Challenges & Opportunities July 2020
Global PE Challenges & Opportunities July 2020Global PE Challenges & Opportunities July 2020
Global PE Challenges & Opportunities July 2020
 
Mutual fund monthly review 06 2013
Mutual fund monthly review 06 2013Mutual fund monthly review 06 2013
Mutual fund monthly review 06 2013
 
The JOBS Act Implementation Update
The JOBS Act Implementation UpdateThe JOBS Act Implementation Update
The JOBS Act Implementation Update
 
Deloitte tmt predictions_2012
Deloitte tmt predictions_2012Deloitte tmt predictions_2012
Deloitte tmt predictions_2012
 
It 360show
It 360showIt 360show
It 360show
 
Open Source Talent
Open Source TalentOpen Source Talent
Open Source Talent
 
Open Source Talent
Open Source TalentOpen Source Talent
Open Source Talent
 

Recently uploaded

办理(Vancouver毕业证书)加拿大温哥华岛大学毕业证成绩单原版一比一
办理(Vancouver毕业证书)加拿大温哥华岛大学毕业证成绩单原版一比一办理(Vancouver毕业证书)加拿大温哥华岛大学毕业证成绩单原版一比一
办理(Vancouver毕业证书)加拿大温哥华岛大学毕业证成绩单原版一比一F La
 
9711147426✨Call In girls Gurgaon Sector 31. SCO 25 escort service
9711147426✨Call In girls Gurgaon Sector 31. SCO 25 escort service9711147426✨Call In girls Gurgaon Sector 31. SCO 25 escort service
9711147426✨Call In girls Gurgaon Sector 31. SCO 25 escort servicejennyeacort
 
9654467111 Call Girls In Munirka Hotel And Home Service
9654467111 Call Girls In Munirka Hotel And Home Service9654467111 Call Girls In Munirka Hotel And Home Service
9654467111 Call Girls In Munirka Hotel And Home ServiceSapana Sha
 
꧁❤ Greater Noida Call Girls Delhi ❤꧂ 9711199171 ☎️ Hard And Sexy Vip Call
꧁❤ Greater Noida Call Girls Delhi ❤꧂ 9711199171 ☎️ Hard And Sexy Vip Call꧁❤ Greater Noida Call Girls Delhi ❤꧂ 9711199171 ☎️ Hard And Sexy Vip Call
꧁❤ Greater Noida Call Girls Delhi ❤꧂ 9711199171 ☎️ Hard And Sexy Vip Callshivangimorya083
 
vip Sarai Rohilla Call Girls 9999965857 Call or WhatsApp Now Book
vip Sarai Rohilla Call Girls 9999965857 Call or WhatsApp Now Bookvip Sarai Rohilla Call Girls 9999965857 Call or WhatsApp Now Book
vip Sarai Rohilla Call Girls 9999965857 Call or WhatsApp Now Bookmanojkuma9823
 
Customer Service Analytics - Make Sense of All Your Data.pptx
Customer Service Analytics - Make Sense of All Your Data.pptxCustomer Service Analytics - Make Sense of All Your Data.pptx
Customer Service Analytics - Make Sense of All Your Data.pptxEmmanuel Dauda
 
Building on a FAIRly Strong Foundation to Connect Academic Research to Transl...
Building on a FAIRly Strong Foundation to Connect Academic Research to Transl...Building on a FAIRly Strong Foundation to Connect Academic Research to Transl...
Building on a FAIRly Strong Foundation to Connect Academic Research to Transl...Jack DiGiovanna
 
EMERCE - 2024 - AMSTERDAM - CROSS-PLATFORM TRACKING WITH GOOGLE ANALYTICS.pptx
EMERCE - 2024 - AMSTERDAM - CROSS-PLATFORM  TRACKING WITH GOOGLE ANALYTICS.pptxEMERCE - 2024 - AMSTERDAM - CROSS-PLATFORM  TRACKING WITH GOOGLE ANALYTICS.pptx
EMERCE - 2024 - AMSTERDAM - CROSS-PLATFORM TRACKING WITH GOOGLE ANALYTICS.pptxthyngster
 
Brighton SEO | April 2024 | Data Storytelling
Brighton SEO | April 2024 | Data StorytellingBrighton SEO | April 2024 | Data Storytelling
Brighton SEO | April 2024 | Data StorytellingNeil Barnes
 
Call Us ➥97111√47426🤳Call Girls in Aerocity (Delhi NCR)
Call Us ➥97111√47426🤳Call Girls in Aerocity (Delhi NCR)Call Us ➥97111√47426🤳Call Girls in Aerocity (Delhi NCR)
Call Us ➥97111√47426🤳Call Girls in Aerocity (Delhi NCR)jennyeacort
 
Data Science Jobs and Salaries Analysis.pptx
Data Science Jobs and Salaries Analysis.pptxData Science Jobs and Salaries Analysis.pptx
Data Science Jobs and Salaries Analysis.pptxFurkanTasci3
 
Saket, (-DELHI )+91-9654467111-(=)CHEAP Call Girls in Escorts Service Saket C...
Saket, (-DELHI )+91-9654467111-(=)CHEAP Call Girls in Escorts Service Saket C...Saket, (-DELHI )+91-9654467111-(=)CHEAP Call Girls in Escorts Service Saket C...
Saket, (-DELHI )+91-9654467111-(=)CHEAP Call Girls in Escorts Service Saket C...Sapana Sha
 
RS 9000 Call In girls Dwarka Mor (DELHI)⇛9711147426🔝Delhi
RS 9000 Call In girls Dwarka Mor (DELHI)⇛9711147426🔝DelhiRS 9000 Call In girls Dwarka Mor (DELHI)⇛9711147426🔝Delhi
RS 9000 Call In girls Dwarka Mor (DELHI)⇛9711147426🔝Delhijennyeacort
 
Indian Call Girls in Abu Dhabi O5286O24O8 Call Girls in Abu Dhabi By Independ...
Indian Call Girls in Abu Dhabi O5286O24O8 Call Girls in Abu Dhabi By Independ...Indian Call Girls in Abu Dhabi O5286O24O8 Call Girls in Abu Dhabi By Independ...
Indian Call Girls in Abu Dhabi O5286O24O8 Call Girls in Abu Dhabi By Independ...dajasot375
 
Industrialised data - the key to AI success.pdf
Industrialised data - the key to AI success.pdfIndustrialised data - the key to AI success.pdf
Industrialised data - the key to AI success.pdfLars Albertsson
 
VIP High Class Call Girls Jamshedpur Anushka 8250192130 Independent Escort Se...
VIP High Class Call Girls Jamshedpur Anushka 8250192130 Independent Escort Se...VIP High Class Call Girls Jamshedpur Anushka 8250192130 Independent Escort Se...
VIP High Class Call Girls Jamshedpur Anushka 8250192130 Independent Escort Se...Suhani Kapoor
 
20240419 - Measurecamp Amsterdam - SAM.pdf
20240419 - Measurecamp Amsterdam - SAM.pdf20240419 - Measurecamp Amsterdam - SAM.pdf
20240419 - Measurecamp Amsterdam - SAM.pdfHuman37
 
办理学位证中佛罗里达大学毕业证,UCF成绩单原版一比一
办理学位证中佛罗里达大学毕业证,UCF成绩单原版一比一办理学位证中佛罗里达大学毕业证,UCF成绩单原版一比一
办理学位证中佛罗里达大学毕业证,UCF成绩单原版一比一F sss
 

Recently uploaded (20)

办理(Vancouver毕业证书)加拿大温哥华岛大学毕业证成绩单原版一比一
办理(Vancouver毕业证书)加拿大温哥华岛大学毕业证成绩单原版一比一办理(Vancouver毕业证书)加拿大温哥华岛大学毕业证成绩单原版一比一
办理(Vancouver毕业证书)加拿大温哥华岛大学毕业证成绩单原版一比一
 
9711147426✨Call In girls Gurgaon Sector 31. SCO 25 escort service
9711147426✨Call In girls Gurgaon Sector 31. SCO 25 escort service9711147426✨Call In girls Gurgaon Sector 31. SCO 25 escort service
9711147426✨Call In girls Gurgaon Sector 31. SCO 25 escort service
 
9654467111 Call Girls In Munirka Hotel And Home Service
9654467111 Call Girls In Munirka Hotel And Home Service9654467111 Call Girls In Munirka Hotel And Home Service
9654467111 Call Girls In Munirka Hotel And Home Service
 
꧁❤ Greater Noida Call Girls Delhi ❤꧂ 9711199171 ☎️ Hard And Sexy Vip Call
꧁❤ Greater Noida Call Girls Delhi ❤꧂ 9711199171 ☎️ Hard And Sexy Vip Call꧁❤ Greater Noida Call Girls Delhi ❤꧂ 9711199171 ☎️ Hard And Sexy Vip Call
꧁❤ Greater Noida Call Girls Delhi ❤꧂ 9711199171 ☎️ Hard And Sexy Vip Call
 
E-Commerce Order PredictionShraddha Kamble.pptx
E-Commerce Order PredictionShraddha Kamble.pptxE-Commerce Order PredictionShraddha Kamble.pptx
E-Commerce Order PredictionShraddha Kamble.pptx
 
vip Sarai Rohilla Call Girls 9999965857 Call or WhatsApp Now Book
vip Sarai Rohilla Call Girls 9999965857 Call or WhatsApp Now Bookvip Sarai Rohilla Call Girls 9999965857 Call or WhatsApp Now Book
vip Sarai Rohilla Call Girls 9999965857 Call or WhatsApp Now Book
 
Deep Generative Learning for All - The Gen AI Hype (Spring 2024)
Deep Generative Learning for All - The Gen AI Hype (Spring 2024)Deep Generative Learning for All - The Gen AI Hype (Spring 2024)
Deep Generative Learning for All - The Gen AI Hype (Spring 2024)
 
Customer Service Analytics - Make Sense of All Your Data.pptx
Customer Service Analytics - Make Sense of All Your Data.pptxCustomer Service Analytics - Make Sense of All Your Data.pptx
Customer Service Analytics - Make Sense of All Your Data.pptx
 
Building on a FAIRly Strong Foundation to Connect Academic Research to Transl...
Building on a FAIRly Strong Foundation to Connect Academic Research to Transl...Building on a FAIRly Strong Foundation to Connect Academic Research to Transl...
Building on a FAIRly Strong Foundation to Connect Academic Research to Transl...
 
EMERCE - 2024 - AMSTERDAM - CROSS-PLATFORM TRACKING WITH GOOGLE ANALYTICS.pptx
EMERCE - 2024 - AMSTERDAM - CROSS-PLATFORM  TRACKING WITH GOOGLE ANALYTICS.pptxEMERCE - 2024 - AMSTERDAM - CROSS-PLATFORM  TRACKING WITH GOOGLE ANALYTICS.pptx
EMERCE - 2024 - AMSTERDAM - CROSS-PLATFORM TRACKING WITH GOOGLE ANALYTICS.pptx
 
Brighton SEO | April 2024 | Data Storytelling
Brighton SEO | April 2024 | Data StorytellingBrighton SEO | April 2024 | Data Storytelling
Brighton SEO | April 2024 | Data Storytelling
 
Call Us ➥97111√47426🤳Call Girls in Aerocity (Delhi NCR)
Call Us ➥97111√47426🤳Call Girls in Aerocity (Delhi NCR)Call Us ➥97111√47426🤳Call Girls in Aerocity (Delhi NCR)
Call Us ➥97111√47426🤳Call Girls in Aerocity (Delhi NCR)
 
Data Science Jobs and Salaries Analysis.pptx
Data Science Jobs and Salaries Analysis.pptxData Science Jobs and Salaries Analysis.pptx
Data Science Jobs and Salaries Analysis.pptx
 
Saket, (-DELHI )+91-9654467111-(=)CHEAP Call Girls in Escorts Service Saket C...
Saket, (-DELHI )+91-9654467111-(=)CHEAP Call Girls in Escorts Service Saket C...Saket, (-DELHI )+91-9654467111-(=)CHEAP Call Girls in Escorts Service Saket C...
Saket, (-DELHI )+91-9654467111-(=)CHEAP Call Girls in Escorts Service Saket C...
 
RS 9000 Call In girls Dwarka Mor (DELHI)⇛9711147426🔝Delhi
RS 9000 Call In girls Dwarka Mor (DELHI)⇛9711147426🔝DelhiRS 9000 Call In girls Dwarka Mor (DELHI)⇛9711147426🔝Delhi
RS 9000 Call In girls Dwarka Mor (DELHI)⇛9711147426🔝Delhi
 
Indian Call Girls in Abu Dhabi O5286O24O8 Call Girls in Abu Dhabi By Independ...
Indian Call Girls in Abu Dhabi O5286O24O8 Call Girls in Abu Dhabi By Independ...Indian Call Girls in Abu Dhabi O5286O24O8 Call Girls in Abu Dhabi By Independ...
Indian Call Girls in Abu Dhabi O5286O24O8 Call Girls in Abu Dhabi By Independ...
 
Industrialised data - the key to AI success.pdf
Industrialised data - the key to AI success.pdfIndustrialised data - the key to AI success.pdf
Industrialised data - the key to AI success.pdf
 
VIP High Class Call Girls Jamshedpur Anushka 8250192130 Independent Escort Se...
VIP High Class Call Girls Jamshedpur Anushka 8250192130 Independent Escort Se...VIP High Class Call Girls Jamshedpur Anushka 8250192130 Independent Escort Se...
VIP High Class Call Girls Jamshedpur Anushka 8250192130 Independent Escort Se...
 
20240419 - Measurecamp Amsterdam - SAM.pdf
20240419 - Measurecamp Amsterdam - SAM.pdf20240419 - Measurecamp Amsterdam - SAM.pdf
20240419 - Measurecamp Amsterdam - SAM.pdf
 
办理学位证中佛罗里达大学毕业证,UCF成绩单原版一比一
办理学位证中佛罗里达大学毕业证,UCF成绩单原版一比一办理学位证中佛罗里达大学毕业证,UCF成绩单原版一比一
办理学位证中佛罗里达大学毕业证,UCF成绩单原版一比一
 

Top 100 Languages Services Provider in World

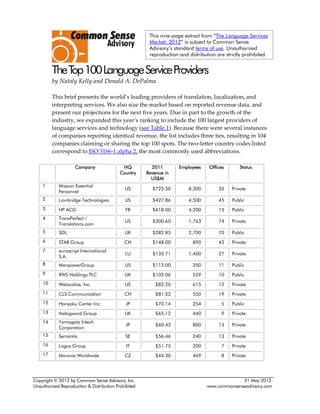
  • 1. Copyright © 2012 by Common Sense Advisory, Inc. 31 May 2012 Unauthorized Reproduction & Distribution Prohibited www.commonsenseadvisory.com TheTop100LanguageServiceProviders by Nataly Kelly and Donald A. DePalma This brief presents the world’s leading providers of translation, localization, and interpreting services. We also size the market based on reported revenue data, and present our projections for the next five years. Due in part to the growth of the industry, we expanded this year’s ranking to include the 100 largest providers of language services and technology (see Table 1). Because there were several instances of companies reporting identical revenue, the list includes three ties, resulting in 104 companies claiming or sharing the top 100 spots. The two-letter country codes listed correspond to ISO 3166-1 alpha 2, the most commonly used abbreviations. Company HQ Country 2011 Revenue in US$M Employees Offices Status 1 Mission Essential Personnel US $725.50 8,300 20 Private 2 Lionbridge Technologies US $427.86 4,500 45 Public 3 HP ACG FR $418.00 4,200 15 Public 4 TransPerfect / Translations.com US $300.60 1,763 74 Private 5 SDL UK $282.85 2,700 70 Public 6 STAR Group CH $148.00 890 43 Private 7 euroscript International S.A. LU $133.71 1,400 27 Private 8 ManpowerGroup US $113.00 350 11 Public 9 RWS Holdings PLC UK $105.06 529 10 Public 10 Welocalize, Inc. US $82.20 615 12 Private 11 CLS Communication CH $81.52 550 19 Private 12 Honyaku Center Inc. JP $70.14 254 5 Public 13 thebigword Group UK $65.12 440 9 Private 14 Yamagata Intech Corporation JP $60.42 800 15 Private 15 Semantix SE $56.46 240 13 Private 16 Logos Group IT $51.75 200 7 Private 17 Moravia Worldwide CZ $44.30 469 8 Private This nine-page extract from “The Language Services Market: 2012” is subject to Common Sense Advisory’s standard terms of use. Unauthorized reproduction and distribution are strictly prohibited.
  • 2. The Top 100 Language Service Providers 2 Copyright © 2012 by Common Sense Advisory, Inc. 31 May 2012 Unauthorized Reproduction & Distribution Prohibited www.commonsenseadvisory.com Company HQ Country 2011 Revenue in US$M Employees Offices Status 18 Cyracom International, Inc. US $43.74 692 4 Private 19 hiSoft Technology International Ltd. CN $40.80 1,020 21 Public 20 ONCALL Language Services Pty Ltd AU $36.39 92 5 Private 21 Hogarth Worldwide UK $36.10 350 7 Private 22 Pacific Interpreters US $35.15 400 5 Private 23 Crestec, Inc. JP $33.62 2,000 26 Private 24 Merrill Brink International US $32.00 100 4 Private 25 AAC Global FI $30.40 432 13 Public 26 Skrivanek Group CZ $29.02 295 44 Private 27 CSOFT International, Ltd. CN $28.60 400 14 Private 28 Alpha CRC UK $28.56 348 15 Private 29 Language Services Associates US $28.00 160 3 Private 30 Språkservice Sverige AB SE $27.78 40 2 Private 31 CBG Konsult AB SE $27.47 190 9 Private 32 LanguageWire DK $27.11 95 8 Private 33 Concorde Group NL $24.65 110 1 Private 34 PTSGI TW $24.61 290 5 Private 35 Jonckers Translation & Engineering s.a. BE $24.23 171 10 Private 36 Telelingua BE $23.06 220 7 Private 37 TRANSN Information Technology Co., Ltd. CN $23.00 550 19 Private 38 Transvoice Sweden AB SE $22.50 85 4 Private 39 TextMinded, EEIG BE $21.97 115 12 Private 40 SeproTec Multilingual Solutions ES $21.11 279 17 Private 41 Sajan US $20.90 125 6 Public 42 ALAYA INC. JP $20.72 137 7 Private 43 Verztec Consulting PTE LTD SG $19.84 155 7 Private 44 TOIN Corporation JP $19.23 90 6 Private 45 Amesto Translations NO $19.00 80 5 Private
  • 3. The Top 100 Language Service Providers 3 Copyright © 2012 by Common Sense Advisory, Inc. 31 May 2012 Unauthorized Reproduction & Distribution Prohibited www.commonsenseadvisory.com Company HQ Country 2011 Revenue in US$M Employees Offices Status 46 Xplanation Language Services NV BE $17.97 76 5 Private 47 Applied Language Solutions UK $17.07 145 9 Private 48 Chizai Corporation JP $16.51 79 4 Private 49 SYSTRAN FR $14.76 80 2 Public 50 Global LT, Inc. US $13.40 75 3 Private 51 Human Science Co., Ltd. JP $12.80 95 1 Private 52 Certified Languages International US $12.51 60 2 Private 53 Janus Worldwide Inc. RU $11.92 172 9 Private 54 beo Gesellschaft für Sprachen und Technologie mbh DE $11.84 65 5 Private 55 Arancho Doc IT $11.77 96 10 Private 56 EGO Translating Company RU $11.41 207 9 Private 57 OMNIA S.r.l. IT $11.32 41 8 Private 58 Fasttranslator.com / Snelvertaler BV NL $10.85 54 6 Private 59 Wordbank UK $10.67 80 2 Private 60 4-Text Software- Lokalisierung und technische Übersetzungen GmbH DE $10.59 55 1 Private 61 itl AG DE $10.45 90 6 Private 62 APOSTROPH AG CH $10.08 74 1 Private 63 Interpreters Unlimited US $10.00 28 4 Private 64 Logrus Group RU $9.92 150 6 Private 65 ABBYY Language Services RU $9.80 118 5 Private 66 Woods Media Group FR $9.75 20 2 Private 67 Global Language Solutions US $9.50 34 4 Private 68 mt-g medical translation GmbH & Co KG DE $9.48 49 1 Private 69 Transline Deutschland Dr. Sturz GmbH DE $9.47 80 5 Private 70 Neotech RU $9.46 188 3 Private 71 LanguageWorks US $9.40 35 1 Private
  • 4. The Top 100 Language Service Providers 4 Copyright © 2012 by Common Sense Advisory, Inc. 31 May 2012 Unauthorized Reproduction & Distribution Prohibited www.commonsenseadvisory.com Company HQ Country 2011 Revenue in US$M Employees Offices Status 72 Lingo24 UK $9.31 166 8 Private 73 Elanex, Inc. US $9.15 58 7 Private 74 Lingsoft Group FI $8.23 50 2 Private 74 CTS LanguageLink US $8.23 68 2 Private 75 Lemoine International, Inc. US $8.10 68 6 Private 76 Geneva Worldwide US $7.90 25 1 Private 76 VITS LANGUAGELINK AU $7.90 15 1 Government- owned 77 CPSL (Celer Pawlowsky SL) ES $7.79 40 3 Private 78 arvato technical information DE $7.66 420 14 Private 79 TranslateMedia / Central Translations UK $7.58 45 6 Private 80 nlg GmbH DE $7.52 42 2 Private 81 ENLASO Corporation US $7.00 43 2 Private 82 Translate Plus Limited UK $6.63 47 10 Private 83 Cintra Ltd. UK $6.55 26 1 Non-profit 83 eurocom Translation Services GmbH AT $6.55 30 1 Private 83 text & form DE $6.55 45 2 Private 84 Aspena, s.r.o. CZ $6.35 70 8 Private 85 AVB Vertalingen / AVB Translations NL $6.34 23 2 Private 86 Tetras GmbH DE $5.93 40 5 Private 87 Cogen BE $5.85 32 2 Private 88 HL TRAD FR $5.43 20 3 Private 89 U-TRAX NL $5.34 22 4 Private 90 Ofilingua S.L. ES $5.32 180 2 Private 91 Mc LEHM Language Services ES $5.26 27 3 Private 92 Sandberg Translation Partners / STP Nordic UK $5.12 41 1 Private 93 Transatlantic Translations US $5.10 24 6 Private 94 Jensen Localization BV NL $4.87 27 3 Private 95 Translation Empire UK $4.81 25 5 Private
  • 5. The Top 100 Language Service Providers 5 Copyright © 2012 by Common Sense Advisory, Inc. 31 May 2012 Unauthorized Reproduction & Distribution Prohibited www.commonsenseadvisory.com Company HQ Country 2011 Revenue in US$M Employees Offices Status 96 LIDEX PL $4.77 58 4 Private 97 ida Corporation JP $4.75 40 2 Private 98 IDEST Communication SA BE $4.74 16 1 Private 99 Lyric Labs IN $4.38 41 5 Private 100 Intrawelt IT $4.18 16 4 Private Table 1: The Top 100 Global Language Service Providers in 2012 Source: Common Sense Advisory, Inc. Observations on the Top 100 Global LSPs in 2012 How have the top-ranked companies changed since last year? This year, there are several important developments worth highlighting:  Most of the largest players grew by leaps and bounds. At the very top of the list, we see U.S. military contractor Mission Essential Personnel, which added more than US$100 million in revenue compared to the previous year. Lionbridge grew by more than US$20 million, TransPerfect increased by US$50 million, and SDL added more than US$40 million. All in all, it was a lucrative year for most of the top-ranked providers. With a decrease in revenue, HP ACG dropped one spot in the list.  Other top firms also reported growth. Also at the top of the list, we find STAR, euroscript, ManpowerGroup, and RWS. Each of these companies reported increases in 2011 as well, with euroscript and RWS growing by nearly US$10 million. Welocalize vaults to the top 10 largest companies this year, jumping up eight spots since last year and adding more revenue than most firms in its size range.  Companies in the top fifth of the ranking post solid numbers. CLS had a banner year, adding more than US$10 million in revenue, while Honyaku grew by US$14 million, pushing past fellow Japanese competitor Yamagata, which reported a slight decrease. Semantix added a noteworthy US$8 million over the past year, while firms like thebigword, Moravia, Logos Group, and hiSoft all posted smaller but respectable increases. This year’s Top 20 also sees a telephone interpreting provider, Cyracom, which grew by around US$6 million. Australian provider ONCALL also hits near the top of the list, adding US$8 million since last year.
  • 6. The Top 100 Language Service Providers 6 Copyright © 2012 by Common Sense Advisory, Inc. 31 May 2012 Unauthorized Reproduction & Distribution Prohibited www.commonsenseadvisory.com The Size of the Language Services Market in 2012 Our market sizing exercise draws on multiple sets of data. The first dataset is our global directory of language service providers (LSPs) that we maintain and update on a continuing basis throughout the year. At the time of publication, our directory contained 26,104 LSPs – that is, companies with two or more employees. Our second dataset consists of the respondents to our annual survey of suppliers. This year, we had 1,119 respondents in total. Finally, we use a subset of the survey respondents who report their exact revenue to us for purposes of collective analysis or for inclusion in global or regional rankings. The vast majority of LSPs are privately owned – 94.18%, according to this year’s survey. Because they do not generally publish financial data, these firms submit their revenue and other financial data to us confidentially. This year, we had 672 LSPs that provided us with their actual revenue data. While many language service providers are reluctant to share this, enables us to reveal even more detailed information about the market itself, including its regional and sector-specific breakdowns. Common Sense Advisory calculates that the market for outsourced language services is worth US$33.523 billion in 2012. To derive this estimate, we measured actual financial activity for the fiscal year most recently completed (2011). According to the year-to-year changes in revenue and the expected earnings reported by the LSPs we surveyed, we calculate that the language services market is growing in 2012 at an annual rate of 12.17%. As of 2012, Common Sense Advisory calculates that the language services market is growing at an annual rate of 12.17%. The current growth rate is positive news. Prior to 2010, our estimates showed stable double-digit growth rates for the language services industry, even during 2008 and 2009, when the global economy took a tumble. In 2010, the market fell to a slightly lower rate of more than 13%. However, in 2011, the growth rate dropped significantly to just 7.41%. While overall growth has not yet returned to its pre-recession rates, it appears that 2011 was a much better year for the market than 2010, and on par with the growth experienced in 2009. Last year, we estimated that the market would reach US$31.44 billion in 2011. The actual reported data from 2011 shows that the number was actually US$29.89 billion instead. Why the shortfall? Our estimated growth rate uses a weighted average of the actual reported growth rate for the prior year and suppliers’ projected growth rates for
  • 7. The Top 100 Language Service Providers 7 Copyright © 2012 by Common Sense Advisory, Inc. 31 May 2012 Unauthorized Reproduction & Distribution Prohibited www.commonsenseadvisory.com the year ahead. LSPs do not always perfectly estimate how much they will earn in the year to come. For this reason, we look backward at the amount of revenue suppliers actually reported in the prior year, so that we can fine-tune our adjustments for the next five-year period. Our prior estimate for 2012 showed that the market would reach US$33.77 billion, while this year’s estimates show that it will reach US$33.52 billion. In other words, our 2012 estimates are highly consistent with the projected estimates for 2012 we issued last year. North America Shrinks While Europe and Asia Grow To divide up the world, we follow the classifications developed by the United Nations. How much revenue does each part of the world receive from language services? Europe (49.38%) makes up the largest region this year, followed by North America (34.85%) and Asia (12.88%) (see Table 1). The smallest geographic tier consists of Oceania (2.00%), Latin America (0.63%), and Africa (0.27%). Because Europe is such a large market, we divide it up into four main parts. This gives us a total of nine major regions (see Figure 1). Region Market Share 2011 US$ M 2012 US$ M 2013 US$ M 2014 US$ M 2015 US$ M Africa 0.27% 81 91 102 114 128 Asia 12.88% 3,849 4,318 4,843 5,433 6,094 Europe 49.38% 14,757 16,553 18,569 20,830 23,365 Europe - Eastern 4.39% 1,312 1,472 1,651 1,852 2,077 Europe - Northern 18.86% 5,636 6,322 7,092 7,956 8,924 Europe - Southern 3.44% 1,028 1,153 1,294 1,451 1,628 Europe - Western 22.69% 6,781 7,606 8,532 9,571 10,736 Latin America 0.63% 188 211 237 266 298 North America 34.85% 10,415 11,683 13,105 14,700 16,490 Oceania 2.00% 598 670 752 844 946 TOTALS 100.00% 29,885 33,523 37,604 42,182 47,317 Table 2: Language Services Market Share by Region Source: Common Sense Advisory, Inc. Let us look at the recent historical and current market shares for each area of the world for each of the years for which we have collected data in our most recent format (see Table 2). We can observe several important changes in the geographic composition of the market from 2011 to 2012:
  • 8. The Top 100 Language Service Providers 8 Copyright © 2012 by Common Sense Advisory, Inc. 31 May 2012 Unauthorized Reproduction & Distribution Prohibited www.commonsenseadvisory.com Figure 1: Global Language Services Market Share by Region Source: Common Sense Advisory, Inc.  North America cuts spending. As the U.S. has reduced its military involvement in Afghanistan and Iraq, the total amount spent on language services in North America appears to have decreased. In the private sector, businesses have been cautious with their spending and many have attempted to slow or reduce their expenditures on translation (see “Understanding Your Customer’s Translation Performance,” Dec11.)
  • 9. The Top 100 Language Service Providers 9 Copyright © 2012 by Common Sense Advisory, Inc. 31 May 2012 Unauthorized Reproduction & Distribution Prohibited www.commonsenseadvisory.com Region Market Share 2010 Market Share 2011 Market Share 2012 Africa 0.13% 0.26% 0.27% Asia 8.59% 7.43% 12.88% Europe 42.26% 42.07% 49.38% Europe - Eastern 4.49% 2.84% 4.39% Europe - Northern 11.10% 12.71% 18.86% Europe - Southern 7.67% 5.39% 3.44% Europe - Western 19.00% 21.13% 22.69% North America 48.50% 49.25% 34.85% Oceania 0.35% 0.66% 2.00% Latin America 0.18% 0.32% 0.63% Totals 100.00% 100.00% 100.00% Table 3: Historical Change in Market Share by Region Source: Common Sense Advisory, Inc.  Asia gains significant ground. Asia lost language services market share slightly in 2011 when compared with other regions, but appears to be gaining in 2012, fueled largely by China. This is the first year in our study that Asia reaches a double-digit percentage of total market share, an important milestone for this part of the world.  Western and Northern Europe keep climbing. Led by France, Germany, and the United Kingdom, these two sub-regions of Europe show impressive increases in market share. Southern Europe continued to lose out on market share overall, while Eastern Europe returned to the same share it had two years prior. Our survey sample, with 1,119 LSPs out of 26,104 companies globally, represents 4.29% of the total population. This year, we collected exact revenue from 672 companies that contributed a total of US$4.92 billion to the market in 2011. According to our calculations based on the exact revenue provided, the 2011 market was US$29.885 billion. In other words, our sample made up 4.29% of language service providers worldwide that accounted for 14.30% of global revenue. What about the remaining 25,432 LSPs in our directory? Most of them contribute much smaller amounts, but their revenue accounts for the majority of the market. On average, each of these companies earns less than US$1 million annually. However, the scope ranges tremendously in size. There are LSPs we are aware of in this group that earn tens or even hundreds of millions of dollars – including some military contractors for the U.S. government. This group also includes LSPs in low-cost locations that might employ dozens of workers but take in less than US$10,000 per year, reflecting once again the highly fragmented nature of the market.