Marginal costing graphical explanation by yata veerabrahmam
•
1 like•173 views

i am introducing a new way of learning marginal costing technique with an in-depth graphical explanation.

Recommended
More Related Content
What's hot
What's hot (19)
Similar to Marginal costing graphical explanation by yata veerabrahmam
Similar to Marginal costing graphical explanation by yata veerabrahmam (20)
Recently uploaded
Recently uploaded (20)
Marginal costing graphical explanation by yata veerabrahmam
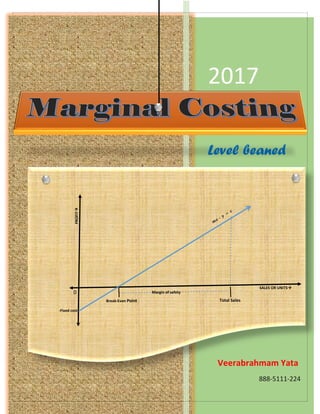
- 1. 2017 Veerabrahmam Yata 888-5111-224 Level beaned 0 Margin of safety PROFIT -Fixed cost SALES OR UNITS Break-Even Point Total Sales
- 2. MARGINAL COSTING PROFIT: The margin, earning over the total cost value on total sales done is profit. If this profit is negative value it will be called as loss. Hear total cost includes both variable cost and fixed costs. Marginal cost: An additional cost incurred on an extra unit of production is called marginal cost. Hear variable cost is the marginal cost. Variable cost in the sense all direct expenses and variable overheads. NAME RS SHORT NAME REMARKS Sales XXX = S Per unit is constant (-) Variable Cost XXX = V.C Per unit is constant =Contribution XXX = S – V.C Per unit is constant (-)Fixed Cost XXX = F.C Total value is constant =Profit XXX = S – V.C – F.C Vary according to sales SAMPLE TABLE TO SHOW RELATION BETWEEN SALES AND PROFIT: UNITS SALES at 100/- VARIBLE COST at 50/- FIXED COST TOTAL COST V.C + F.C PROFIT/ LOSS 0 0 0 200 200 -200 1 100 50 200 250 -150 2 200 100 200 300 -100 3 300 150 200 350 -50 4 400 200 200 400 0 5 500 250 200 450 50 6 600 300 200 500 100 7 700 350 200 550 150 8 800 400 200 600 200 9 900 450 200 650 250 10 1000 500 200 700 300 -400 -200 0 200 400 600 0 200 400 600 800 1000 1200 1400 Profit/Loss Total Sales PROFIT/ LOSS BASED ON TOTAL SALES -400 -200 0 200 400 600 0 2 4 6 8 10 12 14 Profit/Loss Units PROFIT/ LOSS BASED ON UNITS SOLED
- 3. Observations: 1) This line locks like a straight line. 2) At ‘0’ units of production the total fixed cost will be the loss. 3) At certain point, the total fixed cost burden will be controlled and total sales will be equal to total cost. That point of sales is called break-even point of sales. Hear the profit will be zero. 4) After crossing the break-even point only profit will be earned. This is safety level. 5) The total sales beaned break-even point sales is called margin of safety. Solving the straight line equation: The line is in increasing direction so the line equation most be (M) X – Y = C [‘.’ y=mx – c] Hear ‘X’ is sales or units ‘Y’ is profit ‘M’ is slope of line At 0 level of sale: Profit = - F.C So (M)*0 – (-F.C) = C 0 Margin of safety PROFIT -Fixed cost SALES OR UNITS Break-Even Point Total Sales C = F.C
- 4. If ‘X’ is sales, then If ‘X’ is units, then change in profit change in sales {(contribution1-F.C 1)-(contribution2-F.C 2)} (sales 1-sales 2) change in contribution change in sales cont. 1- cont. 2 sales 1-sales 2 (cont. per unit 1*no of units 1)- (cont. Per unit 2*no of units 2) (Selling price per unit 1*no of units 1)-(Selling price per unit 2*no of units 2) (no of units 1-no of unis 2)*cont. Per unit (no of units 1-no of unis 2)*selling price per unit change in contribution change in sales cont. Per unit selling price per unit cont. sales change in profit change in sales change in profit change in no of units {(contribution1-F.C 1)-(contribution2-F.C 2)} (no of units 1-no of units 2) change in contribution change in no of units cont. 1- cont. 2 no of units 1-no of units 2 (cont. per unit 1*no of units 1)- (cont. Per unit 2*no of units 2) no of units 1-no of units 2 (no of units 1-no of unis 2)*cont. Per unit (no of units 1-no of unis 2) change in profit change in units cont. Per unit = change in contribution change in no of units Slope = ‘.’ F.C is constant.= Slope = = = = ‘.’ Cont. per unit and selling price per unit are constant. = Slope = = P/v ration = Slope = ‘.’ F.C is constant.= Slope = = = = ‘.’ Cont. per unit is constant. = Slope = = profit volume ration = =
- 5. The straight line equations will be: 1. If ‘X’ is sales: 2. If ‘X’ is units: By using this straight line method we can find any formula 1. FINDING THE BREAK-EVEN POINT: We know that at breakeven point the profit will be ‘0’ BREAK-EVEN POINT IN VOLUME: P/v ratio x sales – 0 = F.C Sales = F.C / p/v ratio BREAK-EVEN POINT IN UNITS: Cont. per unit x no of units – 0 = F.C No of units = F.C / cont. per unit 2. FINDING THE TOTAL SALES: 3. FINDING MARGIN OF SAFETY: So we have no need to remember all these formulas, if we remember those straight lime equations. TOTAL SALES IN VOLUME: P/v ratio x sales – profit = F.C Sales = (F.C + profit) / p/v ratio TOTAL SALES IN UNITS: Cont. per unit x no of units – profit = F.C No of units = (F.C + profit) / cont. per unit MARGIN OF SAFETY IN VOLUME: M.O.S = TOTAL SALES – BREAKEVEN = (F.C + profit – F.C) / p/v ratio M.O.S in Sales = profit / p/v ratio MARGIN OF SAFETY IN UNITS: M.O.S = TOTAL SALES – BREAKEVEN = (F.C + profit – F.C) / cont. per unit M.O.S in units = profit / cont. per unit P/V Ratio x Sales – Profit = F.C Cont. per Unit x No of Units – Profit = F.C
- 6. Example problem-1: At 20 units of sale the profit will be 800/- and at 30 units of sale the profit will be 1300/-. If the selling price per unit is 100/- Then find (i). Break-even point in units. (ii). Fixed cost And (iii). Variable cost per unit Solution: (i). At break-even point of ‘x’ units sale the profit = 0 Slope = => X = B.E.P in units = 4 units (ii). Cont. per unit = = = 50 Cont. at 20 units = 50 X 20 = 1000 Profit at 20 units = 800 We know “cont. – F.C = profit” 1000 – X = 800 F.C = X = 200 (iii).Without knowing selling price we can’t find variable cost per unit. The given selling price is 100/- and cont. per unit is 50/- So variable cost per unit is 100 – 50 = 50/- Example problem-2: At 20 units of sale the profit will be 37.5% and at 30 units of sale the profit will be 50%. If the selling price per unit is 100/- what will be the sale to ern profit of 12.5%. Solution: At 20 units of sale the profit = 20 x 100 x 37.5% = 750 At 30 units of sale the profit = 30 x 100 x 50% = 1500 Slope = => X = 1200 change in profit change in units 1300 - 800 30 - 20 800 - 0 20 - x change in profit change in units 1300 - 800 30 - 20 change in profit change in sales 1500 - 750 (30x100 - 20x100) 750 – (X)50% 2000 – (X)100% = =
- 7. PROJECT SELECTION CRITERIA So many alternatives may be available on market for producing same products. We can exchange variable cost like man power with fixed cost like machinery likewise we can replace fixed costs and variable costs. So we can reduce the risk. In this situation we have to select a best project from the available project available in market, for this selection criteria we should follow some technics and methods. Here I am introducing a new technic for easy selection. By using this equilibrium sale technic we can chose the best project from the availability. Selection criteria: Equilibrium point shows the two projects can produce same amount of profit at same sales level. Sales before equilibrium point: the project which has lower p/v ratio or lower contribution per unit will produce higher profit. In other words project which has lower F.C and higher V.C will produce more profit. Sales after equilibrium point: the project which has higher p/v ratio or higher contribution per unit will produce higher profit. In other words project which has higher F.C and lower V.C will produce more profit. Equilibrium sales Sales or units-0 Profitloss Project - 1 Project - 2 Equilibrium profit Equilibrium analysis
- 8. Equilibrium sales: By solving the two straight line equations we can find the equilibrium sales Cont. per Unit1 x No of Units – Profit = F.C1 Cont. per Unit2 x No of Units – Profit = F.C2 (Cont. per Unit1 - Cont. per Unit2) x No of Units= F.C1 - F.C2 So, Equilibrium sales in units: No of Units = Equilibrium sales in volume: OR If in both projects selling price per unit is same, OR ( F.C1 - F.C2) (Cont. per Unit1 - Cont. per Unit2) X price per unit Sales = ( F.C1 - F.C2) (Cont. per Unit1 - Cont. per Unit2) Sales = ( F.C1 - F.C2) (P/V ratio1 – P/V ratio2) No of units = ( F.C1 - F.C2) (V.C per unit2 – V.C per unit1) X price per unitSales = ( F.C1 - F.C2) (V.C per unit2 – V.C per unit1)
- 9. Example problem: For producing same product there are two different projects available in market. In one project F.C is 20000/-. V.C is 50/- per unit. In another project F.C is 30000/- , V.C is 30/- per unit. So witch project should be selected for three branches of the company if demand for the product is 600 units in BRANCH-1, 400 units in BRANCH-2 and 500 units in BRANCH-3. Solution: Here selling price is same in each project. So, = (30000-20000) / (50-30) = 500 units If the demand is more than 500 units, better to choose the project which has higher F.C and lower V.C If the demand is not more than 500 units, better to choose the project which has lower F.C and higher V.C Equilibrium No of units = ( F.C1 - F.C2) (V.C per unit2 – V.C per unit1)