SlideShare a Scribd company logo
1 of 6
Aleksey Narko
II year Management
Econometrics Final Project
I took the data set about the wealth of nations and in particular the dependence between the
population and total wealth of the country (nation).
Source: http://data.worldbank.org/data-catalog/wealth-of-nations

Step 1: Anova analysis
A) Anova
The first factor (independent variable) is the income(low, lower middle, upper
middle,high)

P value is less than 5 % so we reject the null hypothese at 5 % level.
That means that Income is different among different groups.

Hypotheses of One-Way Anova Analysis:
Reject Ho
H1: not all the Income means are the same

H1 : Not all μ i are the same
Conclusion: Not all the Income means are the same among different groups.

B) Checking homoskedasticity
Hartley Statistic
H= (max{s12…sk2})/(min{s12…sk2})

In my case H = 28775,7 which seems to be bad
Bartlett test

My p-value is much less than 5%. After these two tests I can draw a conclusion that I have a
very serious problem with heteroskedasticity.
I don’t need to use Anova.

Step 2: Regression
A) Regression analysis

•

R2=7,1% and it is very low, which means that the dividing line between small and big
Total Wealth is not well coincided with the line between the big and small population of
the countries.

•

The standard error is equal to 1, 94E+13 of total wealth which is quiet big, compared
with the smallest amount of population among the countries.

•

Slope=36787-unitary increase by one mean in the population gives us 36787 dollars in
Total Wealth more

•

Y =3,34E+12 (intercept) +36787*X (population)

•

T stat=Slope/Standard error=3,28
•

P value=0,0013< 5%-reject, there is a significance between cylinders and displacement.

•

[14618; 58956]
The first number is the least in total wealth we can get by increase in one unit of
population(man), and the second is the maximum we can get by increase in one unit.
•

F test :
H0: R2=0- reject, model significant
Ha: R2>0

•

After sorting the studentized residuals I got two King Kongs: 71 and 135, which are >3

•

After eliminating these King Kongs we get R2=12,2% which means that our result improved a little
bit more than for 5% as previous R2 before elimination was 7,1%,which means that we need to
make another elimination process.

Regression Statistics
Multiple R
0,349702
R Square
0,122292
Adjusted R Square 0,115932
Standard Error
6,7E+12
Observations
140

•

After sorting the studentized residuals I got 4 King Kongs: 69,47,133,51,which are bigger
than 3.
69
47
133
51

•

3,889923198
4,856760879
5,488564929
6,213019657

After eliminating these King Kongs we get R2=22,1% which means that our result improved for
more than 5% as previous R2 before elimination was 12,2%,which means that we need to make
another elimination process.
Regression Statistics

Multiple R

0,47065427
R Square
Adjusted R Square
Standard Error
Observations

•

After sorting the studentized residuals I got 3 King Kongs: 24, 110 and 129 which are
bigger than 3.
24
110
129

•

0,221515442
0,215705856
4,46825E+12
136

3,448344982
3,480936339
8,403463852

After eliminating these King Kongs we get R2=23,4% which means that our result improved for
less than 5% as previous R2 before elimination was 22,1%, which means that at this time
elimination process didn’t improve the model a lot and we can stop it.

Regression Statistics
Multiple R
0,488095929
R Square
0,238237636
Adjusted R Square 0,232422656
Standard Error
4,31091E+12
Observations
133
Significance
F
2,53083E-09

•

Our P value is equal to 2,53E-09 and it means that it is not significant, which means that the pour
fit of the model is definitely not due to the presence of outliers.

B) Checking Normality
Here we don’t have any problems, because our sample size is much bigger than 30.

C) Checking Homoscedasticity
In our case we got Heteroskedasticity, because the growing number of residuals means growing
spread of percentage.
Fact:
Total wealth study produces simple regression model with heteroskedastic outliers. This is the most
likely reason for the poor fit of the model.

D) Checking autocorrelation
lag

ACF
1
2

PACF

0,009747857
0,085140888

0,009747857
0,085244009

1.96/sqrt(n)

-1.96/sqrt(n)

0,169953554

-0,169953554

0,169953554

-0,169953554

My ACF is between U and L, which means that I don’t have autocorrelation.

STEP 3: Final Interpretation
All these results that I got tell me that even with the problems of heteroscedasticity and these King
Kongs my model is significant and because of the lack of the problem with autocorrelation there is a
powerful relation between the Population and Total Wealth of the country.

More Related Content

What's hot

Econometrics Final Project
Econometrics Final ProjectEconometrics Final Project
Econometrics Final Project
Walker Hansen
 
Multicollinearity1
Multicollinearity1Multicollinearity1
Multicollinearity1
Muhammad Ali
 
Autocorrelation
AutocorrelationAutocorrelation
Autocorrelation
Akram Ali
 
Heteroskedasticity
HeteroskedasticityHeteroskedasticity
Heteroskedasticity
halimuth
 
19 ch ken black solution
19 ch ken black solution19 ch ken black solution
19 ch ken black solution
Krunal Shah
 

What's hot (20)

Econometrics Final Project
Econometrics Final ProjectEconometrics Final Project
Econometrics Final Project
 
Econometric lec3.ppt
Econometric  lec3.pptEconometric  lec3.ppt
Econometric lec3.ppt
 
MACROECONOMICS-CH5
MACROECONOMICS-CH5MACROECONOMICS-CH5
MACROECONOMICS-CH5
 
Multicollinearity1
Multicollinearity1Multicollinearity1
Multicollinearity1
 
Overview of econometrics 1
Overview of econometrics 1Overview of econometrics 1
Overview of econometrics 1
 
Autocorrelation (1)
Autocorrelation (1)Autocorrelation (1)
Autocorrelation (1)
 
MACROECONOMICS-CH7
MACROECONOMICS-CH7MACROECONOMICS-CH7
MACROECONOMICS-CH7
 
Extended is lm
Extended is lmExtended is lm
Extended is lm
 
Heteroscedasticity
HeteroscedasticityHeteroscedasticity
Heteroscedasticity
 
Basic concepts of_econometrics
Basic concepts of_econometricsBasic concepts of_econometrics
Basic concepts of_econometrics
 
Autocorrelation
AutocorrelationAutocorrelation
Autocorrelation
 
Business Statistics Chapter 9
Business Statistics Chapter 9Business Statistics Chapter 9
Business Statistics Chapter 9
 
Heteroskedasticity
HeteroskedasticityHeteroskedasticity
Heteroskedasticity
 
Mankiw6e chap11
Mankiw6e chap11Mankiw6e chap11
Mankiw6e chap11
 
Gregory mankiw macroeconomic 7th edition chapter (15)
Gregory mankiw macroeconomic 7th edition chapter  (15)Gregory mankiw macroeconomic 7th edition chapter  (15)
Gregory mankiw macroeconomic 7th edition chapter (15)
 
Multicollinearity PPT
Multicollinearity PPTMulticollinearity PPT
Multicollinearity PPT
 
Asymmetric information in insurance market
Asymmetric information in insurance marketAsymmetric information in insurance market
Asymmetric information in insurance market
 
Econometrics - lecture 18 and 19
Econometrics - lecture 18 and 19Econometrics - lecture 18 and 19
Econometrics - lecture 18 and 19
 
Econometrics ch2
Econometrics ch2Econometrics ch2
Econometrics ch2
 
19 ch ken black solution
19 ch ken black solution19 ch ken black solution
19 ch ken black solution
 

Viewers also liked

Regression analysis project
Regression analysis projectRegression analysis project
Regression analysis project
MAS261
 
EC4417 Econometrics Project
EC4417 Econometrics ProjectEC4417 Econometrics Project
EC4417 Econometrics Project
Lonan Carroll
 
Topic 18 multiple regression
Topic 18 multiple regressionTopic 18 multiple regression
Topic 18 multiple regression
Sizwan Ahammed
 
Multiple Regression worked example (July 2014 updated)
Multiple Regression worked example (July 2014 updated)Multiple Regression worked example (July 2014 updated)
Multiple Regression worked example (July 2014 updated)
Michael Ling
 
ECONOMETRICS PROJECT PG2 2015
ECONOMETRICS PROJECT PG2 2015ECONOMETRICS PROJECT PG2 2015
ECONOMETRICS PROJECT PG2 2015
Sayantan Baidya
 
Multiple regression presentation
Multiple regression presentationMultiple regression presentation
Multiple regression presentation
Carlo Magno
 
Econometrics lecture 1st
Econometrics lecture 1stEconometrics lecture 1st
Econometrics lecture 1st
Ishaq Ahmad
 
Topic17 regression spss
Topic17 regression spssTopic17 regression spss
Topic17 regression spss
Sizwan Ahammed
 
multiple linear reggression model
multiple linear reggression modelmultiple linear reggression model
multiple linear reggression model
OmarSalih
 
Econometrics Project - What are the determinants of giving in Uganda
Econometrics Project - What are the determinants of giving in UgandaEconometrics Project - What are the determinants of giving in Uganda
Econometrics Project - What are the determinants of giving in Uganda
Daniel Drummond
 

Viewers also liked (20)

Regression analysis project
Regression analysis projectRegression analysis project
Regression analysis project
 
EC4417 Econometrics Project
EC4417 Econometrics ProjectEC4417 Econometrics Project
EC4417 Econometrics Project
 
Topic 18 multiple regression
Topic 18 multiple regressionTopic 18 multiple regression
Topic 18 multiple regression
 
Multiple Regression worked example (July 2014 updated)
Multiple Regression worked example (July 2014 updated)Multiple Regression worked example (July 2014 updated)
Multiple Regression worked example (July 2014 updated)
 
ECONOMETRICS PROJECT PG2 2015
ECONOMETRICS PROJECT PG2 2015ECONOMETRICS PROJECT PG2 2015
ECONOMETRICS PROJECT PG2 2015
 
Econometrics Project
Econometrics ProjectEconometrics Project
Econometrics Project
 
Stage Detection Of A Product In Its Life
Stage Detection Of A Product In Its LifeStage Detection Of A Product In Its Life
Stage Detection Of A Product In Its Life
 
ECON PROJECT FINAL1
ECON PROJECT FINAL1ECON PROJECT FINAL1
ECON PROJECT FINAL1
 
The Barings Bank Collapse
The Barings Bank CollapseThe Barings Bank Collapse
The Barings Bank Collapse
 
Basic econometrics lectues_1
Basic econometrics lectues_1Basic econometrics lectues_1
Basic econometrics lectues_1
 
Multiple regression presentation
Multiple regression presentationMultiple regression presentation
Multiple regression presentation
 
Econometrics lecture 1st
Econometrics lecture 1stEconometrics lecture 1st
Econometrics lecture 1st
 
Econometrics notes (Introduction, Simple Linear regression, Multiple linear r...
Econometrics notes (Introduction, Simple Linear regression, Multiple linear r...Econometrics notes (Introduction, Simple Linear regression, Multiple linear r...
Econometrics notes (Introduction, Simple Linear regression, Multiple linear r...
 
Topic17 regression spss
Topic17 regression spssTopic17 regression spss
Topic17 regression spss
 
Analysis of Negative Interest Rates in America
Analysis of Negative Interest Rates in AmericaAnalysis of Negative Interest Rates in America
Analysis of Negative Interest Rates in America
 
multiple linear reggression model
multiple linear reggression modelmultiple linear reggression model
multiple linear reggression model
 
Advanced microeconometric project
Advanced microeconometric projectAdvanced microeconometric project
Advanced microeconometric project
 
Econometrics Project - What are the determinants of giving in Uganda
Econometrics Project - What are the determinants of giving in UgandaEconometrics Project - What are the determinants of giving in Uganda
Econometrics Project - What are the determinants of giving in Uganda
 
Ecm time series forecast
Ecm time series forecastEcm time series forecast
Ecm time series forecast
 
Brandie and Michaella's Project
Brandie and Michaella's ProjectBrandie and Michaella's Project
Brandie and Michaella's Project
 

Similar to Econometrics Final Project

InstructionDue Date 6 pm on October 28 (Wed)Part IProbability a.docx
InstructionDue Date 6 pm on October 28 (Wed)Part IProbability a.docxInstructionDue Date 6 pm on October 28 (Wed)Part IProbability a.docx
InstructionDue Date 6 pm on October 28 (Wed)Part IProbability a.docx
dirkrplav
 
C2 st lecture 12 the chi squared-test handout
C2 st lecture 12   the chi squared-test handoutC2 st lecture 12   the chi squared-test handout
C2 st lecture 12 the chi squared-test handout
fatima d
 
Chapter 10
Chapter 10Chapter 10
Chapter 10
bmcfad01
 
Chapter 11
Chapter 11Chapter 11
Chapter 11
bmcfad01
 
Statistics practice for finalBe sure to review the following.docx
Statistics practice for finalBe sure to review the following.docxStatistics practice for finalBe sure to review the following.docx
Statistics practice for finalBe sure to review the following.docx
dessiechisomjj4
 

Similar to Econometrics Final Project (20)

Statr session 17 and 18
Statr session 17 and 18Statr session 17 and 18
Statr session 17 and 18
 
Statr session 17 and 18 (ASTR)
Statr session 17 and 18 (ASTR)Statr session 17 and 18 (ASTR)
Statr session 17 and 18 (ASTR)
 
QNT 561 Week 4 Weekly Learning Assessments
QNT 561 Week 4 Weekly Learning Assessments  QNT 561 Week 4 Weekly Learning Assessments
QNT 561 Week 4 Weekly Learning Assessments
 
Cairo 02 Stat Inference
Cairo 02 Stat InferenceCairo 02 Stat Inference
Cairo 02 Stat Inference
 
Probability Distributions for Discrete Variables
Probability Distributions for Discrete VariablesProbability Distributions for Discrete Variables
Probability Distributions for Discrete Variables
 
Hypothesis testing
Hypothesis testingHypothesis testing
Hypothesis testing
 
Multiple Regression.ppt
Multiple Regression.pptMultiple Regression.ppt
Multiple Regression.ppt
 
1667390753_Lind Chapter 10-14.pdf
1667390753_Lind Chapter 10-14.pdf1667390753_Lind Chapter 10-14.pdf
1667390753_Lind Chapter 10-14.pdf
 
Chap010.ppt
Chap010.pptChap010.ppt
Chap010.ppt
 
InstructionDue Date 6 pm on October 28 (Wed)Part IProbability a.docx
InstructionDue Date 6 pm on October 28 (Wed)Part IProbability a.docxInstructionDue Date 6 pm on October 28 (Wed)Part IProbability a.docx
InstructionDue Date 6 pm on October 28 (Wed)Part IProbability a.docx
 
Presentation on Hypothesis Test by Ashik Amin Prem
Presentation on Hypothesis Test by Ashik Amin PremPresentation on Hypothesis Test by Ashik Amin Prem
Presentation on Hypothesis Test by Ashik Amin Prem
 
Chapter 15
Chapter 15 Chapter 15
Chapter 15
 
Statistics For Management 3 October
Statistics For Management 3 OctoberStatistics For Management 3 October
Statistics For Management 3 October
 
Chapter 10
Chapter 10Chapter 10
Chapter 10
 
Degree presentation: Indirect Inference Applied to Financial Econometrics
Degree presentation: Indirect Inference Applied to Financial EconometricsDegree presentation: Indirect Inference Applied to Financial Econometrics
Degree presentation: Indirect Inference Applied to Financial Econometrics
 
QNT Weekly learning assessments - Questions and Answers | UOP E Assignments
QNT Weekly learning assessments - Questions and Answers | UOP E AssignmentsQNT Weekly learning assessments - Questions and Answers | UOP E Assignments
QNT Weekly learning assessments - Questions and Answers | UOP E Assignments
 
C2 st lecture 12 the chi squared-test handout
C2 st lecture 12   the chi squared-test handoutC2 st lecture 12   the chi squared-test handout
C2 st lecture 12 the chi squared-test handout
 
Chapter 10
Chapter 10Chapter 10
Chapter 10
 
Chapter 11
Chapter 11Chapter 11
Chapter 11
 
Statistics practice for finalBe sure to review the following.docx
Statistics practice for finalBe sure to review the following.docxStatistics practice for finalBe sure to review the following.docx
Statistics practice for finalBe sure to review the following.docx
 

More from Aliaksey Narko

Prezentacja platformy ITelite
Prezentacja platformy ITelitePrezentacja platformy ITelite
Prezentacja platformy ITelite
Aliaksey Narko
 
Final report hollywood cluster
Final report hollywood clusterFinal report hollywood cluster
Final report hollywood cluster
Aliaksey Narko
 

More from Aliaksey Narko (20)

Prezentacja platformy ITelite
Prezentacja platformy ITelitePrezentacja platformy ITelite
Prezentacja platformy ITelite
 
I am ECO (Amsterdam eco-city project)
I am ECO (Amsterdam eco-city project)I am ECO (Amsterdam eco-city project)
I am ECO (Amsterdam eco-city project)
 
I am ECO (Amsterdam eco-city presentation)
I am ECO (Amsterdam eco-city presentation)I am ECO (Amsterdam eco-city presentation)
I am ECO (Amsterdam eco-city presentation)
 
Viral Promotion as a part of Viral Marketing
Viral Promotion as a part of Viral MarketingViral Promotion as a part of Viral Marketing
Viral Promotion as a part of Viral Marketing
 
Final report hollywood cluster
Final report hollywood clusterFinal report hollywood cluster
Final report hollywood cluster
 
Hollywood Motion Picture Cluster
Hollywood Motion Picture ClusterHollywood Motion Picture Cluster
Hollywood Motion Picture Cluster
 
New Product Development (Music Industry)
New Product Development (Music Industry)New Product Development (Music Industry)
New Product Development (Music Industry)
 
Red Bull&Alcohol
Red Bull&AlcoholRed Bull&Alcohol
Red Bull&Alcohol
 
Alianza DXB
Alianza DXBAlianza DXB
Alianza DXB
 
Psychology in Economics:Analyzing myself
Psychology in Economics:Analyzing myselfPsychology in Economics:Analyzing myself
Psychology in Economics:Analyzing myself
 
My Personal Negotiation style
My Personal Negotiation styleMy Personal Negotiation style
My Personal Negotiation style
 
Business Plan: Picturesque Poland
Business Plan: Picturesque PolandBusiness Plan: Picturesque Poland
Business Plan: Picturesque Poland
 
Cityspace
CityspaceCityspace
Cityspace
 
Wachovia corporation
Wachovia corporationWachovia corporation
Wachovia corporation
 
Electrolux: the acquisition and integration of ZANUSSI
Electrolux: the acquisition and integration of ZANUSSIElectrolux: the acquisition and integration of ZANUSSI
Electrolux: the acquisition and integration of ZANUSSI
 
Russia:Research and Analysis of the Market
Russia:Research and Analysis of the MarketRussia:Research and Analysis of the Market
Russia:Research and Analysis of the Market
 
Belarus after collapse of USSR
Belarus after collapse of USSRBelarus after collapse of USSR
Belarus after collapse of USSR
 
Franchising: McDonals vs Subway
Franchising: McDonals vs SubwayFranchising: McDonals vs Subway
Franchising: McDonals vs Subway
 
Belarusian currency
Belarusian currencyBelarusian currency
Belarusian currency
 
Belarusian banking system
Belarusian banking systemBelarusian banking system
Belarusian banking system
 

Recently uploaded

+971581248768>> SAFE AND ORIGINAL ABORTION PILLS FOR SALE IN DUBAI AND ABUDHA...
+971581248768>> SAFE AND ORIGINAL ABORTION PILLS FOR SALE IN DUBAI AND ABUDHA...+971581248768>> SAFE AND ORIGINAL ABORTION PILLS FOR SALE IN DUBAI AND ABUDHA...
+971581248768>> SAFE AND ORIGINAL ABORTION PILLS FOR SALE IN DUBAI AND ABUDHA...
?#DUbAI#??##{{(☎️+971_581248768%)**%*]'#abortion pills for sale in dubai@
 
Finding Java's Hidden Performance Traps @ DevoxxUK 2024
Finding Java's Hidden Performance Traps @ DevoxxUK 2024Finding Java's Hidden Performance Traps @ DevoxxUK 2024
Finding Java's Hidden Performance Traps @ DevoxxUK 2024
Victor Rentea
 

Recently uploaded (20)

MS Copilot expands with MS Graph connectors
MS Copilot expands with MS Graph connectorsMS Copilot expands with MS Graph connectors
MS Copilot expands with MS Graph connectors
 
Apidays New York 2024 - Accelerating FinTech Innovation by Vasa Krishnan, Fin...
Apidays New York 2024 - Accelerating FinTech Innovation by Vasa Krishnan, Fin...Apidays New York 2024 - Accelerating FinTech Innovation by Vasa Krishnan, Fin...
Apidays New York 2024 - Accelerating FinTech Innovation by Vasa Krishnan, Fin...
 
Corporate and higher education May webinar.pptx
Corporate and higher education May webinar.pptxCorporate and higher education May webinar.pptx
Corporate and higher education May webinar.pptx
 
WSO2's API Vision: Unifying Control, Empowering Developers
WSO2's API Vision: Unifying Control, Empowering DevelopersWSO2's API Vision: Unifying Control, Empowering Developers
WSO2's API Vision: Unifying Control, Empowering Developers
 
Polkadot JAM Slides - Token2049 - By Dr. Gavin Wood
Polkadot JAM Slides - Token2049 - By Dr. Gavin WoodPolkadot JAM Slides - Token2049 - By Dr. Gavin Wood
Polkadot JAM Slides - Token2049 - By Dr. Gavin Wood
 
FWD Group - Insurer Innovation Award 2024
FWD Group - Insurer Innovation Award 2024FWD Group - Insurer Innovation Award 2024
FWD Group - Insurer Innovation Award 2024
 
DBX First Quarter 2024 Investor Presentation
DBX First Quarter 2024 Investor PresentationDBX First Quarter 2024 Investor Presentation
DBX First Quarter 2024 Investor Presentation
 
+971581248768>> SAFE AND ORIGINAL ABORTION PILLS FOR SALE IN DUBAI AND ABUDHA...
+971581248768>> SAFE AND ORIGINAL ABORTION PILLS FOR SALE IN DUBAI AND ABUDHA...+971581248768>> SAFE AND ORIGINAL ABORTION PILLS FOR SALE IN DUBAI AND ABUDHA...
+971581248768>> SAFE AND ORIGINAL ABORTION PILLS FOR SALE IN DUBAI AND ABUDHA...
 
How to Troubleshoot Apps for the Modern Connected Worker
How to Troubleshoot Apps for the Modern Connected WorkerHow to Troubleshoot Apps for the Modern Connected Worker
How to Troubleshoot Apps for the Modern Connected Worker
 
ICT role in 21st century education and its challenges
ICT role in 21st century education and its challengesICT role in 21st century education and its challenges
ICT role in 21st century education and its challenges
 
MINDCTI Revenue Release Quarter One 2024
MINDCTI Revenue Release Quarter One 2024MINDCTI Revenue Release Quarter One 2024
MINDCTI Revenue Release Quarter One 2024
 
presentation ICT roal in 21st century education
presentation ICT roal in 21st century educationpresentation ICT roal in 21st century education
presentation ICT roal in 21st century education
 
Finding Java's Hidden Performance Traps @ DevoxxUK 2024
Finding Java's Hidden Performance Traps @ DevoxxUK 2024Finding Java's Hidden Performance Traps @ DevoxxUK 2024
Finding Java's Hidden Performance Traps @ DevoxxUK 2024
 
Navigating the Deluge_ Dubai Floods and the Resilience of Dubai International...
Navigating the Deluge_ Dubai Floods and the Resilience of Dubai International...Navigating the Deluge_ Dubai Floods and the Resilience of Dubai International...
Navigating the Deluge_ Dubai Floods and the Resilience of Dubai International...
 
Vector Search -An Introduction in Oracle Database 23ai.pptx
Vector Search -An Introduction in Oracle Database 23ai.pptxVector Search -An Introduction in Oracle Database 23ai.pptx
Vector Search -An Introduction in Oracle Database 23ai.pptx
 
Apidays New York 2024 - APIs in 2030: The Risk of Technological Sleepwalk by ...
Apidays New York 2024 - APIs in 2030: The Risk of Technological Sleepwalk by ...Apidays New York 2024 - APIs in 2030: The Risk of Technological Sleepwalk by ...
Apidays New York 2024 - APIs in 2030: The Risk of Technological Sleepwalk by ...
 
Introduction to Multilingual Retrieval Augmented Generation (RAG)
Introduction to Multilingual Retrieval Augmented Generation (RAG)Introduction to Multilingual Retrieval Augmented Generation (RAG)
Introduction to Multilingual Retrieval Augmented Generation (RAG)
 
Apidays New York 2024 - Scaling API-first by Ian Reasor and Radu Cotescu, Adobe
Apidays New York 2024 - Scaling API-first by Ian Reasor and Radu Cotescu, AdobeApidays New York 2024 - Scaling API-first by Ian Reasor and Radu Cotescu, Adobe
Apidays New York 2024 - Scaling API-first by Ian Reasor and Radu Cotescu, Adobe
 
Six Myths about Ontologies: The Basics of Formal Ontology
Six Myths about Ontologies: The Basics of Formal OntologySix Myths about Ontologies: The Basics of Formal Ontology
Six Myths about Ontologies: The Basics of Formal Ontology
 
Connector Corner: Accelerate revenue generation using UiPath API-centric busi...
Connector Corner: Accelerate revenue generation using UiPath API-centric busi...Connector Corner: Accelerate revenue generation using UiPath API-centric busi...
Connector Corner: Accelerate revenue generation using UiPath API-centric busi...
 

Econometrics Final Project

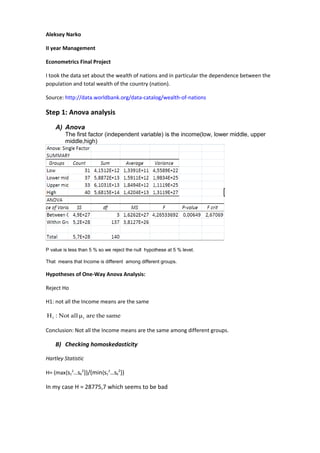
  • 1. Aleksey Narko II year Management Econometrics Final Project I took the data set about the wealth of nations and in particular the dependence between the population and total wealth of the country (nation). Source: http://data.worldbank.org/data-catalog/wealth-of-nations Step 1: Anova analysis A) Anova The first factor (independent variable) is the income(low, lower middle, upper middle,high) P value is less than 5 % so we reject the null hypothese at 5 % level. That means that Income is different among different groups. Hypotheses of One-Way Anova Analysis: Reject Ho H1: not all the Income means are the same H1 : Not all μ i are the same Conclusion: Not all the Income means are the same among different groups. B) Checking homoskedasticity Hartley Statistic H= (max{s12…sk2})/(min{s12…sk2}) In my case H = 28775,7 which seems to be bad
  • 2. Bartlett test My p-value is much less than 5%. After these two tests I can draw a conclusion that I have a very serious problem with heteroskedasticity. I don’t need to use Anova. Step 2: Regression A) Regression analysis • R2=7,1% and it is very low, which means that the dividing line between small and big Total Wealth is not well coincided with the line between the big and small population of the countries. • The standard error is equal to 1, 94E+13 of total wealth which is quiet big, compared with the smallest amount of population among the countries. • Slope=36787-unitary increase by one mean in the population gives us 36787 dollars in Total Wealth more • Y =3,34E+12 (intercept) +36787*X (population) • T stat=Slope/Standard error=3,28
  • 3. • P value=0,0013< 5%-reject, there is a significance between cylinders and displacement. • [14618; 58956] The first number is the least in total wealth we can get by increase in one unit of population(man), and the second is the maximum we can get by increase in one unit. • F test : H0: R2=0- reject, model significant Ha: R2>0 • After sorting the studentized residuals I got two King Kongs: 71 and 135, which are >3 • After eliminating these King Kongs we get R2=12,2% which means that our result improved a little bit more than for 5% as previous R2 before elimination was 7,1%,which means that we need to make another elimination process. Regression Statistics Multiple R 0,349702 R Square 0,122292 Adjusted R Square 0,115932 Standard Error 6,7E+12 Observations 140 • After sorting the studentized residuals I got 4 King Kongs: 69,47,133,51,which are bigger than 3. 69 47 133 51 • 3,889923198 4,856760879 5,488564929 6,213019657 After eliminating these King Kongs we get R2=22,1% which means that our result improved for more than 5% as previous R2 before elimination was 12,2%,which means that we need to make another elimination process. Regression Statistics Multiple R 0,47065427
  • 4. R Square Adjusted R Square Standard Error Observations • After sorting the studentized residuals I got 3 King Kongs: 24, 110 and 129 which are bigger than 3. 24 110 129 • 0,221515442 0,215705856 4,46825E+12 136 3,448344982 3,480936339 8,403463852 After eliminating these King Kongs we get R2=23,4% which means that our result improved for less than 5% as previous R2 before elimination was 22,1%, which means that at this time elimination process didn’t improve the model a lot and we can stop it. Regression Statistics Multiple R 0,488095929 R Square 0,238237636 Adjusted R Square 0,232422656 Standard Error 4,31091E+12 Observations 133 Significance F 2,53083E-09 • Our P value is equal to 2,53E-09 and it means that it is not significant, which means that the pour fit of the model is definitely not due to the presence of outliers. B) Checking Normality Here we don’t have any problems, because our sample size is much bigger than 30. C) Checking Homoscedasticity In our case we got Heteroskedasticity, because the growing number of residuals means growing spread of percentage.
  • 5. Fact: Total wealth study produces simple regression model with heteroskedastic outliers. This is the most likely reason for the poor fit of the model. D) Checking autocorrelation lag ACF 1 2 PACF 0,009747857 0,085140888 0,009747857 0,085244009 1.96/sqrt(n) -1.96/sqrt(n) 0,169953554 -0,169953554 0,169953554 -0,169953554 My ACF is between U and L, which means that I don’t have autocorrelation. STEP 3: Final Interpretation All these results that I got tell me that even with the problems of heteroscedasticity and these King Kongs my model is significant and because of the lack of the problem with autocorrelation there is a powerful relation between the Population and Total Wealth of the country.
  • 6. Fact: Total wealth study produces simple regression model with heteroskedastic outliers. This is the most likely reason for the poor fit of the model. D) Checking autocorrelation lag ACF 1 2 PACF 0,009747857 0,085140888 0,009747857 0,085244009 1.96/sqrt(n) -1.96/sqrt(n) 0,169953554 -0,169953554 0,169953554 -0,169953554 My ACF is between U and L, which means that I don’t have autocorrelation. STEP 3: Final Interpretation All these results that I got tell me that even with the problems of heteroscedasticity and these King Kongs my model is significant and because of the lack of the problem with autocorrelation there is a powerful relation between the Population and Total Wealth of the country.