Unemployment and the trade deficit

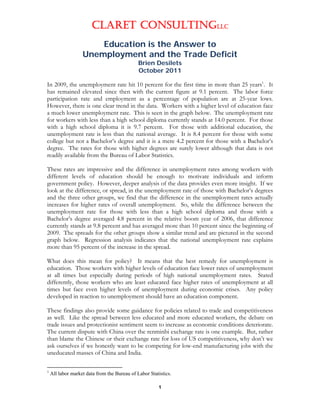
In 2009, the unemployment rate hit 10 percent for the first time in more than 25 years1. It has remained elevated since then with the current figure at 9.1 percent. The labor force participation rate and employment as a percentage of population are at 25-year lows. However, there is one clear trend in the data. Workers with a higher level of education face a much lower unemployment rate. This is seen in the graph below. The unemployment rate for workers with less than a high school diploma currently stands at 14.0 percent. For those with a high school diploma it is 9.7 percent. For those with additional education, the unemployment rate is less than the national average. It is 8.4 percent for those with some college but not a Bachelor’s degree and it is a mere 4.2 percent for those with a Bachelor’s degree. The rates for those with higher degrees are surely lower although that data is not readily available from the Bureau of Labor Statistics.

Recommended
More Related Content
What's hot
What's hot (20)
Similar to Unemployment and the trade deficit
Similar to Unemployment and the trade deficit (20)
More from Brien Desilets
More from Brien Desilets (20)
Recently uploaded
Recently uploaded (20)
Unemployment and the trade deficit
- 1. CLARET CONSULTINGLLC 1 Education is the Answer to Unemployment and the Trade Deficit Brien Desilets October 2011 In 2009, the unemployment rate hit 10 percent for the first time in more than 25 years1 . It has remained elevated since then with the current figure at 9.1 percent. The labor force participation rate and employment as a percentage of population are at 25-year lows. However, there is one clear trend in the data. Workers with a higher level of education face a much lower unemployment rate. This is seen in the graph below. The unemployment rate for workers with less than a high school diploma currently stands at 14.0 percent. For those with a high school diploma it is 9.7 percent. For those with additional education, the unemployment rate is less than the national average. It is 8.4 percent for those with some college but not a Bachelor’s degree and it is a mere 4.2 percent for those with a Bachelor’s degree. The rates for those with higher degrees are surely lower although that data is not readily available from the Bureau of Labor Statistics. These rates are impressive and the difference in unemployment rates among workers with different levels of education should be enough to motivate individuals and inform government policy. However, deeper analysis of the data provides even more insight. If we look at the difference, or spread, in the unemployment rate of those with Bachelor’s degrees and the three other groups, we find that the difference in the unemployment rates actually increases for higher rates of overall unemployment. So, while the difference between the unemployment rate for those with less than a high school diploma and those with a Bachelor’s degree averaged 4.8 percent in the relative boom year of 2006, that difference currently stands at 9.8 percent and has averaged more than 10 percent since the beginning of 2009. The spreads for the other groups show a similar trend and are pictured in the second graph below. Regression analysis indicates that the national unemployment rate explains more than 95 percent of the increase in the spread. What does this mean for policy? It means that the best remedy for unemployment is education. Those workers with higher levels of education face lower rates of unemployment at all times but especially during periods of high national unemployment rates. Stated differently, those workers who are least educated face higher rates of unemployment at all times but face even higher levels of unemployment during economic crises. Any policy developed in reaction to unemployment should have an education component. These findings also provide some guidance for policies related to trade and competitiveness as well. Like the spread between less educated and more educated workers, the debate on trade issues and protectionist sentiment seem to increase as economic conditions deteriorate. The current dispute with China over the renminbi exchange rate is one example. But, rather than blame the Chinese or their exchange rate for loss of US competitiveness, why don’t we ask ourselves if we honestly want to be competing for low-end manufacturing jobs with the uneducated masses of China and India. 1 All labor market data from the Bureau of Labor Statistics.
- 2. CLARET CONSULTINGLLC 2 Manufacturing as a percentage of US GDP has declined from a peak of 28.3 percent in 1953 to less than 12.0 percent in 20102 . That trend is not going to reverse. The services sector, including finance, professional services, health care and information all have grown in their share of GDP. These are the growth sectors that constitute our new economy. The truth is that the US has a trade surplus…in services. This surplus has been growing at an average of more than 6.3 percent since 1992 and at an average of more than 17.3 percent since 2004. By far the largest component of this surplus consists of professional services including financial services and other business, professional and technical services, all of which require highly educated workers. These are the exports that should be targeted for growth by the largest and most advanced economy in the world. For the US to be engaging in political disputes over low-end manufacturing jobs with some of the least developed countries in the world is quite frankly embarrassing. The President is to be commended for focusing on exports as a key to economic growth and reduced unemployment but let us focus on exporting the high quality services that the world’s largest economy should be exporting and developing our labor force to be able to deliver those services. 2 All economic data from Bureau of Economic Analysis.