Unemployment and precarious work must continue in brazil
brazil_economics.docx
1. An Overview of Brazilian economy 2000-2015
Brazil is South America’s largest economy and the world’s 7th
largest overall by both nominal
GDP and purchasing power parity. Covering just under half the landmass of the continent at
8,349,320 Km2, Brazil is the world’s 5th
largest nation. The United Nations currently estimate
the population as 208,997,572 people, equivalent to 2.83% of the total planets population.
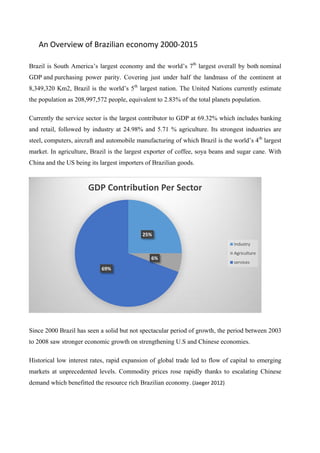
Currently the service sector is the largest contributor to GDP at 69.32% which includes banking
and retail, followed by industry at 24.98% and 5.71 % agriculture. Its strongest industries are
steel, computers, aircraft and automobile manufacturing of which Brazil is the world’s 4th
largest
market. In agriculture, Brazil is the largest exporter of coffee, soya beans and sugar cane. With
China and the US being its largest importers of Brazilian goods.
Since 2000 Brazil has seen a solid but not spectacular period of growth, the period between 2003
to 2008 saw stronger economic growth on strengthening U.S and Chinese economies.
Historical low interest rates, rapid expansion of global trade led to flow of capital to emerging
markets at unprecedented levels. Commodity prices rose rapidly thanks to escalating Chinese
demand which benefitted the resource rich Brazilian economy. (Jaeger 2012)
25%
6%
69%
GDP Contribution Per Sector
Industry
Agriculture
services
2. This comparative advantage led to the overall reduction in the country’s external debts and in the
process, attained substantial current account surpluses and amassed international reserves. Its
main exports of iron ore, coffee, sugar and petroleum are diverse enough for the economy not to
be overly reliant on any one commodity thus reducing any potential damage to the economy of a
fall in any commodities demand or price.
The banking sector having done away with the state bank, has introduced stronger regulatory
supervision on both government owned and private sector banks. Thereby reducing the
likelihood of financial mismanagement that plagued the banking sector of old and thus creating a
stable, reliable system by the end of 2005. On the back of this stability Brazil has seen the export
of semi-manufactured goods rise by 43% and prices rise by 59%, significantly reducing national
debt from 200% on net goods and service exports to less than zero post 2009. (Ali, 2015)
Over this same period a change in governance led to real changes to Brazil’s economy.
Following nearly three decades of poor GDP per capita growth, the election of the Workers Party
to government in 2004, saw economic policies that grew the economy. GDP per capita, grew at
average rates of 2.5% per annum over the period from 2003-14. Despite the brief recession
brought about by the global crises of 2009, Brazil managed a bounce back to growth thanks to a
fiscal policy that reduced taxes on income, consumer credit and luxury goods. It also adopted a
policy of increased public expenditure on investments and decreased the fiscal surplus target
from 3.75% to 2.5% of GDP. The Brazilian government injected liquidity into the market by
reducing the compulsory deposits by their banking sector thus increasing the amount of money
circulating in the economy, they also acted by setting up an international export finance credit
line by drawing down fund from the international currencies reserve. The state owned banks
operated heavily in the credit markets securing funds to finance the private sector struggling to
obtain funds. (Filho and Fernando, 2011).
In 2015 Brazil fell back into negative GDP growth contracting some 2.7%, with drought
threatening blackouts in an economy fuelled by hydroelectric power. Inflation was once again on
the rise. Worries about the biggest trading partner China compounded issues as unemployment
crept up to 8.3% and household spending, the main driver in the economy, fell.
3. Government spending
Since the Lula government took power in 2003 the gap between Government expenditure and
revenue has grown significantly, inflating the budgetary deficit. The gap between expenditure
and tax returns has increased, indicating a widening budget deficit. The primary balance has
decreased from 3.4% in 2008 to 2.4% in 2012. 2014 saw Brazil biggest annual budget deficit.
Overall, the budget gap has doubled to 6.7% of GDP.
This has been largely the consequence of Brazils bid to build a welfare state. Wherein over a
period of 25 years public spending has risen 14% from 22-36%. Pension contributions consume
some 50% of that along with free health care and free university education.
4. The Reduction of Poverty
Since 2003 over 31.5 million people were lifted out of poverty. The income of the bottom 40 %
of the population grew an average of 6.1% per annum, in contrast to 3.1% growth for the rest of
the population. In real terms poverty reduced by 55% up until 2012, decreasing the level of
people under the poverty line from 35.8% to 15.9%, with extreme poverty dropping two-thirds
from 15.2% to 5.3%
50%
15%
10%
7%
6%
3%
9%
Government Spending % GDP
Pensions
Salaries
Social assistance
Health
Investments
Education
Others
35.1 34.4
3.5
4.5
30.8 26.8 25.4 22.6 21.4
0
18.4 15.9
15.2 14
15.2
13.2
11.5 9.5 9 7.6 7.3
0
6.3 5.3
0%
10%
20%
30%
40%
50%
60%
70%
80%
90%
100%
2001 2002 2003 2004 2005 2006 2007 2008 2009 2010 2011 2012 2013 2014 2015
Poverty vs Extreme Poverty Rates
Poverty Extreme Poverty
5. ourworldindata.org 2016
These reductions in poverty and inequality came about from the expansion of social spending
policies. The main contributor to this was the Bolsa Familia policy, introduce by the government
in 2003. The policy provided low income families with between 35-135 Reals per month (11$ to
45$) for enrolling their children in education. Envisioned to be held by the woman in the family,
the additional income was available in the form of a debit card that could be used to purchase
food. Amongst the successes attributed to this policy has been increased empowerment of
females, reduced gender wage inequality and reduced overall poverty levels. However the main
benefactor is the economy, as the increased wealth means increased expenditure on goods and
services. (Ali, 2015)
Centre for economic and policy research 2014
Brazil has experienced large increases to the national minimum wage and increases in formal
employment in the economy over the time period. The net outcome has led to the increased
bargaining power of workers, bringing better wages and working conditions to employees. Since
2003 real wages have risen 34%. This growth has been maintained despite the economic
downturn experienced since 2011, thus leading to fears that real wage growth may add much
inflationary pressure and, as a result, lead to higher unemployment with labour cost mounting. As
seen below in this cost of labour chart. (Weisbrot, Johnston, and Lefebvre, 2014)
6. The overall cost of labour hit an all record levels of 181.87 Index Points in July of 2011 from
a record low of 39.60 Index Points in October of 2002.
Unemployment in the Economy
Unemployment and informal employment (non-registered workers as a total of the employed
population) has dropped significantly. Unemployment figures peaked at 13% in 2003, since
then they have shown a steady decline with the exception of the crisis of 2009, to a new
historical low of 5%. The percentage of worker in informal work has also seen a significant
drop over the same time period falling from 22.5% to just 13%.
Over this period there was a net creation of some 13.4 million formal jobs. Despite these
positives a large amount of work is still in the low paid sector, with high rates of turnover and
7. gender inequality, with abnormally high rates of informal employment still being
experienced. (Weisbrot Et al, 2014)
The problem that Brazil now faces is that its labour participation rate has peaked and the
amount of people entering labour market is in decline. The countries birth rate has falling
from 4.1 births in the 1980’s to just 1.8 births. Having reached near full employment, labour
force participation, the driving force behind Brazil GDP growth is tapering off. Brazil must
turn to increased productivity levels if it is to continue in its cycle of growth. (Fox, J 2013)
Productivity
Productivity has emerged as one of Brazil’s biggest challenges over the coming years.
Approximately 74% of all productivity gains over the past decade can be attributed to a rapid
growth in numbers of population of working age and higher levels of labour force
participation. This population growth has been responsible for the GDP gains since the turn
of the millennium. Those gains have now run their course with Brazil’s birth rate, halving
since the 1980’s and Brazil teetering on full employment. Brazil’s work force needs to
become more efficient. Productivity gains now have to be generated by better equipment and
technology, improved transport and infrastructure and a better trained more educated
workforce as opposed to labour numbers. These factors are critical to economic competition
and growth. Currently there is a lack of investment and low levels of professional
qualifications amongst the workforce on the backdrop of increasing real wages. This trend
must be reversed in order to see real productivity gains.
8. The table below shows the increasing gap between wages and productivity, with real wages
increasing and productivity flattening since the economic crash of 2009. The cause being a
2005 law that indexed Brazil's minimum wage to a formula linking previous-year inflation
plus GDP growth from two years previous. This formula caused a 14% hike in the minimum
wage in 2012 alone. As the minimum wage is considered a bench mark for other salaries the
eventual result was a 6.2% increase in the real wage overall (Murphy, 2012)
The effects of a widening gap between real term wages and productivity is leading to an
increase in the costs of production for domestic firms and the reduction of competiveness on
the international arena, consequently risking the sustainability of jobs in the long run.
Macroeconomic Strategy 2000-2015
A Central Bank Inflationary Target
Brazil adopted a monetary strategy of maintaining inflation targets at a rate of 4.5% of which
it may fluctuate up or down by a margin of 200 base points. Since the policy’s adoption it has
only failed to do so in 2011 and early 2013. It controls the rate, primarily by allowing the
exchange rate of its currency to rise, decreasing the cost of imports and exports. It does this
contrary to standard economic models as they are based on demand driven inflation where
Brazilian inflation is not demand driven. (Loman, 2014)
9. In most economies an increase in interest rates causes a slowdown in expenditure and as
spending decreases, employment increases. The downward pressure on the labour markets
lowers wage expectation and therefore lowers prices, leading to lower inflation.
However Brazil has a different model. Interest rate increases lower inflation by increasing net
capital inflows by raising the value of the currency, this in return decreases the cost of
imports and exports. In 2004 favourable market conditions led to the early repayment of an
IMF loan, which subsequently allowed for the government to borrow at lower rates that
filtered through to the domestic borrowing rate.
Interest rates in Brazil have been traditionally high, however, in recent years interest rates
have gradually decreased to relatively affordable levels yet they still remain relatively high.
The hyperinflation experienced in the past has caused policy makers to be prudent with their
predictions on inflationary estimates, thus encouraging interest rates to be set higher. This is
to absorb the risk factor of higher inflation as inflationary shocks benefit the borrower and
punish the lender as high inflation can wipe-out profits over time.
One of the Contributing factors behind high interest rates in Brazil is the low savings ratio. In
a country with substantial investment needs this causes an upward pressure on interest rates
as there is shortages on savings to finance borrowings from within. A further factor are the
rates of subsidised lending. Over 20% of all borrowings are subsidised by the state, including
lending for rural and housing credit, this figure goes up as far as 35%. As state subsidised
funding is borrowed on long term interest rates, not subject to fluctuations in the seasonally
adjusted Rates by SELIC (Special Clearance and Escrow System) the state compensates for
potential losses by transferring the costs to non-subsidised credit in the form of higher
interest. Finally the last variable in causing the high interest rate are the poor laws enforcing
creditor protection and the large levels of government spending. (Reichold, 2011).
On the chart below there is a relationship between interest rates and inflation. Interest’s rates
have been falling as inflation rises. This is due to the borrowing costs of money. Whilst
interest rates are low. It encourages more people to borrow leading to greater flows of cash in
the economy. The more money there is in the economy means the more people are willing to
pay for goods and services which leads to further price increases. On this chart we can also
10. see the relationship between savings and the interest rate. As savings in the economy
gradually increased, interest rates began to fall until 2010-11 where saving began to fall back
to post 2000 levels and we see the subsequent rise in interest rates.
Dirty Exchange Rate
With surrounding countries such as Argentine devaluing their currency, Brazil opted to fix their
exchange rate in between a ceiling and floor of R$2-2.1 per US Dollar. This policy was adopted
when exchange rates between the Real and dollar reached R$1.50, attracting large sums of
foreign investors taking advantage of the favourable economic conditions brought about by a
strong GDP growth and high interest rates.
Fearing that the strength of the currency would damage Brazil’s industrial capability of
competing in exports and import markets the government brought in a range of currency controls.
Poorer economic conditions in 2011-12 with historically low interest rates and a falling GDP, saw
investors turn away from Brazil, alleviating pressure on the currency. Taking advantage of this
lull in investor activity Brazil moved to fix the rate at the R$ 2-2.10 per dollar rate. However it is
considered by many economists that the exchange rate is still 20% higher than it should be. Since
0
5
10
15
20
25
30
2000 1 2 3 4 5 6 7 8 9 10 11 12 13 14 15
Relation between Savings, CPI & Interest Rates
Savings as % GDP Interest rates CPI
11. the introduction of the policy, growth rates have been slow, thus leading to doubts over the merits
of the policy. (Leahy, 2012)
Conclusion
The Brazilian economy has seen a turnaround from the hyperinflation of the 90’s and economic
stagnation of the 80’s to becoming one of the world’s largest economies. It has done so largely by
dragging its population out of poverty and in doing so creating a stronger internal market,
bringing more employment into the formal sector of the economy. Its continued growth in GDP
has been linked more to the increase in labour force participation rates than any real increases in
productivity. Productivity still remains weak as public investment has largely focused on
improving real wages and eliminating poverty, rather than improving infrastructure. High interest
rates do not encourage borrowing, thus hindering any real investment in industry. Though the
Brazilian government subsidises borrowing, the focus is on rural housing development at a cost to
private investment funding, which foots the cost through higher interest rates. Brazil has to curb
its real wage increases until they realign with productivity gains. The challenges ahead for Brazil
is to move back into GDP growth and to continue improving the standard of living for its people,
this depends on its ability to raise its output per worker and invest more in infrastructure as GDP
gains from population increases are at an end.
12. Bibliography
Jaeger, M. (2012) Brazil: Fair economic prospects or why the doomsayers are wrong.
Available at: https://www.dbresearch.com/PROD/DBR_INTERNET_EN-
PROD/PROD0000000000296115/Brazil%3A_Fair_economic_prospects.PDF (Accessed: 17
March 2016).
Weisbrot, M. Johnston, J. and Lefebvre, S. (2014) The Brazilian economy in transition:
Macroeconomic policy, labour and inequality. Available at:
http://cepr.net/publications/reports/the-brazilian-economy-in-transition-macroeconomic-
policy-labor-and-inequality (Accessed: 17 March 2016).
Trading Economics (2016) Brazil labour costs | 1988-2016 | data | chart | calendar | forecast
| news. Available at: http://www.tradingeconomics.com/brazil/labour-costs (Accessed: 17
March 2016).
World Bank and IDA (2016) Brazil overview. Available at:
http://www.worldbank.org/en/country/brazil/overview#1 (Accessed: 17 March 2016).
Ali, R. (2015) Income inequality and poverty: A comparison of Brazil and Honduras.
Available at: http://www.coha.org/income-inequality-and-poverty-a-comparison-of-brazil-
and-honduras/ (Accessed: 17 March 2016).
Loman, H. (2014) Brazil’s macro economy, past and present. Available at:
https://economics.rabobank.com/publications/2014/january/brazils-macro-economy-past-and-
present/#53f414dd-ad77-4a8c-8247-2675644540d6 (Accessed: 17 March 2016).
Filho, F. and Fernando (2011) Brazil’s response: How did financial regulation and monetary
policy influence recovery? Available at:
http://www.scielo.br/scielo.php?script=sci_arttext&pid=S0101-31572011000500019
(Accessed: 17 March 2016).
Media, T. (2010) Historic inflation Brazil – historic CPI inflation Brazil. Available at:
http://www.inflation.eu/inflation-rates/brazil/historic-inflation/cpi-inflation-brazil.aspx
(Accessed: 17 March 2016).
Murphy, T. (2012) Brazil’s productivity curve may have reached peak. Available at:
http://www.marketwatch.com/story/brazils-productivity-curve-may-have-reached-peak-2012-
06-19 (Accessed: 17 March 2016).
Reichold, S. (2011) Analysis: Here is why interest rates in Brazil are so high…. Available at:
http://brazilianbubble.com/analysis-here-is-why-interest-rates-in-brazil-are-so-high/
(Accessed: 18 March 2016).
Leahy, J. (2012) Brazil admits tight hold over exchange rate. Available at:
http://www.ft.com/cms/s/0/3185f656-1dfa-11e2-8e1d-00144feabdc0.html (Accessed: 21
March 2016).
13. Fox, J. (2013) Would you rather have Brazil’s economic problems or America’s? Available
at: https://hbr.org/2013/12/would-you-rather-have-brazils-economic-problems-or-americas/
(Accessed: 21 March 2016).