The 2023 state of the climate report: Entering uncharted territory
•
0 likes•85 views

Science Publication. The 2023 State of Climate Johan Rockstrom et. al

Recommended
Recommended
More Related Content
Similar to The 2023 state of the climate report: Entering uncharted territory
Similar to The 2023 state of the climate report: Entering uncharted territory (20)
More from Energy for One World
More from Energy for One World (20)
Recently uploaded
Recently uploaded (20)
The 2023 state of the climate report: Entering uncharted territory
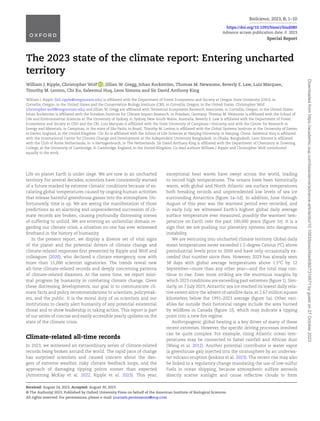
- 1. BioScience, 2023, 0, 1–10 https://doi.org/10.1093/biosci/biad080 Advance access publication date: 0 2023 Special Report The 2023 state of the climate report: Entering uncharted territory William J. Ripple, Christopher Wolf , Jillian W. Gregg, Johan Rockström, Thomas M. Newsome, Beverly E. Law, Luiz Marques, Timothy M. Lenton, Chi Xu, Saleemul Huq, Leon Simons and Sir David Anthony King William J. Ripple (bill.ripple@oregonstate.edu) is affiliated with the Department of Forest Ecosystems and Society at Oregon State University (OSU), in Corvallis, Oregon, in the United States and the Conservation Biology Institute (CBI), in Corvallis, Oregon, in the United States. Christopher Wolf (christopher.wolf@oregonstate.edu) and Jillian W. Gregg are affiliated with Terrestrial Ecosystems Research Associates, in Corvallis, Oregon, in the United States. Johan Rockström is affiliated with the Potsdam Institute for Climate Impact Research, in Potsdam, Germany. Thomas M. Newsome is affiliated with the School of Life and Environmental Sciences at The University of Sydney, in Sydney, New South Wales, Australia. Beverly E. Law is affiliated with the Department of Forest Ecosystems and Society at OSU and the CBI. Luiz Marques is affiliated with the State University of Campinas—Unicamp and with the Center for Research in Energy and Materials, in Campinas, in the state of São Paolo, in Brazil. Timothy M. Lenton is affiliated with the Global Systems Institute at the University of Exeter, in Exeter, England, in the United Kingdom. Chi Xu is affiliated with the School of Life Sciences at Nanjing University, in Nanjing, China. Saleemul Huq is affiliated with the International Centre for Climate Change and Development at the Independent University Bangladesh, in Dhaka, Bangladesh. Leon Simons is affiliated with the Club of Rome Netherlands, in ‘s-Hertogenbosch, in The Netherlands. Sir David Anthony King is affiliated with the Department of Chemistry at Downing College, at the University of Cambridge, in Cambridge, England, in the United Kingdom. Co-lead authors William J. Ripple and Christopher Wolf contributed equally to the work. Life on planet Earth is under siege. We are now in an uncharted territory. For several decades, scientists have consistently warned of a future marked by extreme climatic conditions because of es- calating global temperatures caused by ongoing human activities that release harmful greenhouse gasses into the atmosphere. Un- fortunately, time is up. We are seeing the manifestation of those predictions as an alarming and unprecedented succession of cli- mate records are broken, causing profoundly distressing scenes of suffering to unfold. We are entering an unfamiliar domain re- garding our climate crisis, a situation no one has ever witnessed firsthand in the history of humanity. In the present report, we display a diverse set of vital signs of the planet and the potential drivers of climate change and climate-related responses first presented by Ripple and Wolf and colleagues (2020), who declared a climate emergency, now with more than 15,000 scientist signatories. The trends reveal new all-time climate-related records and deeply concerning patterns of climate-related disasters. At the same time, we report mini- mal progress by humanity in combating climate change. Given these distressing developments, our goal is to communicate cli- mate facts and policy recommendations to scientists, policymak- ers, and the public. It is the moral duty of us scientists and our institutions to clearly alert humanity of any potential existential threat and to show leadership in taking action. This report is part of our series of concise and easily accessible yearly updates on the state of the climate crisis. Climate-related all-time records In 2023, we witnessed an extraordinary series of climate-related records being broken around the world. The rapid pace of change has surprised scientists and caused concern about the dan- gers of extreme weather, risky climate feedback loops, and the approach of damaging tipping points sooner than expected (Armstrong McKay et al. 2022, Ripple et al. 2023). This year, exceptional heat waves have swept across the world, leading to record high temperatures. The oceans have been historically warm, with global and North Atlantic sea surface temperatures both breaking records and unprecedented low levels of sea ice surrounding Antarctica (figure 1a–1d). In addition, June through August of this year was the warmest period ever recorded, and in early July, we witnessed Earth’s highest global daily average surface temperature ever measured, possibly the warmest tem- perature on Earth over the past 100,000 years (figure 1e). It is a sign that we are pushing our planetary systems into dangerous instability. We are venturing into uncharted climate territory. Global daily mean temperatures never exceeded 1.5-degree Celsius (°C) above preindustrial levels prior to 2000 and have only occasionally ex- ceeded that number since then. However, 2023 has already seen 38 days with global average temperatures above 1.5°C by 12 September—more than any other year—and the total may con- tinue to rise. Even more striking are the enormous margins by which 2023 conditions are exceeding past extremes (figure 1). Sim- ilarly, on 7 July 2023, Antarctic sea ice reached its lowest daily rela- tive extent since the advent of satellite data, at 2.67 million square kilometers below the 1991–2023 average (figure 1a). Other vari- ables far outside their historical ranges include the area burned by wildfires in Canada (figure 1f), which may indicate a tipping point into a new fire regime. Anthropogenic global heating is a key driver of many of these recent extremes. However, the specific driving processes involved can be quite complex. For example, rising Atlantic ocean tem- peratures may be connected to Sahel rainfall and African dust (Wang et al. 2012). Another potential contributor is water vapor (a greenhouse gas) injected into the stratosphere by an underwa- ter volcano eruption (Jenkins et al. 2023). The recent rise may also be linked to a regulatory change mandating the use of low-sulfur fuels in ocean shipping, because atmospheric sulfate aerosols directly scatter sunlight and cause reflective clouds to form Received: August 24, 2023. Accepted: August 30, 2023 © The Author(s) 2023. Published by Oxford University Press on behalf of the American Institute of Biological Sciences. All rights reserved. For permissions, please e-mail: journals.permissions@oup.com Downloaded from https://academic.oup.com/bioscience/advance-article/doi/10.1093/biosci/biad080/7319571 by guest on 27 October 2023
- 2. 2 | BioScience, 2023, Vol. 0, No. 0 Figure 1. Unusual climate anomalies in 2023 (the red line, which appears bold in print). Sea ice extent (a, b), temperatures (c–e), and area burned in Canada (f) are presently far outside their historical ranges. These anomalies may be due to both climate change and other factors. Sources and additional details about each variable are provided in supplemental file S1. Each line corresponds to a different year, with darker gray representing later years. (see supplemental file S1 for an extended discussion). The sud- den rise in temperatures is also likely contributed to by the on- set of an El Niño event—a naturally occurring part of the climate system, which could, itself, be affected by climate change (Cai et al. 2021). In any case, as Earth’s climate system tran- sitions away from conditions associated with human thriving, such anomalies may become more frequent and could have in- creasingly catastrophic impacts (Xu et al. 2020, Lenton et al. 2023). Recent trends in planetary vital signs On the basis of time series data, 20 of the 35 vital signs are now showing record extremes (figures 2 and 3, supplemental table S1). As we describe below, these data show how the continued pursuit of business as usual has, ironically, led to unprecedented pressure on the Earth system, resulting in many climate-related variables entering uncharted territory (figures 1 and 3). Energy It appears the green recovery following COVID-19 that many had hoped for has largely failed to materialize (Zhang et al. 2023). In- stead, carbon emissions have continued soaring, and fossil fuels remain dominant, with annual coal consumption reaching a near all-time high of 161.5 exajoules in 2022 (figure 2h). Although the consumption of renewable energy (solar and wind) grew a robust 17% between 2021 and 2022, it remains roughly 15 times lower than fossil fuel energy consumption (figure 2h). A major driver of economic and energy trends is Russia’s ongoing invasion of Ukraine, which has accelerated the transition to renewables in Europe but which may also cause some countries to switch from Russian-supplied gas to coal (Tollefson 2022). Already, this conflict has contributed to a massive 107% increase in fossil fuel subsidies from US$531 billion in 2021 to US$1097 billion in 2022 because of rising energy prices (figure 2o). Although these subsidies may par- tially protect consumers from price increases, they are often not well targeted and help to promote fossil fuel related energy use and profits over low-carbon alternatives (Muta and Erdogan 2023). Downloaded from https://academic.oup.com/bioscience/advance-article/doi/10.1093/biosci/biad080/7319571 by guest on 27 October 2023
- 3. | 3 Coal Oil Gas Solar/wind GHG emissions covered by carbon pricing (%) Carbon price ($ per tonne CO2 emissions) Fossil fuel subsidies (billion USD/yr) Governments that have declared a climate emergency (#) Air transport (billion passengers carried/yr) Total institutional assets divested (trillion USD) CO2 e emissions (gigatonnes CO2 equivalent/yr) Per capita CO2 e emissions (tonnes CO2 equivalent/yr) World GDP (trillion current US $/yr) Global tree cover loss (million hectares/yr) Energy consumption (Exajoules/yr) Human population (billion individuals) Total fertility rate (births per woman) Ruminant livestock (billion individuals) Per capita meat production (kg/yr) 1980 1990 2000 2010 2020 1980 1990 2000 2010 2020 1980 1990 2000 2010 2020 1980 1990 2000 2010 2020 30 35 40 45 0 50 100 150 200 4.25 4.50 4.75 5.00 0 500 1000 1500 2000 2500 2.8 3.2 3.6 4.0 25 30 35 40 300 600 900 2.5 3.0 3.5 15 20 25 30 0 10 20 30 40 0 10 20 30 5 6 7 8 20 40 60 80 1 2 3 4 0 5 10 15 20 25 Year m. n. o. p. i. j. k. l. e. f. h. a. b. c. d. Brazilian Amazon forest loss (million hectares/yr) 1 2 3 g. Figure 2. Time series of climate-related human activities. Data obtained since the publication of Ripple and colleagues (2021) are shown in red (dark gray in print). In panel (f), tree cover loss does not account for forest gain and includes a loss due to any cause. For panel (h), hydroelectricity and nuclear energy are shown in figure S1. Sources and additional details about each variable are provided in supplemental file S1. Forests Between 2021 and 2022, the global tree cover loss rate declined 9.7% to 22.8 million hectares (ha) per year (figure 2f). Similarly, the Brazilian Amazon forest loss rate decreased by 11.3% to 1.16 million ha per year (figure 2g), and further reductions are likely to occur as a result of the election of a new president of Brazil and several recent legal decrees (Vilani et al. 2023). However, humanity is not on track to end and reverse deforestation by 2030, despite pledges by more than 100 world leaders in 2021 at COP26 (UNEP 2022a). Moreover, forests are increasingly threatened by powerful climate feedback loops involving processes such as insect dam- age, dieback, and wildfire (Flores and Staal 2022, Ripple et al. 2023). For example, the historical record-setting wildfires in Canada, which burned 16.6 million hectares this year as of 13 September (figure 1f), were partly related to climate change. This resulted in emissions of more than a gigaton of carbon dioxide (Copernicus 2023), which is substantial, given that Canada’s total greenhouse gas emissions in 2021 were roughly 0.67 gigatons of carbon dioxide equivalent (Environment and Climate Change Canada 2023). How quickly such emissions can be reabsorbed by postfire recovery is uncertain, and there is a real risk that increasing fire severity will cause unrecoverable carbon loss in a warming future (Bowman et al. 2021). Global mean greenhouse gases and temperature On the basis of year-to-date statistics for 2023, three important greenhouse gases—carbon dioxide, methane, and nitrous oxide— are all at record levels (figure 3a–3c). The global average carbon Downloaded from https://academic.oup.com/bioscience/advance-article/doi/10.1093/biosci/biad080/7319571 by guest on 27 October 2023
- 4. 4 | BioScience, 2023, Vol. 0, No. 0 Area burned in the United States (million hectares/yr) Global tree cover loss due to fires (million hectares/yr) Billion−dollar floods in the United States (events/year) Extremely hot days relative to 1961−1990 (% of days/year) Minimum Arctic sea ice (million km2 ) Greenland ice mass change (gigatonnes) Antarctica ice mass change (gigatonnes) Glacier thickness change (m of water equivalent) Earth's energy imbalance (W/m2 ; 12−mo. running mean) Ocean heat content change (1022 joules) Ocean acidity (pH) Sea level change relative to 20−year mean (mm) Carbon dioxide (CO2 parts per million) Methane (CH4 parts per billion) Nitrous oxide (N2 O parts per billion) Surface temperature anomaly (change) (°C) 1980 1990 2000 2010 2020 1980 1990 2000 2010 2020 1980 1990 2000 2010 2020 1980 1990 2000 2010 2020 0.0 0.5 1.0 −25 0 25 50 −20 −10 0 5 10 15 20 300 310 320 330 8.06 8.08 8.10 8.12 −3000 −2000 −1000 0 0 1 2 3 4 1700 1800 1900 10 15 20 25 −4000 −2000 0 0.0 2.5 5.0 7.5 10.0 350 375 400 0.0 0.5 1.0 1.5 2.0 4 5 6 7 0 1 2 3 4 Year m. n. o. p. i. j. k. l. e. f. g. h. a. b. c. d. Figure 3. Time series of climate-related responses. Data obtained before and after the publication of Ripple and colleagues (2021) are shown in gray and red (dark gray in print) respectively. For area burned (m) and billion-dollar flood frequency (o) in the United States, the black horizontal lines show changepoint model estimates, which allow for abrupt shifts (see the supplement). For other variables with relatively high variability, local regression trendlines are shown in black. The variables were measured at various frequencies (e.g., annual, monthly, weekly). The labels on the x-axis correspond to the midpoints of years. Billion-dollar flood frequency (o) is likely influenced by exposure and vulnerability in addition to climate change. Sources and additional details about each variable are provided in supplemental file S1. dioxide concentration is now approximately 420 parts per million, which is far above the proposed planetary boundary of 350 parts per million (Rockström et al. 2009). In addition, 2023 is on track to be one of the hottest years on record (figures 1e and 3d). Although fossil fuel-related greenhouse gas emissions are the main driver of rising temperatures, a global decline in sulfur dioxide emissions is likely a contributing factor (supplemental figure S2). Sulfur diox- ide forms sulfates in the atmosphere, which are the strongest anthropogenic cooling agent, hiding part of the greenhouse gas warming (see supplemental file S1 for extended discussion). Oceans and ice Ocean acidity, glacier thickness, and Greenland ice mass all fell to record lows (figure 3g, 3j, and 3l), whereas sea level rise and ocean heat content rose to record highs (figure 3f, 3h). The increase in heat content and the rapid rise in sea surface temperatures (figure 1c, 1d) are especially troubling, because they could have many serious impacts, including the loss of sea life, coral reefs dying because of bleaching, and a rise in the intensity of large tropical storms (Reid et al. 2009). There are also growing concerns Downloaded from https://academic.oup.com/bioscience/advance-article/doi/10.1093/biosci/biad080/7319571 by guest on 27 October 2023
- 5. | 5 Figure 4. Photograph series depicting the impacts of climate-related disasters. First row (left to right): Homeowners sort through debris after wildfires destroyed their home in the state of California (United States, 2008; FEMA/Michael Mancino), “[National] guardsman carrying a woman in waist deep floodwaters” (United States, 2017; Zachary West/National Guard; CC BY 2.0). Second row: “young girls are caught by a sandstorm on their way to school” (Afghanistan, 2019, Solmaz Daryani/Climate Visuals Countdown; Creative Commons), “mature woman seated in her home, submerged in deep water, smoking a cigarette” (Brazil, 2015; Fabrice Fabola, CC BY-SA 2.0). Third row: aftermath of Cyclone Idai (Mozambique, 2019; Denis Onyodi: IFRC/DRK/Climate Centre, CC BY-NC 2.0), “residents walk on a road littered with debris after Super Typhoon Haiyan battered Tacloban city” (The Philippines, 2013; Erik de Castro/Reuters; CC BY 2.0). All quotes are from the Climate Visuals project (https://climatevisuals.org). See supplemental file S1 for details and more pictures. that the Atlantic meridional overturning circulation could pass a tipping point and start to collapse this century, possibly between 2025 and 2095 (Ditlevsen and Ditlevsen 2023), which would significantly alter global precipitation and temperature patterns with potentially major harmful consequences for ecosystems and society, including reduced natural carbon sinks (Armstrong McKay et al. 2022). Climate impacts and extreme weather Climate change is contributing significantly to human suffer- ing (figure 4). Climate-related impacts in 2022 included another billion-dollar flood in the United States, which occurred in Ken- tucky and Missouri between 26 and 28 July, and the third high- est frequency of extremely hot days (figure 3o, 3p). Between 2021 and 2022, the area burned by wildfires globally decreased 28% Downloaded from https://academic.oup.com/bioscience/advance-article/doi/10.1093/biosci/biad080/7319571 by guest on 27 October 2023
- 6. 6 | BioScience, 2023, Vol. 0, No. 0 Table 1. Recent climate-related disasters since November 2022. Timeframe Climate disaster November–December 2022 Record-breaking heat waves in Argentina and Paraguay contributed to power outages, wildfires, and poor harvests. This extreme heat was estimated to have been made 60 times more likely because of climate change. December 2022–March 2023 Heavy rainfall caused by atmospheric rivers led to multiple floods in the Western United States. There were at least 22 fatalities and property damages were estimated to be US$3.5 billion. Climate change may be increasing the likelihood of such catastrophic floods, although its effect on these particular storms is less clear. February 2023 Cyclone Gabrielle caused extreme rainfall in Aotearoa New Zealand’s Te Ika-a-Māui (North Island), potentially resulting in billions of dollars in damages and 225,000 homes losing power. This intense rainfall may be partly caused by a warming climate. March–May 2023 Record-breaking temperatures were recorded in parts of Southeast Asia, China, and South Asia. The extreme heat caused deaths and school closures in India and led to more than 100 students requiring treatment for dehydration in the Philippines. It was likely at least partly because of climate change. For example, climate change has increased the likelihood of such an event to occur over Bangladesh and India by a factor of at least 30. January–July 2023 Intense wildfires in Canada burned roughly 10 million hectares, displacing 30,000 people at their peak, and worsening air quality across large portions of Canada and the United States. These extreme wildfires may be partly because of climate change, although many other factors are likely involved. May 2023 Tropical cyclone Mocha is reported to have killed at least 145 people in Myanmar and affected roughly 800,000 people in the region. Climate change may have made such storms more intense. May–June 2023 Tropical storm Mawar caused flooding and loss of power in parts of Guam. Mawar is the strongest cyclone ever recorded in the northern hemisphere in May. Climate change may be causing an increase in the intensity of tropical cyclones (Wu et al. 2022). June 2023 Deadly heat led to more than a dozen deaths in the Southern and Midwestern United States. Climate change is leading to an increase in the frequency and duration of such heat waves. July 2023 Up to six people died in Southwest Japan because of extremely heavy rainfall that caused floods and landslides. Climate change is likely making such heavy rainfall events more severe. Days later, floods and landslides, which may have been partly related to climate change, killed more than 26 people and led to thousands being evacuated in South Korea July 2023 Heavy monsoon rain caused flash floods and landslides in northern India that killed more than 100 people. Climate change is likely making monsoons in this region more variable, causing frequent landslides and floods. Heavy monsoon rains also damaged rice crops in India, raising concerns about global food prices and food security and prompting an export ban on nonbasmati varieties. June–August 2023 Extreme heat in the United States killed at least 147 people. In the absence of climate change, the extreme heat seen in July 2023 in the United States would have been extremely unlikely to occur. July–August 2023 Beijing, China experienced its heaviest rainfall in at least 140 years, resulting in major flooding that affected nearly 1.29 million people, damaged 147,000 homes, and caused at least 33 deaths. Intense flooding is likely becoming more common because of climate change. August 2023 In Hawaii, United States, catastrophic wildfires on the island of Maui killed at least 111 people, with more than 1,000 people likely missing, as of 18 August 2023. Climate change may have decreased rainfall and increased temperatures in this region, potentially contributing to these fires. September 2023 Storm Daniel caused extreme flooding in Libya and parts of southeastern Europe, resulting in thousands of fatalities and more than 2 billion US dollars in damages. Climate change may be increasing the intensity of such storms. Note: We list numerous recent disasters that may be at least partly related to climate change. This list is not intended to be exhaustive. Because of the recent nature of these events, our sources often include news media articles. For each event, we generally provide references indicating that the likelihood or strength of such an event may have increased because of anthropogenic climate change. References to scientific articles are given directly in the table, and links to news articles are provided in supplemental file S1. Some of these disasters may be at least partly because of climate-related changes in jet streams (Stendel et al. 2021, Rousi et al. 2022). (from 9.34 million ha to 6.72 million ha), but wildfire activity in the United State rose by 6.3% (from 2.88 million ha to 3.07 million ha) over the same period (figure 3m, 3n). Many climate impacts are expected to further intensify in the coming years, and we may have already experienced abrupt increases in certain types of ex- treme weather, possibly surpassing the rate of temperature rise (figures 3m, 3o, S3, S4; Calvin 2020). In 2023, climate change likely contributed to a number of ma- jor extreme weather events and disasters. Several of these events demonstrate how climate extremes are threatening wider areas that have not typically been prone to such extremes; for example, severe flooding in northern China, around Beijing, killed at least 33 people. Other recent disasters include deadly flash floods and landslides in northern India, record-breaking heat waves in the United States, and an exceptionally intense Mediterranean storm that killed thousands of people, primarily in Libya (see table 1 for details and attribution). As these impacts continue to accel- erate, more funding to compensate for climate-related loss and damage in developing countries is urgently needed. The United Nations’ new loss and damage global fund established at COP27 is a promising development, but its success will require robust support by wealthy countries. Scientists’ warning recommendations Motivated by recent events and trends, we continue to issue specific warnings and recommendations involving topics ranging from food security to climate justice. Coordinated efforts in each of these areas could help to support a broader agenda focused on holistic and equitable climate policy. Downloaded from https://academic.oup.com/bioscience/advance-article/doi/10.1093/biosci/biad080/7319571 by guest on 27 October 2023
- 7. | 7 Figure 5. Climate action special topics. Many models assume that GDP growth can be mostly decoupled from emissions and other consumption-related environmental impacts (a) and that carbon capture methods can be quickly scaled up (b). If these assumptions are not realistic and the use of coal and other fossil fuels is not immediately curtailed (c), then Earth system feedback loops (d) could lead to rapidly accelerating climate impacts, including undernourishment (e) and climate disasters, which will be especially severe in less wealthy countries that have had little historical emissions (f). See supplemental file S1 for data sources and details. Photograph: Boris Radosavljevic (CC BY 2.0). Economics Economic growth, as it is conventionally pursued, is unlikely to allow us to achieve our social, climate, and biodiversity goals. The fundamental challenge lies in the difficulty of decoupling eco- nomic growth from harmful environmental impacts (figure 5a). Although technological advancements and efficiency improve- ments can contribute to some degree of decoupling, they often fall short in mitigating the overall ecological footprint of economic activities (Hickel et al. 2021). The impacts vary greatly by wealth; in 2019, the top 10% of emitters were responsible for 48% of global emissions, whereas the bottom 50% were responsi- ble for just 12% (Chancel 2022). We therefore need to change our economy to a system that supports meeting basic needs for all people instead of excessive consumption by the wealthy (O’Neill et al. 2018). Stopping warming The elevated rates of climate disasters and other impacts that we are presently seeing are largely a consequence of historical and ongoing greenhouse gas emissions. To mitigate these past emis- sions and stop global warming, efforts must be directed toward eliminating emissions from fossil fuels and land-use change and increasing carbon sequestration with nature-based climate solu- tions. However, it is crucial to explore other possible strategies to efficiently remove additional carbon dioxide, which can con- tribute to long-term planetary cooling. Negative emissions tech- nologies are in an early stage of development, posing uncertain- ties regarding their effectiveness, scalability, and environmental and societal impacts (figure 5b; Anderson and Peters 2016). As such, we should not rely on unproven carbon removal techniques. Although research efforts should be accelerated, depending Downloaded from https://academic.oup.com/bioscience/advance-article/doi/10.1093/biosci/biad080/7319571 by guest on 27 October 2023
- 8. 8 | BioScience, 2023, Vol. 0, No. 0 heavily on future large-scale carbon removal strategies at this juncture may create a deceptive perception of security and post- pone the imperative mitigation actions that are essential to tackle climate change now. Stopping coal consumption In addition to its destructive effects on ecosystems and global health, coal accounts for more than 80% of carbon dioxide added to the atmosphere since 1870 and roughly 40% of current carbon dioxide emissions (Burke and Fishel 2020). As of 2022, global coal consumption is near record levels (figure 2h). In 2021, coal-related carbon dioxide emissions were greatest in China (53.1%), followed by India (12.0%), and the United States (6.7%; figure 5c). Coal us- age in China has accelerated rapidly in the past decades, and the country now still produces nearly a third of all fossil fuel carbon dioxide and methane emissions (supplemental table S2; Normile 2020). In response to this situation, we support the Powering Past Coal Alliance and recommend the adoption of the international Coal Elimination Treaty to phase out coal and, more broadly, the Fossil Fuel Non-Proliferation Treaty (van Asselt and Newell 2022). These treaties could provide support for less wealthy countries in transitioning away from coal and other fossil fuels, including funding to build out renewable energy capacity and retrain and transition workers from the fossil fuel industry. Feedback loops Climate feedback loops directly affect the relationship between emissions and warming. For example, warming causes permafrost soils to thaw, emitting methane and carbon dioxide that result in further warming (figure 5d). As such, reinforcing feedback loops amplify the effects of greenhouse gas emissions, leading to ad- ditional warming. Therefore, understanding feedback loops and their interactions can inform climate mitigation and adaptation strategies. Despite their importance, the combination of multiple amplifying feedback loops are not well understood, and the po- tential strengths of some dangerous feedback loops are still highly uncertain (Ripple et al. 2023). Because of this uncertainty, we call for an Intergovernmental Panel on Climate Change (IPCC) special report that focuses on the perilous climate feedback loops, tipping points, and—just as a precaution—the possible but less likely sce- nario of runaway or apocalyptic climate change. Food security and undernourishment After declining for many years, the prevalence of undernourish- ment is now on the rise (figure 5e). In 2022, an estimated 735 million people faced chronic hunger—an increase of roughly 122 million since 2019 (FAO et al. 2023). This rise, which has pushed humanity far off track from achieving zero hunger by 2030, is due to multiple factors, including climate extremes, economic downturns, and armed conflict (FAO et al. 2023). Climate change has reduced the extent of global agricultural productivity growth (Ortiz-Bobea et al. 2021), so there is danger that hunger will es- calate in the absence of immediate climate action. In particular, there may be serious and underestimated future risks of syn- chronized harvest failures caused by increased waviness of the jet stream (Kornhuber et al. 2023). Because of the growing risks of concurrent major crop losses in multiple regions of the world, adaptation-focused efforts are needed to improve crop resilience and resistance to heat, drought, and other climate stressors (Raza et al. 2019). A shift toward plant-based diets, particularly in wealthy countries, could improve global food security and help mitigate climate change (Figure 2d; Cassidy et al. 2013). Justice The impacts of climate change are already catastrophic for many. However, these impacts are not unfolding uniformly across the entire globe. Instead, they disproportionately affect the world’s most impoverished individuals, who, ironically, have had the least role in causing this issue (figure 5f; Harlan et al. 2015). To achieve socioeconomic justice and universal human well-being, it is cru- cial to strive for a convergence in per capita resource and energy consumption worldwide. This entails working toward balanced and equitable levels of energy and resource consumption for both the global north and south (Hickel et al. 2021). Conclusions The effects of global warming are progressively more severe, and possibilities such as a worldwide societal breakdown are feasi- ble and dangerously underexplored (Kemp et al. 2022). By the end of this century, an estimated 3 to 6 billion individuals— approximately one-third to one-half of the global population— might find themselves confined beyond the livable region, en- countering severe heat, limited food availability, and elevated mortality rates because of the effects of climate change (Lenton et al. 2023). Big problems need big solutions. Therefore, we must shift our perspective on the climate emergency from being just an isolated environmental issue to a systemic, existential threat. Although global heating is devastating, it represents only one as- pect of the escalating and interconnected environmental crisis that we are facing (e.g., biodiversity loss, fresh water scarcity, pan- demics). We need policies that target the underlying issues of eco- logical overshoot where the human demand on Earth’s resources results in overexploitation of our planet and biodiversity decline (figures 5a, S5; McBain et al. 2017). As long as humanity continues to exert extreme pressure on the Earth, any attempted climate- only solutions will only redistribute this pressure. To address the overexploitation of our planet, we challenge the prevailing notion of endless growth and overconsumption by rich countries and individuals as unsustainable and unjust (Rockström et al. 2023). Instead, we advocate for reducing resource overconsumption; reducing, reusing, and recycling waste in a more circular economy; and prioritizing human flourishing and sustainability. We emphasize climate justice and fair distribution of the costs and benefits of climate action, particularly for vulner- able communities (Gupta et al. 2023). We call for a transformation of the global economy to prioritize human well-being and to pro- vide for a more equitable distribution of resources (Hickel et al. 2021). We also call to stabilize and gradually decrease the human population with gender justice through voluntary family planning and by supporting women’s and girls’ education and rights, which reduces fertility rates and raises the standard of living (Bongaarts and O’Neill 2018). These environmentally conscious and socially equitable strategies necessitate far-reaching and holistic transfor- mations in the long run that could be achieved through gradual but significant steps in the short term (i.e., radical incremental- ism; Halpern and Mason 2015). As scientists, we are increasingly being asked to tell the public the truth about the crises we face in simple and direct terms. The truth is that we are shocked by the ferocity of the extreme weather events in 2023. We are afraid of the uncharted territory that we have now entered. Conditions are going to get very distressing and potentially unmanageable for large regions of the world, with the 2.6°C warming expected over the course of the century, even if the self-proposed national emissions reduction commitments of Downloaded from https://academic.oup.com/bioscience/advance-article/doi/10.1093/biosci/biad080/7319571 by guest on 27 October 2023
- 9. | 9 the Paris Agreement are met (UNEP 2022b). We warn of potential collapse of natural and socioeconomic systems in such a world where we will face unbearable heat, frequent extreme weather events, food and fresh water shortages, rising seas, more emerg- ing diseases, and increased social unrest and geopolitical conflict. Massive suffering due to climate change is already here, and we have now exceeded many safe and just Earth system boundaries, imperiling stability and life-support systems (Rockström et al. 2023). As we will soon bear witness to failing to meet the Paris agreement’s aspirational 1.5°C goal, the significance of immedi- ately curbing fossil fuel use and preventing every further 0.1°C in- crease in future global heating cannot be overstated. Rather than focusing only on carbon reduction and climate change, address- ing the underlying issue of ecological overshoot will give us our best shot at surviving these challenges in the long run. This is our moment to make a profound difference for all life on Earth, and we must embrace it with unwavering courage and determination to create a legacy of change that will stand the test of time. Supplemental Material Supplemental data are available at BIOSCI online. The methods and details of planetary vital sign variables used in this report, along with other discussion appear in supplemental file S1. A list of the scientist signatories for Ripple and colleagues (2020) as of 29 March 2023 appears in supplemental file S2. These signatures are not for the current report. The article “World scientists’ warning of a climate emergency” (Ripple et al. 2020) now has more than 15,000 signatories from 163 countries, and we continue to collect signatures from scien- tists. To sign or learn more, visit the Alliance of World Scientists website at https://scientistswarning.forestry.oregonstate.edu. To read about science-based advocacy and view A Scientist’s Warning, a new documentary film on scientists speaking out, visit www. scientistswarningfilm.org. Acknowledgments We thank William H. Calvin, Katherine Graubard, Karen Wolfgang, and Holly Jean Buck for providing helpful suggestions. We thank Susan Christie for assistance with this project. Partial funding was received from the CO2 Foundation and Roger Worthington. References cited Anderson K, Peters G. 2016. The trouble with negative emissions. Science 354: 182–183. Armstrong McKay DI, Staal A, Abrams JF, Winkelmann R, Sakschewski B, Loriani S, Fetzer I, Cornell SE, Rockström J, Lenton TM. 2022. Exceeding 1.5°C global warming could trigger multiple climate tipping points. Science 377: eabn7950. Bongaarts J, O’Neill BC. 2018. Global warming policy: Is population left out in the cold? Science 361: 650–652. Bowman DM, Williamson GJ, Price OF, Ndalila MN, Bradstock RA. 2021. Australian forests, megafires and the risk of dwindling car- bon stocks. Plant, Cell, and Environment 44: 347–355. Burke A, Fishel S. 2020. A coal elimination treaty 2030: Fast track- ing climate change mitigation, global health, and security. Earth System Governance 3: 100046. Cai W et al. 2021. Changing El Niño–Southern Oscillation in a warm- ing climate. Nature Reviews Earth and Environment 2: 628–644. Calvin WH. 2020. Extreme Weather: And What to Do about It. CO2 Foundation. Cassidy ES, West PC, Gerber JS, Foley JA. 2013. Redefining agricultural yields: From tonnes to people nourished per hectare. Environmen- tal Research Letters 8: 034015. Chancel L. 2022. Global carbon inequality over 1990–2019. Nature Sus- tainability 5: 931–938. Copernicus. 2023. A record-breaking boreal wildfire season. Coper- nicus. https://atmosphere.copernicus.eu/record-breaking- boreal-wildfire-season. Ditlevsen P, Ditlevsen S. 2023. Warning of a forthcoming collapse of the Atlantic meridional overturning circulation. Nature Communi- cations 14: 4254. Environment and Climate Change Canada. 2023. Canadian environmental sustainability indicators: Greenhouse gas emissions. Environment and Climate Change Canada. www.canada.ca/en/environment-climate-change/services/ environmental-indicators/greenhouse-gas-emissions.html. [FAO, IFAD, UNICEF, WFP, WHO] Food and Agriculture Organization of the United Nations, the International Fund for Agricultural De- velopment, the United Nations Children’s Fund, the World Food Program, the World Health Organization. 2023. The State of Food Se- curity and Nutrition in the World 2023: Urbanization, Agrifood Systems Transformation and Healthy Diets across the Rural–Urban Continuum. FAO. Flores BM, Staal A. 2022. Feedback in tropical forests of the Anthro- pocene. Global Change Biology 28: 5041–5061. Gupta J, et al. 2023. Earth system justice needed to identify and live within Earth system boundaries. Nature Sustainability 6: 630–638. Halpern D, Mason D. 2015. Radical incrementalism. Evaluation 21: 143–149. Harlan SL, Pellow DN, Roberts JT, Bell SE, Holt WG, Nagel J. 2015. Climate justice and inequality. Pages 127–163 in Dunlap RE Brulle RJ, eds. Climate Change and Society: Sociological Perspectives. Oxford University Press. Hickel J, Brockway P, Kallis G, Keyßer L, Lenzen M, Slameršak A, Steinberger J, Ürge-Vorsatz D. 2021. Urgent need for post-growth climate mitigation scenarios. Nature Energy 6: 766–768. Jenkins S, Smith C, Allen M, Grainger R. 2023. Tonga eruption increases chance of temporary surface temperature anomaly above 1.5°C. Nature Climate Change 13: 127–129. Kemp L, et al. 2022. Climate endgame: Exploring catastrophic climate change scenarios. Proceedings of the National Academy of Sciences 119: e2108146119. Kornhuber K, Lesk C, Schleussner CF, Jägermeyr J, Pfleiderer P, Hor- ton RM. 2023. Risks of synchronized low yields are underesti- mated in climate and crop model projections. Nature Communi- cations 14: 3528. Lenton TM, et al. 2023. Quantifying the human cost of global warm- ing. Nature Sustainability 2023: s41893-023-01132-6. McBain B, Lenzen M, Wackernagel M, Albrecht G. 2017. How long can global ecological overshoot last? Global and Planetary Change 155: 13–19. Muta T, Erdogan M. 2023. The Global Energy Crisis Pushed Fossil Fuel Consumption Subsidies to an All-Time High in 2022. International Energy Agency. www.iea.org/commentaries/ the-global-energy-crisis-pushed-fossil-fuel-consumption- subsidies-to-an-all-time-high-in-2022. Normile D. 2020. China’s bold climate pledge earns praise—but is it feasible? Science 370: 17–18. O’Neill DW, Fanning AL, Lamb WF, Steinberger JK. 2018. A good life for all within planetary boundaries. Nature Sustainability 1: 88–95. Ortiz-Bobea A, Ault TR, Carrillo CM, Chambers RG, Lobell DB. 2021. Anthropogenic climate change has slowed global agricultural productivity growth. Nature Climate Change 11: 306–312. Downloaded from https://academic.oup.com/bioscience/advance-article/doi/10.1093/biosci/biad080/7319571 by guest on 27 October 2023
- 10. 10 | BioScience, 2023, Vol. 0, No. 0 Raza A, Razzaq A, Mehmood SS, Zou X, Zhang X, Lv Y, Xu J. 2019. Impact of climate change on crops adaptation and strategies to tackle its outcome: A review. Plants 8: 34. Reid PC, et al. 2009. Impacts of the oceans on climate change. Pages 1–150 in Sims DW, ed. Advances in Marine Biology, vol. 56. Elsevier. Ripple WJ, Wolf C, Newsome TM, Barnard P, Moomaw WR. 2020. World scientists’ warning of a climate emergency. BioScience 70: 8–12. Ripple WJ, et al. 2021. World scientists’ Warning of a climate emer- gency 2021. BioScience 71: 894–898. Ripple WJ, Wolf C, Lenton TM, Gregg JW, Natali SM, Duffy PB, Rock- ström J, Schellnhuber HJ. 2023. Many risky feedback loops amplify the need for climate action. One Earth 6: 86–91. Rockström J, et al. 2009. Planetary boundaries: Exploring The safe operating space for humanity. Ecology and Society 14: 26268316. Rockström J, et al. 2023. Safe and just Earth system boundaries. Na- ture 619: 102–111. Rousi E, Kornhuber K, Beobide-Arsuaga G, Luo F, Coumou D. 2022. Accelerated western European heatwave trends linked to more- persistent double jets over Eurasia. Nature Communications 13: 1–11. Stendel M, Francis J, White R, Williams PD, Woollings T. 2021. The jet stream and climate change. Pages 327–357 in Letcher TM, ed. Climate Change: Observed Impacts on Planet Earth, 3rd ed. Elsevier. Tollefson J. 2022. What the war in Ukraine means for energy, climate and food. Nature 604: 232–233. [UNEP] United Nations Environment Programme. 2022a. Making Good on the Glasgow Climate Pact: A Call to Action to Achieve One Gigaton of Emissions Reductions from Forests by 2025. UNEP. [UNEP] United Nations Environment Programme. 2022b. Emissions Gap Report 2022: The Closing Window: Climate Crisis Calls for Rapid Transformation of Societies. UNEP. van Asselt H, Newell P. 2022. Pathways to an international agreement to leave fossil fuels in the ground. Global Environmental Politics 22: 28–47. Vilani RM, Ferrante L, Fearnside PM. 2023. The first acts of Brazil’s new president: Lula’s new Amazon institutionality. Environmental Conservation 50: 148–151. Wang C, Dong S, Evan AT, Foltz GR, Lee S-K. 2012. Multidecadal covariability of North Atlantic sea surface temperature, African dust, Sahel rainfall, and Atlantic hurricanes. Journal of Climate 25: 5404–5415. Wu L, Zhao H, Wang C, Cao J, Liang J. 2022. Understanding of the effect of climate change on tropical cyclone intensity: A Review. Advances in Atmospheric Sciences 39: 205–221. Xu C, Kohler TA, Lenton TM, Svenning J-C, Scheffer M. 2020. Future of the human climate niche. Proceedings of the National Academy of Sciences 117: 11350–11355. Zhang F, Lu J, Chen L. 2023. When green recovery fails to consider coal pushback: Exploring global coal rebounds, production, and policy retrenchment post COVID-19. Energy Research and Social Sci- ence 101: 103142. Received: August 24, 2023. Accepted: August 30, 2023 © The Author(s) 2023. Published by Oxford University Press on behalf of the American Institute of Biological Sciences. All rights reserved. For permissions, please e-mail: journals.permissions@oup.com Downloaded from https://academic.oup.com/bioscience/advance-article/doi/10.1093/biosci/biad080/7319571 by guest on 27 October 2023