SlideShare a Scribd company logo
1 of 34
Abstract
This paper explores the team-based decisions throughout the
Pharmasim marketing simulator program. The simulator was
segmented into eight periods each consisting of one year at a
pharmaceutical company for an over-the-counter cold medicine
(OCM). As the team progressed through the simulation program,
the team made decisions as to the manufacturer’s suggested
retail price, volume discounts, and promotional allowances.
Options were considered for the advertising budget as to the
best choice for each product line, and an advertising agency
selected for each. The relative emphasis on the four types of
advertising messages is herein discussed as well as the teams’
promotion budget with allocations to cooperative advertising
and the three types of consumer promotions. Finally, the sales
force decisions, segmentation, line extensions and the influence
of these decisions on the cumulative net income and final stock
price discussed. Inferences were made throughout the
simulation program as to causation and the team strategically
managed outcomes through manipulating the allocations for the
aforementioned variables to arrive at the desired goals.
Allround Brand Management Final Report – Group B
The brand management team report describes the organizational
conditions and external factors that influenced its decisions and
the results acquired at the end of each period. Also, the team
shares the individual and team learning experience earned
through this process and its contrast to the Initial Strategy Plan.
The initial strategy plan was identified as the main issue
complicating out decisions. To address that, the team evolved
the initial marketing strategy which focused heavily on
increasing net income and stock prices and instead focused on
strategies of differentiation to meet and exceed customer
preferences. This adjustment aligned the team’s decisions with
choices that were profitable for the company, as customers
perceived a greater value in the products and the company sold
an increasing number of units with each period progression. The
information herein highlights this evolution as well as offers
predictions as to what would have happened had there been
advancement to period nine.
Manufacturer’s Suggested Retail Price
Customers rarely concern themselves with the costs that a
company incurs to produce a given product, for them it is the
value of the product or service that it provides and how well
their experience has been (Winer & Dhar, 2011, pp. 247). When
we initially started in period zero, we decided to leave the price
of Allround alone. The case study pointed out that during this
period Allround's suggested retail price was higher than the
competition but was not suffering in sales because of the
effectiveness, high recognition, and consumer loyalty (James,
Kinnear & Deighan, 2015). These elements combined allowed
Allround to dominate and maintain price leadership in the
market. We also felt that Allround was in a different market
space relative to its competitors. The focus moved to other
marketing operations. Throughout the following three periods
we used that mindset to drive our decisions about pricing, which
differed from our initial strategy report but became a sound
strategy.
During period four, there was no budget available to spend on
marketing decisions. The assumption developed that all of the
budgeted funds were spent on the capacity utilization
expenditure, which was 24% over. Compared to competitors,
Allround’s stock price was average; however, its capacity
utilization was 20% higher than Allround’s biggest competitor,
B&B which led to the examination of price inflation throughout
the periods that had passed. Period four marked the beginning
of the repeated analysis of and consideration for inflation. In
efforts to level and stabilize pricing and utilization, the
inflation rate of 4.1% was doubled, and Allround’s price rose to
$5.77. In period five, efforts were successful in cutting down
capacity utilization by 25%, increasing net income, and
increasing the stock price. From period five to seven the price
of Allround was raised each period to avoid the same pitfall.
Reports were purchased to assess and adjust for market trends
including competitor's pricing, inflation, and consumer
preferences from the conjoint analysis to help gauge our
customer's pricing sensitivity. The MSRP of Allround
successfully rose to $6.11 by the end of period seven.
Period three saw the introduction of Allround+, and the MSRP
was set at $5.01. This price point was arrived at due to the
uniqueness of the product, and formula comparisons suggested
that the price was a good starting point from which we could
later adjust if need be. During period four, inflation was
accommodated for with price increases for Allround and
Allround+ of Allround+. From period five to period seven we
slowly increased the price to stay competitive and combat
capacity utilization. Period seven ended with the price of
Allround+ being $5.89. In period five, Allright was introduced
to the market. This formulation was a four-hour, non-drowsy
allergy medication which was the first-to-market. From the
data reports, it was known that consumers showed a preference
for fewer side effects and the preference to avoid over-
medicating (James, et al., 2015). For these reasons, together
with the cost of production per unit, the price was set at $5.95.
During period six it was opted to not to increase the price of
Allright as our brand awareness for the drug was only 17.4%.
Instead, other areas continued to be focused on to improve
brand awareness - such as promotions. In period seven, the
price was raised to $6.12 to be reflective of competition and
inflation. Had there been a period nine, inflation, consumer
price preferences and cost would continue to influence the
MSRP. However, it was agreed that more emphasis would be on
these factors that had been placed on them during periods zero
through eight.
Discounts and Allowances
Volume Discounts
Volume discounts for the Allround, Allround+, and Allright
brand remained consistent for the first five periods. In period
five however, volume discounts were reduced from 25% to 22%
for quantities between 250 and 2500. Volume discounts offered
were too high and the decrease was made to drive sales to other
volume categories for Allound. The volume discounts were then
continued at the new 22% rate through the final period.
Providing volume discounts to retailers based on quantity
purchased incentivizes retailers to carry and stock the product.
However, providing too high of a discount causes a loss of
profits for the manufacturer and is not reflective of the same
rate of benefits as smaller volume discounts. Had there been a
period nine, it would be expected that the same strategy for
volume discounts would be followed, as the initial discount rate
reduced the potential profits for the company.
Allowances
As stated in our initial strategy report our plan was to use a
push/ pull strategy to increase sales. "Trade promotions can be
best understood as part of an overall channel management
strategy based on an accurate perception of both market power
and the relative power of the channel participants" (Kasulis,
Morgan, Griffith & Kenderdine, 1999). To achieve this,
starting in period one, all category allowances were set to 17%,
to arrive at some consistency, as the team became more familiar
with the effects of decisions made. Allowances were matched
for each of the product line allowance categories because
allowances were the most poorly understood tool throughout the
simulation. The choices that were arrived at were made to gain
an advantage from offering higher than the competitor’s average
promotional allowances. “Retailers or other distributors want to
be assured that you will spend sufficient money and pay
attention to persuading the customers to want your brand. These
two activities draw an important distinction between two kinds
of basic activities of channel management: push(getting
channels to carry and sell the product) and pull(motivating
customers to ask for your brand by name)” (Winer & Dhar,
2015).
During period three, the promotional allowances were decreased
for independent drugstores and convenience stores as the
discounts were not the best manner for stimulating these
channels as demonstrated by poor performance compared with
other distribution channels.With the introduction of Allright in
period five, all distribution channel allowances increased to
20%. That decision was carried through to period eight where it
was found again, that the higher promotional allowances were
not as beneficial to the results as had been
expected. Promotional allowances were reduced by 2% across
the board which still allow for the highest allocation among
competitors while also being of more significant benefit to the
company by increasing the net income. Had there been a period
nine, efforts would continue to have competitive allowances
which also maximize the return for the company as the group
continued to gain and better understand leverage with allowance
manipulations.
Advertising Budget
The initial advertising budget for Allstar brands' Allround 4-
hour multi-symptom cold & cough medication started at $20
million. However, the market update during the introductory
period showed a $3.3 million increase in advertising spending
(James, et al., 2015). Therefore, we determined that the
Allround advertising budget should be increased to $23.1
million, as it was important to stimulate brand awareness and
have aggressive advertising campaigns to maintain a market
share (Kerin, Hartley, & Rudelius, 2011, pp. 486). During the
first and second periods, the market update showed a $20.8
million and $11.3 million increase for each respective
period. The marketing team determined that Allround’s
advertising budget was amongst the highest during these periods
and gave a small increase to $27.1 million during the first
period with no additional adjustment during the second period
as funds were allocated to other areas of the company (i.e. sales
force & promotional discounts). The third period provided the
opportunity for a product introduction of Allround+, as 12-hour
multi-symptom liquid medication. To accommodate this new
product line the team decreased the Allround advertising budget
to $20 million despite an $18.5 million increase in advertising
spend according to the market update as we were trying to keep
overhead costs down. Therefore, Allround+ was provided a
smaller initial advertising budget of $8 million during this
period. The fourth period showed a $4.9 million decline in
advertising spend, however, the marketing team decided to keep
the advertising budget steady at $20 million for Allround and $8
million for Allround+ (James, et al., 2015).
During the fifth period, advertising spending was up by $13.5
million, and Allstar introduced their third product Allright, a 4-
hour non-drowsy allergy medication (James, et al., 2015). With
the introduction of Allright, the Allround+ budget was slightly
decreased to $6 million in their advertising budget, which was
contributed to performance and the need to allocate funds
towards Allright’s initial budget of $10 million. The initial
advertising budget of Allright was set at a higher amount than
Allround+ to help with brand awareness during the introduction
period. Otherwise, no changes were made to Allround during
this period due to its excellent performance in the market. The
sixth period showed an increase of $5.4 million in advertising
spending, so Allround+ and Allright's advertising budgets were
increased to $7 million and $12 million respectively to better
match the competition. The Allround budget saw no changes
during this period and stayed at $20 million (James, et al.,
2015).
Although the seventh period’s market updates showed a $5.3
million increase in advertising spending, no changes were made
to either the Allround+ or Allright budgets due to steady
performance. However, Allround’s budget had a slight increase
to $22 million in retaliation to a rise in the Allround's primary
competitor’s advertising budget, which the marketing team felt
was necessary to maintain market share. The eighth and final
period showed an increase of $4.2 million in advertising
spending; however, Allstar's marketing team determined that all
budgets were appropriate and made no changes. The same
thought process would be applied to all products for a ninth
period if it existed, so long as the advertising spend of
competitors continued to incremental increases (James, et al.,
2015).
Selected Advertising Agency
Brand awareness is the cornerstone of any product’s
success; therefore, the selection of an advertising agency is as
equally important as the advertising budget provided for a given
product. The Allstar brands marketing team had three
advertising agencies to choose from, Brewster, Maxwell, &
Wheeler (BMW) who charged a 15% commission for their
services; Sully & Rogers (S&R), who cost a 10% commission;
and Lester, Loebol, and Company (LLC), who charged a 5%
commission for their services (James, et al., 2015).
It is crucial that a product gains some market share during the
introductory period, which is why the Allstar marketing team
thought it was important that their products be perceived as the
superior brand (Winer & Dhar, 2011, pp. 56). Additionally, it
is crucial to select the right advertising agency that has a track
record in promoting similar products and promoting to the
target audiences for those products (Kerin, Hartley, & Rudelius,
2011, pp. 489). Therefore, the marketing team selected BMW
for Allround in this introductory period, as they were perceived
to be a superior agency for this market. During the first period,
Allround managed to obtain 23.7% of the market, and in the
second period, it decreased slightly to 22.5%. The subsequent
periods maintained a similar amount with little variance;
therefore, the marketing team stayed consistent in keeping
Allround's advertising with the BMW agency since the product
performance had done well in market surveys. During the third
period, Allstar introduced Allround+ and the marketing team
utilized the BMW agency again, in the hopes that this product's
performance would be similar to that of Allround. However,
this strategy did not perform as planned, so a switch to S&R
was made for Allround+ to reduce some of the overhead
expenses for Allstar during the fifth period since the market
share was at 3.2%. This change resulted in an increase to 4.1%
in the sixth period and 4.7% in the seventh period. Therefore,
the market team kept Allround+ with S&R to maintain the
incremental growth that was seen in the market share (James, et
al., 2015).
During the fifth period, Allstar introduced another product line
Allright, which was given to the BMW advertising agency for
promotion in the hopes that this product would corner the
allergy medication market due to it being the only non-drowsy
option available. The channel sales report showed a 2% market
share during its introductory period; however, this almost
doubled to 3.7% during the seventh period. So the team kept
Allright with BMW throughout these final periods and would
have made no changes during the ninth period (had it existed),
as long as the performance continued to maintain as it
did (James, et al., 2015).
Relative Emphasis on the Four Types of Advertising Messages
The emphasis that was put on the advertising message was
driven by the stage of the product’s life cycle and the strategic
objective, both of which had to be reassessed throughout the
simulation. Primary advertising messages were used to create
awareness, benefits to highlight the value of the product
function, comparison to showcase our product against our
chosen competitor and the reminder to bolster awareness after
the consumer was made aware of the product's primary features
and benefits (James, et al., 2015). Posttests measuring brand
awareness gauged the effectiveness of primary advertising
messages, and the percentage of increase or decline in unit sales
for the line was used to guide messaging efforts (Pride &
Ferrell, 2014).
With the introduction of line extensions, the strategy was to
drive awareness with primary messages at 40% for the first
period for Allround+ and 30% for Allright. Allright’s stress on
primary messaging was lower than Allround+ due to the
uniqueness of the product where the team was comfortable
putting equal importance on benefit at 30%, and a healthy
30% was allocated to reminder to stimulate repurchase for the
year that exists within each period. This success was measured
with brand awareness ratings.
In period zero, Allround had 74.1% brand awareness, and the
decision was made to focus on stimulating repurchase, which
was appropriate for Allround’s period in the life cycle. By
period seven Allround comfortably rested with 10%, 20%, 30%
and 40% allocated to primary, benefits, comparison, and
reminder, respectfully. Adjustments were made to Allround's
advertising message for period eight because an expectorant was
added to Allround, where benefits were increased to 22% to
promote this reformulation.
Allround+ was introduced in period four, and advertising
messages were allocated with 40% to primary, 40% to benefits,
10% to comparison with Besthelp and 10% to reminder to
stimulate repurchase during the one year to follow (James, et
al., 2015). The reasoning for this allocation was to create
awareness for the product as it enters the first stage of the
product life cycle (Perreault Jr, Cannon & McCarthy, 2014) and
to emphasize its benefits. The allotments were kept the same for
period five and for period six they were adjusted so that 15%
was set to primary awareness, 35% for benefits, 30% for
comparison with Dryup and 20% for reminder messages.
ThisThese changes were made because awareness had grown to
55.3% and Dryup appeared to be a good comparison as the
brand formulations were quite similar (James, et al., 2015). The
advertising benefits were shifted from primary to remind as
awareness was high and stimulating repurchasing was needed to
maintain sales. These allocations were maintained through
period 7. In period eight, even greater emphasis was to be on
repurchase, and therefore reminder was increased to 25%. The
comparison product was also changed to Extra as it was decided
that comparing Allround+ to another 12-hour OCM capsule was
a sounder strategy.
The introduction of Allright was very similar and the product
launch started with 30% primary, 30% benefits, 10%
comparison and 30% reminder. The high reminder was favored
despite being the launch of Allright because of the product’s
uniqueness and the fact that each period was one year where it
was hoped to capture some repurchases during that time. In
periods seven and eight Allright’s customer satisfaction
increased to 51.2% (James, et al., 2015) and this highlighted the
importance of stimulating repurchasing. Our brand awareness
was low at 23.2%, and the decision was made to equally address
the areas of advertising with 25% allocated to each advertising
message.
Should the simulation have progressed to period nine, it is
reasonable to expect to see a similar pattern where with the
continued need to assess the performance indicators before
making decisions as to the best allocation for advertising
messages.
Promotional Budget with Allocations and the Three Types of
Consumer Promotions,
Point of Purchase and Co-op Advertising
Consumer promotions included point of purchase, trial size
promotional products, and coupons. To increase sales in period
four, we expanded our point of purchase budget from $1.7
million to $3 million. Point of purchase money is paid to the
retailer but targets the end consumer. By increasing this budget,
we were able to promote our products with display racks, sales
rack, on-shelf advertisements and securing better product
placement. Also, a greater emphasis focused on increasing the
co-op advertising budget to help retailers promote Allround,
Allround+ and Allright products to improve awareness through
the different distribution channels.
At the beginning of the stimulation no funds had been allocated
to trial size promotion allowance, and the trial size budget was
set to allocating $700,000. The goal of trial size promotions is
to attract potential new consumers to the Allround brand. We
realized after period zero that we should focus our promotional
budget on other areas as trial sizes were of the most benefit for
new products and decreased the budget to $500,000 until period
three and period five when Allround+ and Allright formulations
were released.
Coupons
The team over budgeted for coupons, allocating 4.9 million
dollars for the first two periods and then dropping it to 4.7
million until period four. The high budget for coupons intended
to stimulate repurchase; however coupons were misused.
Coupons are an area of consumer promotion that can be used to
achieve different goals. "Coupons are an effective way to target
discounts and other incentives to households that are
particularly sensitive to price” (Winer & Dhar, 2011). The
strategy when changing the coupon budget was to stimulate
repurchase or to stimulate the initial purchase when there were
brand extensions and reformulations. Had there been a period
nine, a more conservative coupon strategy would help in
keeping costs low.
Sales Force
There is no single best strategy to manage the sales force of a
company because of the varying circumstances and consumer
reaction in the market space, but research has shown that a
larger sales force can have a positive benefit (Dalrymple &
Thorelli, 1984). The group understood the benefit of giving
support to the different distribution channels to dominate the
market, stay competitive, and maintain brand awareness. A
combination of reports from the sales report, sale force, channel
sales, and shelf space reports were used to drive and support our
decisions on staff allocation. In period zero comparisons were
made among competitors and channels to discern points of sales
and the percentage of total sales. This data was then used to
adjust the sales force according to that data. Overall we
increased the sales force in each channel to capitalize on
supporting brand awareness, shopping habits and maintain our
market presence.
In period one the importance of channels such as detailers and
mass merchandisers was identified. The heavy focus on the
sales force at the beginning of the stimulation led to the
realization in period three that a large part of the marketing
budget was being spent on the sales force and needed to either
be reduced or at least frozen. The decision was made to freeze
the total staff number, which was justified by acknowledging
the possibility to allocate some of the sales force to the second
product line, Allround+. During periods four through seven,
staffing numbers stabilized which suggested that the company
was within a range that continued to support the growth of the
company, while also allowing the continuation of the company
to dominate the market and successfully manage the budget.
Throughout these periods, resources were reallocated to
different channels and were compared against the competition.
Competitors were used as an indicator as to whether staffing
changes were necessary and this helped to gauge spending as
well. Throughout the stimulation top performers such as grocery
stores, drugstores, and wholesalers received heavier allocations
of staffing. Had there been a period nine, competitors would
continue to be monitored for staffing changes as Allstar looked
to keep costs down by not overstaffing.
Segmentation
Initially, the group planned on targeting the population between
18-30 years of age. The idea behind this strategy was because
the targeted population was technically savvy and could be in a
financial situation where they were more inclined to go with
over-the-counter medications rather than prescription
medication. Infiniti Research (2018) makes similar conclusions
when it comes to market segmentation because companies need
to successfully market to segments that have spending power,
which the group determined the 18 to 30-year-old group would
have.
The group adopted this strategy early in the
simulation. In period two, the group removed empty nesters and
retired individuals from demographic targets due to their low
usage of the Allstar. However, Allstar saw declined sales
between periods two and three. Due to this, the group decided
to add empty nesters and retired individuals back into the
targeted demographics for the remainder of the simulation to
increase the brands market share.
With the introduction of Allround+, the decision was made to
market the product to all demographics, which was sound as the
product was in the introductory phase of the product life
cycle. Winer & Dhar (2016) note that during the initial period
of the product life cycle, a product is new and companies are
attempting to establish the product in the marketplace.
Therefore, by marketing Allround+ to all marketing segments,
the company would be able to produce the most significant
amount of initial market penetration. The same decision was
also made to market to all segments for the group's third
product, Allright.
For future weeks, the market segmentation would have stayed
the same because, throughout the simulation, there was a steady
increase in both stock price as well as income. Additionally,
successful market segmentation caused sustained share of
manufacture sales for Allround as well as continued growth for
both Allround+ and Allright.
Line Extensions
The market for Allround had matured where there was little
differentiation among brands, aggressive promotion and price
dealing (Perreault Jr, et al., 2014). This created a need to
differentiate through new product lines and the team introduced
Allround+, a 12-hour OCM in period four and Allright, a four
hour non-drowsy allergy capsule, in period six.
Increasing value and differentiation gave successful results as
seen by the increased market shares of and differentiating our
line to meet the needs and preferences of the various segments
within the market became part of our strategy. It was
understood that Allround+ would be competing with our
original Allround 4-hour formula, and a percentage of the
market for Allround decreased each period after the
introduction of Allround+. However, Allround+ was also
increasing in its share of retail sales at a rate higher than
Allround was declining in the share of retail sales (James, et al.,
2015). We saw this continue through periods five through eight.
We interpreted this result as Allround+ gaining organic
customers or those from other products as opposed to
cannibalizing them all from Allround. This encouraged us to
continue with the Allround+ line, and we would have likely
done so into period nine, if that had been an option.
Allstar was the first company to get to market with a non-
drowsy OCM for allergies, which gave us a competitive
advantage. Customers showed preferences for fewer side effects
and concern for over medicating (James, et al., 2015). We saw a
strong satisfaction rating of 54.2% in our first period with
Allright (James, et al., 2015), which shows good value for one
of our key performance indicators. This satisfaction rating
stayed above 51% for the remainder of periods seven and eight
(James, et al., 2015).
Both of our line extensions were not cost effective when they
were first introduced, but that is expected of new products
(Winer & Dhar, 2015) and therefore did not cause alarm. Should
there have been a period nine, continued growth and threat of
entry would be expected with the Allright product.
Cumulative Net Income throughout the Simulation and Final
Stock Price
Cumulative net income and stock price were essential factors
throughout the simulation. Since all decisions made during the
simulation directly affected both of these metrics, careful
consideration was required to maintain consistent, positive
growth for both numbers throughout the course of the
simulation. The impact of marketing decisions on both
cumulative net income and stock price has real-world
applications, as noted by Kumar & Shah (2009). Kumar & Shar
(2009) point out by successfully marketing to consumers with
large consumer equity, a company can drive stock price in a
positive direction.
At the beginning of the simulation, Allround was a
market leader in its segment and in the maturity phase of the
product life cycle as referenced by Winer & Dhar (2016). Since
the maturity phase is categorized by a product being well known
in the marketplace with a flattening sales curve, marketing
decisions were made to ensure that Allround was stable and kept
steady sales. This was accomplished through conservative
changes in both sales force distribution as well as minimizing
reformulations throughout the simulation. This conservative
approach contrasted with a more aggressive marketing strategy
for the other two products released throughout the simulation in
terms of budgeting of sales force and marketing versus spending
of competitors the products were in direct competition
with. The reasoning behind the aggressive marketing for the
new products was to ensure an immediate entry into the market
with the goal of having a rapid growth in market share.
While the group was ultimately successful in raising
both cumulative net income and stock price to $960.3 million
and $141.43 respectively, there were lessons learned throughout
the simulation. The group’s stock price and net income did not
grow as rapidly as intended throughout the first half of the
simulation. Retail price was not increased in the beginning to
keep pace with inflation. Additionally, the group’s gross margin
increased too much during the first half of the simulation. Both
of these factors caused overproduction to occur. To counteract
this, the group successfully brought spending in line and
managed prices correctly to bring production levels to a
profitable level.
References
Dalrymple, D. J., & Thorelli, H. B. (1984). Sales force
budgeting. Business Horizons, 27(4), 31-
36. doi:10.1016/0007-6813(84)90054-5
Infiniti Research. (10 October, 2018). 5 Essential Criteria for
Developing a Target Market
Segmentation Strategy - An Infiniti Research Case
Study on the Healthy Drinks Segment. Business Wire (English).
Retrieved from https://saintleo.idm.oclc.
org/login?url=http://search.ebscohost.com/login.aspx?direct=tru
e&db=bwh&AN=bizwire.c86618407&site=ehost-
live&scope=site
James, S., Kinnear, T., & Deighan, M. (2015). PharmaSim The
Marketing Management
Simulation. Interpretive Simulations. Charlottesville,
VA.
Kasulis, J. J., Morgan, F. W., Griffith, D. E., & Kenderdine, J.
M. (1999). Managing trade
promotions in the context of market power. Journal of
the Academy of Marketing Science, 27(3), 320-332. Retrieved
from https://saintleo.idm.oclc.org/login?url=https://search-
proquest-
com.saintleo.idm.oclc.org/docview/224877874?accountid=4870
Kumar, V., & Shah, D. (2009). Expanding the Role of
Marketing: From Customer Equity to
Market Capitalization. Journal of Marketing, 73(6), 119–136.
https://doi-org.saintleo.idm.oclc.org/10.1509/jmkg.73.6.119
Perreault Jr., Cannon, J. P., & McCarthy, E. J. (2014). Basic
marketing: A marketing strategy
planning approach (19th ed.). New York: McGraw
Hill/Irwin
Pride, W. M. & Ferrell, O. C. (2014). Marketing. Mason, Ohio:
South-Western, Cengage
Learning
Winer, R. S. and Dhar, R. (2016). Marketing management (4th
ed.). Boston, MA: Pearson
Learning
Solution
s.
Winer, R., & Dhar, R. (2011). Marketing Management (4th ed.).
Harlow, Essex: Pearson.
APPENDIX A
Pharmasim Period by Period Performance Summary and
Interpretation
Figure 1Net income over the eight periods of the simulation.
Reproduced from James, Kinnear & Deighan, 2015.
Figure 2Stock price for the eight periods of the simulation.
Reproduced from James, et al., 2015.
Figure 3Pharmasim performance summary for period zero.
Reproduced from James, et al., 2015.
Period zero allowed the group to familiarize themselves with
the current standing of Allround and assess how to manipulate
starting figures and monies as seen in Figure 3 in order to
achieve the goals set out in the initial strategy report (see
Appendix B).
Figure 4Pharmasim performance summary for period one.
Reproduced from James, et al., 2015.
In period one, slight changes were made so that the market
response to our decisions could be observed. In this period, an
overall advertising budget of around $23.1 million was
allocated for Allround, and BMW advertising agency was
selected for advertising, as seen in Figure 4. The purpose of
these decisions was to present the company as a brand offering
quality products of high value. As a result of the decision in
this period, there was an increase in net income from $67million
to $80 million and a stock price increase from $38 to $48.
Figure 5Pharmasim performance summary for period two.
Reproduced from James, et al., 2015.
In period two, it was decided to increase the sales force
allocation of chain drug stores, grocery stores, and wholesaler
support. The price and discounts were kept constant to examine
any effect this would have on the net income. There was an
incident this period about quality assurance, and it was decided
to dispose of the expiring batch with a decision cost of
$100,000 to avoid the risk of damage to the brand image. These
choices led to a slight increase in the net income and stock price
as seen in Figure 5.
Figure 6Pharmasim performance summary for period three.
Reproduced from James, et al., 2015.
In period three, sales force spending was again increased, while
the budget for advertising was decreased to 53.3% of the total
budget. The price and discounts were kept at the same level.
This period generated an incident of cannibalization, meaning
that the sale of one product is decreasing the sales of another
product. The decision was made to introduce the 12-hour multi-
capsule. The decisions at this period were not optimal as the
company experienced a decline in the net income and the stock
price as seen in Figure 6. This may be because fixed costs were
increased and the MSRP was not adjusted for inflation.
Figure 7Pharmasim performance summary for period four.
Reproduced from James, et al., 2015.
In period four, it was decided that the budget allocations ought
to be reassessed and reallocated to optimize the benefits of
where the budget is being spent. Part of this assessment and
reallocation included the decrease of the advertising budget for
Allround from $27.1 million to $20 million and reallocating
those monies together with an additional $0.9 million towards
the advertising budget for the new product line,
Allround+. BMW advertising agency was kept for both product
lines. To aid in launching the new line extension Allround+, the
promotion budget for this product was initially set higher than
Allround, particularly with trial sizes as seen in Figure 7. These
decisions lead to a positive change in net income and stock
price.
Figure 8Pharmasim performance summary for period five.
Reproduced from James, et al., 2015.
In the period five, the overutilization of capacity was addressed
as operations were at 124.7% of the capacity as seen in Figure
8. Knowing the impact of such utilization, it was expected to
negatively impact the net income if not addressed. Therefore, it
was decided to increase the price to decrease the number of
units produced and sold. As a result of the price increase, the
net income experienced a solid increase to $116 million;
utilization came down to 99.5%. Furthermore, these changes
translated into an increase in stock price to $76.16.
Figure 9Pharmasim performance summary for period six.
Reproduced from James, et al., 2015.
For period six, the price of Allround was kept at $5.77, and the
price for Allround+ was increased from $5.18 to $5.35. In
comparison to Allround, Allround+ was performing poorly for
the amount that was invested in the product’s advertising and
promotion as seen in Figure 9. Without being able to come to a
consensus and to increase the efficiency of the advertising
budget, the advertising agency for Allround+ was changed to
S&R advertising agency, and the advertising budget was
decreased by $2 million. In addition, a new product line called
Allright was introduced. The MSRP was set at $5.95 and $10
million was allocated for this product’s advertising budget. The
decisions made during this period generated an increase of net
income to $127 million and a stock price increase to $99.09.
Figure 10Pharmasim performance summary for period seven.
Reproduced from James, et al., 2015.
In period seven, the price was increased conservatively for three
of the products to adjust for inflation, while keeping the
discounts brackets the same. The advertising budget was also
increased for Allright and Allround+ while keeping the budget
for Allround the same. As for the promotion strategy, we tried
to balance the budget for all three products. These decisions
lead to a further increase in net income to $150 and a further
increase in stock price to $123.76 as seen in Figure 10.
Figure 11Pharmasim performance summary for period eight.
Reproduced from James, et al., 2015.
For the period eight, the prices for Allround and Allright were
increased, while keeping the discount levels the same with the
intention of improving the gross margins. An increase of 10%
was added to the adverting budget for Allround and the other
two products remained as they were in period seven. During this
period, the incident of product tampering was addressed. In
dealing with this incident, a statement of sympathy was issued
for the victims; all damaged products were removed from the
shelves at the cost of $100,000 and compensation was offered to
victims at the cost of $500,000. Despite these additional costs,
the decisions for this period generated a net income increase to
$170 and a stock price increase to $141.43 as seen in Figure
11.
Overall, the firm managed to create an average stock increase of
around 18% for each of the eight periods, which can be
considered as a solid return for the investors.
APPENDIX B
Allstar Brand Initial Strategy Report
Group B: Andrew Carroll, Kelly Decker, Kerline Desir, Abigail
Espeut, Alexander Fullerton, Diane Giewat & Vince Hamm
Saint Leo University
MBA 565
James Womick
Student Signature: [Andrew Carroll, Kelly Decker, Kerline
Desir, Abigail Espeut, Alexander Fullerton, Diane Giewat &
Vince Hamm]
Allstar Brands Corporation was founded in 1924 and since then
has acquired smaller packaged good companies making it one of
the leading manufacturers in the world. The Pharmaceuticals
Division of the company has made Allstar Brand’s Allround a
critical element in the future success of the company. Allround
is a market leader in over-the-counter cold and allergy
medications. To meet the expectations of the division and
participate in the innovation and future success of the company,
Allround’s product line will need to develop a strategy that aids
in the decision-making process. This process and plan will
support the growth needed to increase cash flows, the presence
required to maintain a competitive advantage, and the customer
service needed to build long-lasting relationships with
consumers.
Allround brand produces a four-hour liquid cold medicine that
provides a multi-symptom relief; this relief comes from a
formula that includes an analgesic, an antihistamine, a
decongestant, a cough suppressant, and alcohol. Each of these
ingredients focuses on a specific type of ailment: analgesics
provide pain relief, antihistamines reduce secretions from nose
and eyes, decongestants reduce nasal congestion, cough
suppressants reduce the cough reflex, and alcohol provides a
base for the other ingredients and helps a person recuperate.
This is important because these ingredients give Allround brand
a foundation for the type of consumers they want to serve,
people who are experiencing one or more of these symptoms
and are willing to try an over-the-counter remedy. The targeted
group will be a younger population of 18-30 years of age
because they more aware of drug uses, looking for a one pill
fix, technologically savvy, not afraid to research treatment
options, and can be struggling financially or have no medical
insurance leading to the inclination to try over-the-counter
medication (OCM).
Allstar’s longevity, global sales, economies of scale and
experience curve are the foundation for its competitive
advantage. It is a trusted household name, having been
manufacturing household products since 1924 (James, Kinnear
& Deighan, 2014). When it comes to over-the-counter
medication, brand recognition can be a key determinant in
consumer purchasing decisions. Allround’s short term
competitive advantage will focus on differentiation and its long-
term competitive advantage will be supported by operational
effectiveness and adaptability.
To gain a short-term competitive advantage, Allround will
employ value-adding practices. These practices will be realized
though adding the perception of greater value by utilizing
comparative marketing measures, which highlight that Allround
does in one bottle what competitors do in several competing
formulas from different brands. “Why fuss with all the clutter of
multiple bottles when you can get the relief that you’re looking
for with just one trusted (name)’ will be a message that we
portray to consumers to help add value to the Allround formula.
The appropriateness of this will be revisited with each term
and/or when new formulas and revisions are being
considered. Given that our target consumers are looking for
convenient and less expensive products, having two or more
product features/benefits fused into one can be a major
advantage for our sales.
Price point is important and must be taken into consideration
with perceived value. When consumers perceive products as
being equal with all other attributes, price becomes the primary
consideration in the purchase decision (Winer, 2016).
Allround’s manufacturer's suggested retail price (MSRP) point
of $5.29 is not the highest among competing brands with high
market share manufacturers such as Coughcure at $5.49 and End
at $5.29 with 63.6% and 46.3% of the OCM market share
respectively (James, et al., 2014). Coughcure and End, having
comparable prices but limited formulations and limited product
benefits, allow for Allround to have competitive leverage with
comparative marketing and therefore is not considering a
change in MSRP. Economies of scale state that Allstar’s global
position will help to reduce costs of production for Allround
through large-scale operations and Allstar’s experience curve
will help to keep costs of production low through learned
innovative measures and time spent streamlining the process
(Winer, et al. 2016) giving Allround a price-based advantage.
Allround is the current leader in market share for cold products
with 40.4% of the market (James, et al., 2014) however is it
notable to mention that Allround does not hold a share in other
cold product categories targeting symptoms such as nasal and
cough for which Allround is suitable for (James, et al., 2014).
Allround will maintain its competitive advantage long-term
through adaptability to consumer preferences. Consumer
preferences and trends will be taken into consideration with
each proposed formula revision as well as at each term.
Allstars performance objectives will focus on increasing our
position within the market. In order to do this, we must
penetrate the market. By increasing market penetration from
the current 60% to 80%, sales would climb 33%. Current sales
are $355.3 million, an expected 33% increase would bring sales
to $472.5 increasing slightly over $117 million. Overall our
projected return on investment is the most important factor
when demonstrating our marketing
effectiveness. Current market reports show there is
room for growth in all the major product categories, including
cold, cough, allergy and nasal. Allround history within the
market shows on consumer surveys where they have the highest
percentage in brand awareness, brand trails and most frequently
purchased. While still being competitive in conversion ratio
and retention ratio there is room for improvement and will be a
focus of two of our intermediary metrics. Allstar’s will use
Allround’s company history and current position in the market
in order to penetrate the market and grow our share of
it. Using a marketing mix and implementing a
push/pull strategy will be the focus to increase sales. Strong
brands are more appealing to channel partners, when using this
method. The push strategy will focus on trade promotions,
which would allow us to include a higher than average
promotional allowance and offer volume discounts. On the pull
side, our strategy will include additional money being budgeted
for consumer promotions and advertising. Expanding
distribution channels will be beneficial in attracting and
retaining new consumers and increasing our sales force.
Currently Allround distributes zero trial size promotional
items. Adding additional promotional activities will attract
potential consumers to our products after introducing it to them
and offering a chance to experience their effects.
Product development will also be on the forefront of our
strategy. Focusing on product reformulation, line extension and
introducing new products in the hopes of attracting new
consumers and improving our brand positioning. Allstar’s will
focus on total conversion ratio which is referenced in consumer
survey. “Total conversions is one of the most important metrics
for measuring the profitability of your overall marketing
efforts” (DeMers, 2014). Although customer retention is
difficult to measure it will be a focus of our strategy because
customer retention is needed for Allstar’s to be successful in the
long run. Retaining existing consumers if more sustainable and
cost-effective than actively pursuing new ones. Stock
price and market share will provide a good indication of
Allstar’s success throughout stimulation. Current stock price is
$38.35. Allstar’s will focus efforts on marketing efficiency,
share of unit sales, brand awareness, customer satisfaction,
capacity utilization, market share and net income because these
areas will influence our stock price.
For each period, the OCM team will analyze the available
market and industry of information, along with surveys related
to marketing behavior, competitor’s activities, consumer's
opinion, and internal management goals. The OCM team will
utilize this information to determine the allocation of the
marketing budget, pricing, advertisement options, sale force
distribution, retailers’ allowance and discounts percentage and
customers’ promotions option. Special attention will be given to
the two highest competitors for each period and the performance
will also be considered when adjusting these decisions (Winer
& Dhar, 2016, pp. 36). Furthermore, the OCM team will utilize
current and potential customers feedback to determine the value
proposition of the new products that are being introduced and in
return, these sources of information for identifying market
trends and patterns will help to determine if product usage has
increased or decreased due to brand expansion. Each period will
advance the promotion of positive marketing efforts and
sustainability of this strategic marketing plan.
Period 1– Reformulate multi-symptom medication by replacing
the cough suppressant with an expectorant.
Period 2– Line extension of children’s 4-hour liquid medication.
Period 3– Reformulate multi-symptom medication by dropping
alcohol ingredient.
Period 4– Line extension of 12-hour multi-symptom capsule.
Period 5– New product introduction of cold spray.
Period 6– New product introduction of 4-hour allergy capsule.
Period 7– Reformulation of cold spray with addition of flavor
offering.
Period 8– Reformulation of 4-hour allergy capsule with
extension to 12-hour relief.
In summary, the Allstar’s product Allround is a segment
leader in over-the-counter cold medicine. With a
comprehensive formula, Allround has been successful in
capturing 40.4% market share for cold medicine, but has not
captured market share in the segments of nasal and
cough. Therefore, Allstar will use its household name and
brand appeal to increase market share through specific targeting
of consumers aged 18-30. This will be accomplished through
product development as well as by maximizing existing
distribution channels and increasing spending in consumer
promotions. Ultimately, by adopting the aforementioned to its
strategy, Allstar is expected to increase its market share from
60% to 80%, with a projected sales increase of 33%.
References
Deighan, M., James, S., and Kinnear, T. (2018). “PharmaSim
Decision Aids”. Interpretive
Abstract This paper explores the team-based decisions througho.docx

More Related Content

Similar to Abstract This paper explores the team-based decisions througho.docx

Lecture 5 pricing strategies
Lecture 5 pricing strategiesLecture 5 pricing strategies
Lecture 5 pricing strategiesAshmond Ansere
 
Pharmasim final report
Pharmasim final reportPharmasim final report
Pharmasim final reportAuT Tanwichit
 
Allround Marketing Plan
Allround Marketing PlanAllround Marketing Plan
Allround Marketing PlanEbonee Elliott
 
Strategic marketing management report
Strategic marketing management reportStrategic marketing management report
Strategic marketing management reportAndrea Cappozzo
 
price is to set a monetary cost for products and services of financial and ba...
price is to set a monetary cost for products and services of financial and ba...price is to set a monetary cost for products and services of financial and ba...
price is to set a monetary cost for products and services of financial and ba...MengsongNguon
 
TitleABC123 Version X1Marketing Plan Outline and Time
TitleABC123 Version X1Marketing Plan Outline and TimeTitleABC123 Version X1Marketing Plan Outline and Time
TitleABC123 Version X1Marketing Plan Outline and TimeTakishaPeck109
 
MBA 670 Project 3Individual AnalysisThis report is not reflect
MBA 670 Project 3Individual AnalysisThis report is not reflectMBA 670 Project 3Individual AnalysisThis report is not reflect
MBA 670 Project 3Individual AnalysisThis report is not reflectAbramMartino96
 
Mba 670 project 3 individual analysisthis report is not reflect
Mba 670 project 3 individual analysisthis report is not reflectMba 670 project 3 individual analysisthis report is not reflect
Mba 670 project 3 individual analysisthis report is not reflectamit657720
 
Benefits of customer retention and reichheld’s loyalty management strategy
Benefits of customer retention and reichheld’s loyalty management strategyBenefits of customer retention and reichheld’s loyalty management strategy
Benefits of customer retention and reichheld’s loyalty management strategyMiraziz Bazarov
 
Paying the ad_agency
Paying the ad_agencyPaying the ad_agency
Paying the ad_agencyAdCMO
 
IPA's Advertising In A Downturn
IPA's Advertising In A DownturnIPA's Advertising In A Downturn
IPA's Advertising In A DownturnMichael Johnston
 
JOURNAL OF CONSUMER MARKETING, VOL. 15 NO. 5 1998, pp. 435-448.docx
JOURNAL OF CONSUMER MARKETING, VOL. 15 NO. 5 1998, pp. 435-448.docxJOURNAL OF CONSUMER MARKETING, VOL. 15 NO. 5 1998, pp. 435-448.docx
JOURNAL OF CONSUMER MARKETING, VOL. 15 NO. 5 1998, pp. 435-448.docxpriestmanmable
 
Why Is It Always Volume Before Price?
Why Is It Always Volume Before Price?Why Is It Always Volume Before Price?
Why Is It Always Volume Before Price?Kantar
 
Advertising During Times Of Economic Uncertainty
Advertising During Times Of Economic  UncertaintyAdvertising During Times Of Economic  Uncertainty
Advertising During Times Of Economic UncertaintyBG Mahesh
 
dịch đo lường.docx
dịch đo lường.docxdịch đo lường.docx
dịch đo lường.docxNamTrnhHoi1
 
Anatomy-Of-A-World-Class-Sales-Organization
Anatomy-Of-A-World-Class-Sales-OrganizationAnatomy-Of-A-World-Class-Sales-Organization
Anatomy-Of-A-World-Class-Sales-OrganizationFrank Troppe
 

Similar to Abstract This paper explores the team-based decisions througho.docx (20)

Lecture 5 pricing strategies
Lecture 5 pricing strategiesLecture 5 pricing strategies
Lecture 5 pricing strategies
 
Pharmasim final report
Pharmasim final reportPharmasim final report
Pharmasim final report
 
Allround Marketing Plan
Allround Marketing PlanAllround Marketing Plan
Allround Marketing Plan
 
Strategic marketing
Strategic marketingStrategic marketing
Strategic marketing
 
Sales promotion
Sales promotionSales promotion
Sales promotion
 
Strategic marketing management report
Strategic marketing management reportStrategic marketing management report
Strategic marketing management report
 
Marketing Unit3.ppt
Marketing Unit3.pptMarketing Unit3.ppt
Marketing Unit3.ppt
 
price is to set a monetary cost for products and services of financial and ba...
price is to set a monetary cost for products and services of financial and ba...price is to set a monetary cost for products and services of financial and ba...
price is to set a monetary cost for products and services of financial and ba...
 
TitleABC123 Version X1Marketing Plan Outline and Time
TitleABC123 Version X1Marketing Plan Outline and TimeTitleABC123 Version X1Marketing Plan Outline and Time
TitleABC123 Version X1Marketing Plan Outline and Time
 
MBA 670 Project 3Individual AnalysisThis report is not reflect
MBA 670 Project 3Individual AnalysisThis report is not reflectMBA 670 Project 3Individual AnalysisThis report is not reflect
MBA 670 Project 3Individual AnalysisThis report is not reflect
 
Mba 670 project 3 individual analysisthis report is not reflect
Mba 670 project 3 individual analysisthis report is not reflectMba 670 project 3 individual analysisthis report is not reflect
Mba 670 project 3 individual analysisthis report is not reflect
 
Group 6 Service Marketing.pptx
Group 6 Service Marketing.pptxGroup 6 Service Marketing.pptx
Group 6 Service Marketing.pptx
 
Benefits of customer retention and reichheld’s loyalty management strategy
Benefits of customer retention and reichheld’s loyalty management strategyBenefits of customer retention and reichheld’s loyalty management strategy
Benefits of customer retention and reichheld’s loyalty management strategy
 
Paying the ad_agency
Paying the ad_agencyPaying the ad_agency
Paying the ad_agency
 
IPA's Advertising In A Downturn
IPA's Advertising In A DownturnIPA's Advertising In A Downturn
IPA's Advertising In A Downturn
 
JOURNAL OF CONSUMER MARKETING, VOL. 15 NO. 5 1998, pp. 435-448.docx
JOURNAL OF CONSUMER MARKETING, VOL. 15 NO. 5 1998, pp. 435-448.docxJOURNAL OF CONSUMER MARKETING, VOL. 15 NO. 5 1998, pp. 435-448.docx
JOURNAL OF CONSUMER MARKETING, VOL. 15 NO. 5 1998, pp. 435-448.docx
 
Why Is It Always Volume Before Price?
Why Is It Always Volume Before Price?Why Is It Always Volume Before Price?
Why Is It Always Volume Before Price?
 
Advertising During Times Of Economic Uncertainty
Advertising During Times Of Economic  UncertaintyAdvertising During Times Of Economic  Uncertainty
Advertising During Times Of Economic Uncertainty
 
dịch đo lường.docx
dịch đo lường.docxdịch đo lường.docx
dịch đo lường.docx
 
Anatomy-Of-A-World-Class-Sales-Organization
Anatomy-Of-A-World-Class-Sales-OrganizationAnatomy-Of-A-World-Class-Sales-Organization
Anatomy-Of-A-World-Class-Sales-Organization
 

More from bartholomeocoombs

CompetencyAnalyze how human resource standards and practices.docx
CompetencyAnalyze how human resource standards and practices.docxCompetencyAnalyze how human resource standards and practices.docx
CompetencyAnalyze how human resource standards and practices.docxbartholomeocoombs
 
CompetencyAnalyze financial statements to assess performance.docx
CompetencyAnalyze financial statements to assess performance.docxCompetencyAnalyze financial statements to assess performance.docx
CompetencyAnalyze financial statements to assess performance.docxbartholomeocoombs
 
CompetencyAnalyze ethical and legal dilemmas that healthcare.docx
CompetencyAnalyze ethical and legal dilemmas that healthcare.docxCompetencyAnalyze ethical and legal dilemmas that healthcare.docx
CompetencyAnalyze ethical and legal dilemmas that healthcare.docxbartholomeocoombs
 
CompetencyAnalyze ethical and legal dilemmas that healthcare wor.docx
CompetencyAnalyze ethical and legal dilemmas that healthcare wor.docxCompetencyAnalyze ethical and legal dilemmas that healthcare wor.docx
CompetencyAnalyze ethical and legal dilemmas that healthcare wor.docxbartholomeocoombs
 
CompetencyAnalyze collaboration tools to support organizatio.docx
CompetencyAnalyze collaboration tools to support organizatio.docxCompetencyAnalyze collaboration tools to support organizatio.docx
CompetencyAnalyze collaboration tools to support organizatio.docxbartholomeocoombs
 
Competency Checklist and Professional Development Resources .docx
Competency Checklist and Professional Development Resources .docxCompetency Checklist and Professional Development Resources .docx
Competency Checklist and Professional Development Resources .docxbartholomeocoombs
 
Competency 6 Enagage with Communities and Organizations (3 hrs) (1 .docx
Competency 6 Enagage with Communities and Organizations (3 hrs) (1 .docxCompetency 6 Enagage with Communities and Organizations (3 hrs) (1 .docx
Competency 6 Enagage with Communities and Organizations (3 hrs) (1 .docxbartholomeocoombs
 
Competency 2 Examine the organizational behavior within busines.docx
Competency 2 Examine the organizational behavior within busines.docxCompetency 2 Examine the organizational behavior within busines.docx
Competency 2 Examine the organizational behavior within busines.docxbartholomeocoombs
 
CompetenciesEvaluate the challenges and benefits of employ.docx
CompetenciesEvaluate the challenges and benefits of employ.docxCompetenciesEvaluate the challenges and benefits of employ.docx
CompetenciesEvaluate the challenges and benefits of employ.docxbartholomeocoombs
 
CompetenciesDescribe the supply chain management principle.docx
CompetenciesDescribe the supply chain management principle.docxCompetenciesDescribe the supply chain management principle.docx
CompetenciesDescribe the supply chain management principle.docxbartholomeocoombs
 
CompetenciesABCDF1.1 Create oral, written, or visual .docx
CompetenciesABCDF1.1 Create oral, written, or visual .docxCompetenciesABCDF1.1 Create oral, written, or visual .docx
CompetenciesABCDF1.1 Create oral, written, or visual .docxbartholomeocoombs
 
COMPETENCIES734.3.4 Healthcare Utilization and Finance.docx
COMPETENCIES734.3.4  Healthcare Utilization and Finance.docxCOMPETENCIES734.3.4  Healthcare Utilization and Finance.docx
COMPETENCIES734.3.4 Healthcare Utilization and Finance.docxbartholomeocoombs
 
Competencies and KnowledgeWhat competencies were you able to dev.docx
Competencies and KnowledgeWhat competencies were you able to dev.docxCompetencies and KnowledgeWhat competencies were you able to dev.docx
Competencies and KnowledgeWhat competencies were you able to dev.docxbartholomeocoombs
 
Competencies and KnowledgeThis assignment has 2 parts.docx
Competencies and KnowledgeThis assignment has 2 parts.docxCompetencies and KnowledgeThis assignment has 2 parts.docx
Competencies and KnowledgeThis assignment has 2 parts.docxbartholomeocoombs
 
Competencies and KnowledgeThis assignment has 2 partsWhat.docx
Competencies and KnowledgeThis assignment has 2 partsWhat.docxCompetencies and KnowledgeThis assignment has 2 partsWhat.docx
Competencies and KnowledgeThis assignment has 2 partsWhat.docxbartholomeocoombs
 
Competences, Learning Theories and MOOCsRecent Developments.docx
Competences, Learning Theories and MOOCsRecent Developments.docxCompetences, Learning Theories and MOOCsRecent Developments.docx
Competences, Learning Theories and MOOCsRecent Developments.docxbartholomeocoombs
 
Compensation  & Benefits Class 700 words with referencesA stra.docx
Compensation  & Benefits Class 700 words with referencesA stra.docxCompensation  & Benefits Class 700 words with referencesA stra.docx
Compensation  & Benefits Class 700 words with referencesA stra.docxbartholomeocoombs
 
Compensation, Benefits, Reward & Recognition Plan for V..docx
Compensation, Benefits, Reward & Recognition Plan for V..docxCompensation, Benefits, Reward & Recognition Plan for V..docx
Compensation, Benefits, Reward & Recognition Plan for V..docxbartholomeocoombs
 
Compete the following tablesTheoryKey figuresKey concepts o.docx
Compete the following tablesTheoryKey figuresKey concepts o.docxCompete the following tablesTheoryKey figuresKey concepts o.docx
Compete the following tablesTheoryKey figuresKey concepts o.docxbartholomeocoombs
 
Compensation Strategy for Knowledge WorkersTo prepare for this a.docx
Compensation Strategy for Knowledge WorkersTo prepare for this a.docxCompensation Strategy for Knowledge WorkersTo prepare for this a.docx
Compensation Strategy for Knowledge WorkersTo prepare for this a.docxbartholomeocoombs
 

More from bartholomeocoombs (20)

CompetencyAnalyze how human resource standards and practices.docx
CompetencyAnalyze how human resource standards and practices.docxCompetencyAnalyze how human resource standards and practices.docx
CompetencyAnalyze how human resource standards and practices.docx
 
CompetencyAnalyze financial statements to assess performance.docx
CompetencyAnalyze financial statements to assess performance.docxCompetencyAnalyze financial statements to assess performance.docx
CompetencyAnalyze financial statements to assess performance.docx
 
CompetencyAnalyze ethical and legal dilemmas that healthcare.docx
CompetencyAnalyze ethical and legal dilemmas that healthcare.docxCompetencyAnalyze ethical and legal dilemmas that healthcare.docx
CompetencyAnalyze ethical and legal dilemmas that healthcare.docx
 
CompetencyAnalyze ethical and legal dilemmas that healthcare wor.docx
CompetencyAnalyze ethical and legal dilemmas that healthcare wor.docxCompetencyAnalyze ethical and legal dilemmas that healthcare wor.docx
CompetencyAnalyze ethical and legal dilemmas that healthcare wor.docx
 
CompetencyAnalyze collaboration tools to support organizatio.docx
CompetencyAnalyze collaboration tools to support organizatio.docxCompetencyAnalyze collaboration tools to support organizatio.docx
CompetencyAnalyze collaboration tools to support organizatio.docx
 
Competency Checklist and Professional Development Resources .docx
Competency Checklist and Professional Development Resources .docxCompetency Checklist and Professional Development Resources .docx
Competency Checklist and Professional Development Resources .docx
 
Competency 6 Enagage with Communities and Organizations (3 hrs) (1 .docx
Competency 6 Enagage with Communities and Organizations (3 hrs) (1 .docxCompetency 6 Enagage with Communities and Organizations (3 hrs) (1 .docx
Competency 6 Enagage with Communities and Organizations (3 hrs) (1 .docx
 
Competency 2 Examine the organizational behavior within busines.docx
Competency 2 Examine the organizational behavior within busines.docxCompetency 2 Examine the organizational behavior within busines.docx
Competency 2 Examine the organizational behavior within busines.docx
 
CompetenciesEvaluate the challenges and benefits of employ.docx
CompetenciesEvaluate the challenges and benefits of employ.docxCompetenciesEvaluate the challenges and benefits of employ.docx
CompetenciesEvaluate the challenges and benefits of employ.docx
 
CompetenciesDescribe the supply chain management principle.docx
CompetenciesDescribe the supply chain management principle.docxCompetenciesDescribe the supply chain management principle.docx
CompetenciesDescribe the supply chain management principle.docx
 
CompetenciesABCDF1.1 Create oral, written, or visual .docx
CompetenciesABCDF1.1 Create oral, written, or visual .docxCompetenciesABCDF1.1 Create oral, written, or visual .docx
CompetenciesABCDF1.1 Create oral, written, or visual .docx
 
COMPETENCIES734.3.4 Healthcare Utilization and Finance.docx
COMPETENCIES734.3.4  Healthcare Utilization and Finance.docxCOMPETENCIES734.3.4  Healthcare Utilization and Finance.docx
COMPETENCIES734.3.4 Healthcare Utilization and Finance.docx
 
Competencies and KnowledgeWhat competencies were you able to dev.docx
Competencies and KnowledgeWhat competencies were you able to dev.docxCompetencies and KnowledgeWhat competencies were you able to dev.docx
Competencies and KnowledgeWhat competencies were you able to dev.docx
 
Competencies and KnowledgeThis assignment has 2 parts.docx
Competencies and KnowledgeThis assignment has 2 parts.docxCompetencies and KnowledgeThis assignment has 2 parts.docx
Competencies and KnowledgeThis assignment has 2 parts.docx
 
Competencies and KnowledgeThis assignment has 2 partsWhat.docx
Competencies and KnowledgeThis assignment has 2 partsWhat.docxCompetencies and KnowledgeThis assignment has 2 partsWhat.docx
Competencies and KnowledgeThis assignment has 2 partsWhat.docx
 
Competences, Learning Theories and MOOCsRecent Developments.docx
Competences, Learning Theories and MOOCsRecent Developments.docxCompetences, Learning Theories and MOOCsRecent Developments.docx
Competences, Learning Theories and MOOCsRecent Developments.docx
 
Compensation  & Benefits Class 700 words with referencesA stra.docx
Compensation  & Benefits Class 700 words with referencesA stra.docxCompensation  & Benefits Class 700 words with referencesA stra.docx
Compensation  & Benefits Class 700 words with referencesA stra.docx
 
Compensation, Benefits, Reward & Recognition Plan for V..docx
Compensation, Benefits, Reward & Recognition Plan for V..docxCompensation, Benefits, Reward & Recognition Plan for V..docx
Compensation, Benefits, Reward & Recognition Plan for V..docx
 
Compete the following tablesTheoryKey figuresKey concepts o.docx
Compete the following tablesTheoryKey figuresKey concepts o.docxCompete the following tablesTheoryKey figuresKey concepts o.docx
Compete the following tablesTheoryKey figuresKey concepts o.docx
 
Compensation Strategy for Knowledge WorkersTo prepare for this a.docx
Compensation Strategy for Knowledge WorkersTo prepare for this a.docxCompensation Strategy for Knowledge WorkersTo prepare for this a.docx
Compensation Strategy for Knowledge WorkersTo prepare for this a.docx
 

Recently uploaded

IGNOU MSCCFT and PGDCFT Exam Question Pattern: MCFT003 Counselling and Family...
IGNOU MSCCFT and PGDCFT Exam Question Pattern: MCFT003 Counselling and Family...IGNOU MSCCFT and PGDCFT Exam Question Pattern: MCFT003 Counselling and Family...
IGNOU MSCCFT and PGDCFT Exam Question Pattern: MCFT003 Counselling and Family...PsychoTech Services
 
Beyond the EU: DORA and NIS 2 Directive's Global Impact
Beyond the EU: DORA and NIS 2 Directive's Global ImpactBeyond the EU: DORA and NIS 2 Directive's Global Impact
Beyond the EU: DORA and NIS 2 Directive's Global ImpactPECB
 
Russian Escort Service in Delhi 11k Hotel Foreigner Russian Call Girls in Delhi
Russian Escort Service in Delhi 11k Hotel Foreigner Russian Call Girls in DelhiRussian Escort Service in Delhi 11k Hotel Foreigner Russian Call Girls in Delhi
Russian Escort Service in Delhi 11k Hotel Foreigner Russian Call Girls in Delhikauryashika82
 
SOCIAL AND HISTORICAL CONTEXT - LFTVD.pptx
SOCIAL AND HISTORICAL CONTEXT - LFTVD.pptxSOCIAL AND HISTORICAL CONTEXT - LFTVD.pptx
SOCIAL AND HISTORICAL CONTEXT - LFTVD.pptxiammrhaywood
 
Nutritional Needs Presentation - HLTH 104
Nutritional Needs Presentation - HLTH 104Nutritional Needs Presentation - HLTH 104
Nutritional Needs Presentation - HLTH 104misteraugie
 
Class 11th Physics NEET formula sheet pdf
Class 11th Physics NEET formula sheet pdfClass 11th Physics NEET formula sheet pdf
Class 11th Physics NEET formula sheet pdfAyushMahapatra5
 
The Most Excellent Way | 1 Corinthians 13
The Most Excellent Way | 1 Corinthians 13The Most Excellent Way | 1 Corinthians 13
The Most Excellent Way | 1 Corinthians 13Steve Thomason
 
Introduction to Nonprofit Accounting: The Basics
Introduction to Nonprofit Accounting: The BasicsIntroduction to Nonprofit Accounting: The Basics
Introduction to Nonprofit Accounting: The BasicsTechSoup
 
Accessible design: Minimum effort, maximum impact
Accessible design: Minimum effort, maximum impactAccessible design: Minimum effort, maximum impact
Accessible design: Minimum effort, maximum impactdawncurless
 
Web & Social Media Analytics Previous Year Question Paper.pdf
Web & Social Media Analytics Previous Year Question Paper.pdfWeb & Social Media Analytics Previous Year Question Paper.pdf
Web & Social Media Analytics Previous Year Question Paper.pdfJayanti Pande
 
Activity 01 - Artificial Culture (1).pdf
Activity 01 - Artificial Culture (1).pdfActivity 01 - Artificial Culture (1).pdf
Activity 01 - Artificial Culture (1).pdfciinovamais
 
Advanced Views - Calendar View in Odoo 17
Advanced Views - Calendar View in Odoo 17Advanced Views - Calendar View in Odoo 17
Advanced Views - Calendar View in Odoo 17Celine George
 
Key note speaker Neum_Admir Softic_ENG.pdf
Key note speaker Neum_Admir Softic_ENG.pdfKey note speaker Neum_Admir Softic_ENG.pdf
Key note speaker Neum_Admir Softic_ENG.pdfAdmir Softic
 
Q4-W6-Restating Informational Text Grade 3
Q4-W6-Restating Informational Text Grade 3Q4-W6-Restating Informational Text Grade 3
Q4-W6-Restating Informational Text Grade 3JemimahLaneBuaron
 
Explore beautiful and ugly buildings. Mathematics helps us create beautiful d...
Explore beautiful and ugly buildings. Mathematics helps us create beautiful d...Explore beautiful and ugly buildings. Mathematics helps us create beautiful d...
Explore beautiful and ugly buildings. Mathematics helps us create beautiful d...christianmathematics
 
Sanyam Choudhary Chemistry practical.pdf
Sanyam Choudhary Chemistry practical.pdfSanyam Choudhary Chemistry practical.pdf
Sanyam Choudhary Chemistry practical.pdfsanyamsingh5019
 
1029 - Danh muc Sach Giao Khoa 10 . pdf
1029 -  Danh muc Sach Giao Khoa 10 . pdf1029 -  Danh muc Sach Giao Khoa 10 . pdf
1029 - Danh muc Sach Giao Khoa 10 . pdfQucHHunhnh
 

Recently uploaded (20)

IGNOU MSCCFT and PGDCFT Exam Question Pattern: MCFT003 Counselling and Family...
IGNOU MSCCFT and PGDCFT Exam Question Pattern: MCFT003 Counselling and Family...IGNOU MSCCFT and PGDCFT Exam Question Pattern: MCFT003 Counselling and Family...
IGNOU MSCCFT and PGDCFT Exam Question Pattern: MCFT003 Counselling and Family...
 
INDIA QUIZ 2024 RLAC DELHI UNIVERSITY.pptx
INDIA QUIZ 2024 RLAC DELHI UNIVERSITY.pptxINDIA QUIZ 2024 RLAC DELHI UNIVERSITY.pptx
INDIA QUIZ 2024 RLAC DELHI UNIVERSITY.pptx
 
Beyond the EU: DORA and NIS 2 Directive's Global Impact
Beyond the EU: DORA and NIS 2 Directive's Global ImpactBeyond the EU: DORA and NIS 2 Directive's Global Impact
Beyond the EU: DORA and NIS 2 Directive's Global Impact
 
Russian Escort Service in Delhi 11k Hotel Foreigner Russian Call Girls in Delhi
Russian Escort Service in Delhi 11k Hotel Foreigner Russian Call Girls in DelhiRussian Escort Service in Delhi 11k Hotel Foreigner Russian Call Girls in Delhi
Russian Escort Service in Delhi 11k Hotel Foreigner Russian Call Girls in Delhi
 
SOCIAL AND HISTORICAL CONTEXT - LFTVD.pptx
SOCIAL AND HISTORICAL CONTEXT - LFTVD.pptxSOCIAL AND HISTORICAL CONTEXT - LFTVD.pptx
SOCIAL AND HISTORICAL CONTEXT - LFTVD.pptx
 
Nutritional Needs Presentation - HLTH 104
Nutritional Needs Presentation - HLTH 104Nutritional Needs Presentation - HLTH 104
Nutritional Needs Presentation - HLTH 104
 
Class 11th Physics NEET formula sheet pdf
Class 11th Physics NEET formula sheet pdfClass 11th Physics NEET formula sheet pdf
Class 11th Physics NEET formula sheet pdf
 
The Most Excellent Way | 1 Corinthians 13
The Most Excellent Way | 1 Corinthians 13The Most Excellent Way | 1 Corinthians 13
The Most Excellent Way | 1 Corinthians 13
 
Introduction to Nonprofit Accounting: The Basics
Introduction to Nonprofit Accounting: The BasicsIntroduction to Nonprofit Accounting: The Basics
Introduction to Nonprofit Accounting: The Basics
 
Accessible design: Minimum effort, maximum impact
Accessible design: Minimum effort, maximum impactAccessible design: Minimum effort, maximum impact
Accessible design: Minimum effort, maximum impact
 
Web & Social Media Analytics Previous Year Question Paper.pdf
Web & Social Media Analytics Previous Year Question Paper.pdfWeb & Social Media Analytics Previous Year Question Paper.pdf
Web & Social Media Analytics Previous Year Question Paper.pdf
 
Activity 01 - Artificial Culture (1).pdf
Activity 01 - Artificial Culture (1).pdfActivity 01 - Artificial Culture (1).pdf
Activity 01 - Artificial Culture (1).pdf
 
Mattingly "AI & Prompt Design: Structured Data, Assistants, & RAG"
Mattingly "AI & Prompt Design: Structured Data, Assistants, & RAG"Mattingly "AI & Prompt Design: Structured Data, Assistants, & RAG"
Mattingly "AI & Prompt Design: Structured Data, Assistants, & RAG"
 
Advanced Views - Calendar View in Odoo 17
Advanced Views - Calendar View in Odoo 17Advanced Views - Calendar View in Odoo 17
Advanced Views - Calendar View in Odoo 17
 
Key note speaker Neum_Admir Softic_ENG.pdf
Key note speaker Neum_Admir Softic_ENG.pdfKey note speaker Neum_Admir Softic_ENG.pdf
Key note speaker Neum_Admir Softic_ENG.pdf
 
Q4-W6-Restating Informational Text Grade 3
Q4-W6-Restating Informational Text Grade 3Q4-W6-Restating Informational Text Grade 3
Q4-W6-Restating Informational Text Grade 3
 
Explore beautiful and ugly buildings. Mathematics helps us create beautiful d...
Explore beautiful and ugly buildings. Mathematics helps us create beautiful d...Explore beautiful and ugly buildings. Mathematics helps us create beautiful d...
Explore beautiful and ugly buildings. Mathematics helps us create beautiful d...
 
Sanyam Choudhary Chemistry practical.pdf
Sanyam Choudhary Chemistry practical.pdfSanyam Choudhary Chemistry practical.pdf
Sanyam Choudhary Chemistry practical.pdf
 
1029 - Danh muc Sach Giao Khoa 10 . pdf
1029 -  Danh muc Sach Giao Khoa 10 . pdf1029 -  Danh muc Sach Giao Khoa 10 . pdf
1029 - Danh muc Sach Giao Khoa 10 . pdf
 
Código Creativo y Arte de Software | Unidad 1
Código Creativo y Arte de Software | Unidad 1Código Creativo y Arte de Software | Unidad 1
Código Creativo y Arte de Software | Unidad 1
 

Abstract This paper explores the team-based decisions througho.docx

  • 1. Abstract This paper explores the team-based decisions throughout the Pharmasim marketing simulator program. The simulator was segmented into eight periods each consisting of one year at a pharmaceutical company for an over-the-counter cold medicine (OCM). As the team progressed through the simulation program, the team made decisions as to the manufacturer’s suggested retail price, volume discounts, and promotional allowances. Options were considered for the advertising budget as to the best choice for each product line, and an advertising agency selected for each. The relative emphasis on the four types of advertising messages is herein discussed as well as the teams’ promotion budget with allocations to cooperative advertising and the three types of consumer promotions. Finally, the sales force decisions, segmentation, line extensions and the influence of these decisions on the cumulative net income and final stock price discussed. Inferences were made throughout the simulation program as to causation and the team strategically managed outcomes through manipulating the allocations for the aforementioned variables to arrive at the desired goals.
  • 2. Allround Brand Management Final Report – Group B The brand management team report describes the organizational conditions and external factors that influenced its decisions and the results acquired at the end of each period. Also, the team shares the individual and team learning experience earned through this process and its contrast to the Initial Strategy Plan. The initial strategy plan was identified as the main issue complicating out decisions. To address that, the team evolved the initial marketing strategy which focused heavily on increasing net income and stock prices and instead focused on strategies of differentiation to meet and exceed customer preferences. This adjustment aligned the team’s decisions with choices that were profitable for the company, as customers perceived a greater value in the products and the company sold an increasing number of units with each period progression. The information herein highlights this evolution as well as offers predictions as to what would have happened had there been advancement to period nine. Manufacturer’s Suggested Retail Price Customers rarely concern themselves with the costs that a company incurs to produce a given product, for them it is the value of the product or service that it provides and how well their experience has been (Winer & Dhar, 2011, pp. 247). When we initially started in period zero, we decided to leave the price of Allround alone. The case study pointed out that during this period Allround's suggested retail price was higher than the competition but was not suffering in sales because of the effectiveness, high recognition, and consumer loyalty (James, Kinnear & Deighan, 2015). These elements combined allowed Allround to dominate and maintain price leadership in the
  • 3. market. We also felt that Allround was in a different market space relative to its competitors. The focus moved to other marketing operations. Throughout the following three periods we used that mindset to drive our decisions about pricing, which differed from our initial strategy report but became a sound strategy. During period four, there was no budget available to spend on marketing decisions. The assumption developed that all of the budgeted funds were spent on the capacity utilization expenditure, which was 24% over. Compared to competitors, Allround’s stock price was average; however, its capacity utilization was 20% higher than Allround’s biggest competitor, B&B which led to the examination of price inflation throughout the periods that had passed. Period four marked the beginning of the repeated analysis of and consideration for inflation. In efforts to level and stabilize pricing and utilization, the inflation rate of 4.1% was doubled, and Allround’s price rose to $5.77. In period five, efforts were successful in cutting down capacity utilization by 25%, increasing net income, and increasing the stock price. From period five to seven the price of Allround was raised each period to avoid the same pitfall. Reports were purchased to assess and adjust for market trends including competitor's pricing, inflation, and consumer preferences from the conjoint analysis to help gauge our customer's pricing sensitivity. The MSRP of Allround successfully rose to $6.11 by the end of period seven. Period three saw the introduction of Allround+, and the MSRP was set at $5.01. This price point was arrived at due to the uniqueness of the product, and formula comparisons suggested that the price was a good starting point from which we could later adjust if need be. During period four, inflation was accommodated for with price increases for Allround and Allround+ of Allround+. From period five to period seven we slowly increased the price to stay competitive and combat capacity utilization. Period seven ended with the price of Allround+ being $5.89. In period five, Allright was introduced
  • 4. to the market. This formulation was a four-hour, non-drowsy allergy medication which was the first-to-market. From the data reports, it was known that consumers showed a preference for fewer side effects and the preference to avoid over- medicating (James, et al., 2015). For these reasons, together with the cost of production per unit, the price was set at $5.95. During period six it was opted to not to increase the price of Allright as our brand awareness for the drug was only 17.4%. Instead, other areas continued to be focused on to improve brand awareness - such as promotions. In period seven, the price was raised to $6.12 to be reflective of competition and inflation. Had there been a period nine, inflation, consumer price preferences and cost would continue to influence the MSRP. However, it was agreed that more emphasis would be on these factors that had been placed on them during periods zero through eight. Discounts and Allowances Volume Discounts Volume discounts for the Allround, Allround+, and Allright brand remained consistent for the first five periods. In period five however, volume discounts were reduced from 25% to 22% for quantities between 250 and 2500. Volume discounts offered were too high and the decrease was made to drive sales to other volume categories for Allound. The volume discounts were then continued at the new 22% rate through the final period. Providing volume discounts to retailers based on quantity purchased incentivizes retailers to carry and stock the product. However, providing too high of a discount causes a loss of profits for the manufacturer and is not reflective of the same rate of benefits as smaller volume discounts. Had there been a period nine, it would be expected that the same strategy for volume discounts would be followed, as the initial discount rate reduced the potential profits for the company.
  • 5. Allowances As stated in our initial strategy report our plan was to use a push/ pull strategy to increase sales. "Trade promotions can be best understood as part of an overall channel management strategy based on an accurate perception of both market power and the relative power of the channel participants" (Kasulis, Morgan, Griffith & Kenderdine, 1999). To achieve this, starting in period one, all category allowances were set to 17%, to arrive at some consistency, as the team became more familiar with the effects of decisions made. Allowances were matched for each of the product line allowance categories because allowances were the most poorly understood tool throughout the simulation. The choices that were arrived at were made to gain an advantage from offering higher than the competitor’s average promotional allowances. “Retailers or other distributors want to be assured that you will spend sufficient money and pay attention to persuading the customers to want your brand. These two activities draw an important distinction between two kinds of basic activities of channel management: push(getting channels to carry and sell the product) and pull(motivating customers to ask for your brand by name)” (Winer & Dhar, 2015). During period three, the promotional allowances were decreased for independent drugstores and convenience stores as the discounts were not the best manner for stimulating these channels as demonstrated by poor performance compared with other distribution channels.With the introduction of Allright in period five, all distribution channel allowances increased to 20%. That decision was carried through to period eight where it was found again, that the higher promotional allowances were not as beneficial to the results as had been expected. Promotional allowances were reduced by 2% across the board which still allow for the highest allocation among
  • 6. competitors while also being of more significant benefit to the company by increasing the net income. Had there been a period nine, efforts would continue to have competitive allowances which also maximize the return for the company as the group continued to gain and better understand leverage with allowance manipulations. Advertising Budget The initial advertising budget for Allstar brands' Allround 4- hour multi-symptom cold & cough medication started at $20 million. However, the market update during the introductory period showed a $3.3 million increase in advertising spending (James, et al., 2015). Therefore, we determined that the Allround advertising budget should be increased to $23.1 million, as it was important to stimulate brand awareness and have aggressive advertising campaigns to maintain a market share (Kerin, Hartley, & Rudelius, 2011, pp. 486). During the first and second periods, the market update showed a $20.8 million and $11.3 million increase for each respective period. The marketing team determined that Allround’s advertising budget was amongst the highest during these periods and gave a small increase to $27.1 million during the first period with no additional adjustment during the second period as funds were allocated to other areas of the company (i.e. sales force & promotional discounts). The third period provided the opportunity for a product introduction of Allround+, as 12-hour multi-symptom liquid medication. To accommodate this new product line the team decreased the Allround advertising budget to $20 million despite an $18.5 million increase in advertising spend according to the market update as we were trying to keep overhead costs down. Therefore, Allround+ was provided a smaller initial advertising budget of $8 million during this period. The fourth period showed a $4.9 million decline in advertising spend, however, the marketing team decided to keep the advertising budget steady at $20 million for Allround and $8 million for Allround+ (James, et al., 2015). During the fifth period, advertising spending was up by $13.5
  • 7. million, and Allstar introduced their third product Allright, a 4- hour non-drowsy allergy medication (James, et al., 2015). With the introduction of Allright, the Allround+ budget was slightly decreased to $6 million in their advertising budget, which was contributed to performance and the need to allocate funds towards Allright’s initial budget of $10 million. The initial advertising budget of Allright was set at a higher amount than Allround+ to help with brand awareness during the introduction period. Otherwise, no changes were made to Allround during this period due to its excellent performance in the market. The sixth period showed an increase of $5.4 million in advertising spending, so Allround+ and Allright's advertising budgets were increased to $7 million and $12 million respectively to better match the competition. The Allround budget saw no changes during this period and stayed at $20 million (James, et al., 2015). Although the seventh period’s market updates showed a $5.3 million increase in advertising spending, no changes were made to either the Allround+ or Allright budgets due to steady performance. However, Allround’s budget had a slight increase to $22 million in retaliation to a rise in the Allround's primary competitor’s advertising budget, which the marketing team felt was necessary to maintain market share. The eighth and final period showed an increase of $4.2 million in advertising spending; however, Allstar's marketing team determined that all budgets were appropriate and made no changes. The same thought process would be applied to all products for a ninth period if it existed, so long as the advertising spend of competitors continued to incremental increases (James, et al., 2015). Selected Advertising Agency Brand awareness is the cornerstone of any product’s success; therefore, the selection of an advertising agency is as equally important as the advertising budget provided for a given product. The Allstar brands marketing team had three advertising agencies to choose from, Brewster, Maxwell, &
  • 8. Wheeler (BMW) who charged a 15% commission for their services; Sully & Rogers (S&R), who cost a 10% commission; and Lester, Loebol, and Company (LLC), who charged a 5% commission for their services (James, et al., 2015). It is crucial that a product gains some market share during the introductory period, which is why the Allstar marketing team thought it was important that their products be perceived as the superior brand (Winer & Dhar, 2011, pp. 56). Additionally, it is crucial to select the right advertising agency that has a track record in promoting similar products and promoting to the target audiences for those products (Kerin, Hartley, & Rudelius, 2011, pp. 489). Therefore, the marketing team selected BMW for Allround in this introductory period, as they were perceived to be a superior agency for this market. During the first period, Allround managed to obtain 23.7% of the market, and in the second period, it decreased slightly to 22.5%. The subsequent periods maintained a similar amount with little variance; therefore, the marketing team stayed consistent in keeping Allround's advertising with the BMW agency since the product performance had done well in market surveys. During the third period, Allstar introduced Allround+ and the marketing team utilized the BMW agency again, in the hopes that this product's performance would be similar to that of Allround. However, this strategy did not perform as planned, so a switch to S&R was made for Allround+ to reduce some of the overhead expenses for Allstar during the fifth period since the market share was at 3.2%. This change resulted in an increase to 4.1% in the sixth period and 4.7% in the seventh period. Therefore, the market team kept Allround+ with S&R to maintain the incremental growth that was seen in the market share (James, et al., 2015). During the fifth period, Allstar introduced another product line Allright, which was given to the BMW advertising agency for promotion in the hopes that this product would corner the allergy medication market due to it being the only non-drowsy option available. The channel sales report showed a 2% market
  • 9. share during its introductory period; however, this almost doubled to 3.7% during the seventh period. So the team kept Allright with BMW throughout these final periods and would have made no changes during the ninth period (had it existed), as long as the performance continued to maintain as it did (James, et al., 2015). Relative Emphasis on the Four Types of Advertising Messages The emphasis that was put on the advertising message was driven by the stage of the product’s life cycle and the strategic objective, both of which had to be reassessed throughout the simulation. Primary advertising messages were used to create awareness, benefits to highlight the value of the product function, comparison to showcase our product against our chosen competitor and the reminder to bolster awareness after the consumer was made aware of the product's primary features and benefits (James, et al., 2015). Posttests measuring brand awareness gauged the effectiveness of primary advertising messages, and the percentage of increase or decline in unit sales for the line was used to guide messaging efforts (Pride & Ferrell, 2014). With the introduction of line extensions, the strategy was to drive awareness with primary messages at 40% for the first period for Allround+ and 30% for Allright. Allright’s stress on primary messaging was lower than Allround+ due to the uniqueness of the product where the team was comfortable putting equal importance on benefit at 30%, and a healthy 30% was allocated to reminder to stimulate repurchase for the year that exists within each period. This success was measured with brand awareness ratings. In period zero, Allround had 74.1% brand awareness, and the decision was made to focus on stimulating repurchase, which was appropriate for Allround’s period in the life cycle. By period seven Allround comfortably rested with 10%, 20%, 30% and 40% allocated to primary, benefits, comparison, and reminder, respectfully. Adjustments were made to Allround's advertising message for period eight because an expectorant was
  • 10. added to Allround, where benefits were increased to 22% to promote this reformulation. Allround+ was introduced in period four, and advertising messages were allocated with 40% to primary, 40% to benefits, 10% to comparison with Besthelp and 10% to reminder to stimulate repurchase during the one year to follow (James, et al., 2015). The reasoning for this allocation was to create awareness for the product as it enters the first stage of the product life cycle (Perreault Jr, Cannon & McCarthy, 2014) and to emphasize its benefits. The allotments were kept the same for period five and for period six they were adjusted so that 15% was set to primary awareness, 35% for benefits, 30% for comparison with Dryup and 20% for reminder messages. ThisThese changes were made because awareness had grown to 55.3% and Dryup appeared to be a good comparison as the brand formulations were quite similar (James, et al., 2015). The advertising benefits were shifted from primary to remind as awareness was high and stimulating repurchasing was needed to maintain sales. These allocations were maintained through period 7. In period eight, even greater emphasis was to be on repurchase, and therefore reminder was increased to 25%. The comparison product was also changed to Extra as it was decided that comparing Allround+ to another 12-hour OCM capsule was a sounder strategy. The introduction of Allright was very similar and the product launch started with 30% primary, 30% benefits, 10% comparison and 30% reminder. The high reminder was favored despite being the launch of Allright because of the product’s uniqueness and the fact that each period was one year where it was hoped to capture some repurchases during that time. In periods seven and eight Allright’s customer satisfaction increased to 51.2% (James, et al., 2015) and this highlighted the importance of stimulating repurchasing. Our brand awareness was low at 23.2%, and the decision was made to equally address the areas of advertising with 25% allocated to each advertising message.
  • 11. Should the simulation have progressed to period nine, it is reasonable to expect to see a similar pattern where with the continued need to assess the performance indicators before making decisions as to the best allocation for advertising messages. Promotional Budget with Allocations and the Three Types of Consumer Promotions, Point of Purchase and Co-op Advertising Consumer promotions included point of purchase, trial size promotional products, and coupons. To increase sales in period four, we expanded our point of purchase budget from $1.7 million to $3 million. Point of purchase money is paid to the retailer but targets the end consumer. By increasing this budget, we were able to promote our products with display racks, sales rack, on-shelf advertisements and securing better product placement. Also, a greater emphasis focused on increasing the co-op advertising budget to help retailers promote Allround, Allround+ and Allright products to improve awareness through the different distribution channels. At the beginning of the stimulation no funds had been allocated to trial size promotion allowance, and the trial size budget was set to allocating $700,000. The goal of trial size promotions is to attract potential new consumers to the Allround brand. We realized after period zero that we should focus our promotional budget on other areas as trial sizes were of the most benefit for new products and decreased the budget to $500,000 until period three and period five when Allround+ and Allright formulations were released. Coupons The team over budgeted for coupons, allocating 4.9 million dollars for the first two periods and then dropping it to 4.7 million until period four. The high budget for coupons intended to stimulate repurchase; however coupons were misused. Coupons are an area of consumer promotion that can be used to achieve different goals. "Coupons are an effective way to target discounts and other incentives to households that are
  • 12. particularly sensitive to price” (Winer & Dhar, 2011). The strategy when changing the coupon budget was to stimulate repurchase or to stimulate the initial purchase when there were brand extensions and reformulations. Had there been a period nine, a more conservative coupon strategy would help in keeping costs low. Sales Force There is no single best strategy to manage the sales force of a company because of the varying circumstances and consumer reaction in the market space, but research has shown that a larger sales force can have a positive benefit (Dalrymple & Thorelli, 1984). The group understood the benefit of giving support to the different distribution channels to dominate the market, stay competitive, and maintain brand awareness. A combination of reports from the sales report, sale force, channel sales, and shelf space reports were used to drive and support our decisions on staff allocation. In period zero comparisons were made among competitors and channels to discern points of sales and the percentage of total sales. This data was then used to adjust the sales force according to that data. Overall we increased the sales force in each channel to capitalize on supporting brand awareness, shopping habits and maintain our market presence. In period one the importance of channels such as detailers and mass merchandisers was identified. The heavy focus on the sales force at the beginning of the stimulation led to the realization in period three that a large part of the marketing budget was being spent on the sales force and needed to either be reduced or at least frozen. The decision was made to freeze the total staff number, which was justified by acknowledging the possibility to allocate some of the sales force to the second product line, Allround+. During periods four through seven, staffing numbers stabilized which suggested that the company was within a range that continued to support the growth of the company, while also allowing the continuation of the company to dominate the market and successfully manage the budget.
  • 13. Throughout these periods, resources were reallocated to different channels and were compared against the competition. Competitors were used as an indicator as to whether staffing changes were necessary and this helped to gauge spending as well. Throughout the stimulation top performers such as grocery stores, drugstores, and wholesalers received heavier allocations of staffing. Had there been a period nine, competitors would continue to be monitored for staffing changes as Allstar looked to keep costs down by not overstaffing. Segmentation Initially, the group planned on targeting the population between 18-30 years of age. The idea behind this strategy was because the targeted population was technically savvy and could be in a financial situation where they were more inclined to go with over-the-counter medications rather than prescription medication. Infiniti Research (2018) makes similar conclusions when it comes to market segmentation because companies need to successfully market to segments that have spending power, which the group determined the 18 to 30-year-old group would have. The group adopted this strategy early in the simulation. In period two, the group removed empty nesters and retired individuals from demographic targets due to their low usage of the Allstar. However, Allstar saw declined sales between periods two and three. Due to this, the group decided to add empty nesters and retired individuals back into the targeted demographics for the remainder of the simulation to increase the brands market share. With the introduction of Allround+, the decision was made to market the product to all demographics, which was sound as the product was in the introductory phase of the product life cycle. Winer & Dhar (2016) note that during the initial period of the product life cycle, a product is new and companies are attempting to establish the product in the marketplace. Therefore, by marketing Allround+ to all marketing segments, the company would be able to produce the most significant
  • 14. amount of initial market penetration. The same decision was also made to market to all segments for the group's third product, Allright. For future weeks, the market segmentation would have stayed the same because, throughout the simulation, there was a steady increase in both stock price as well as income. Additionally, successful market segmentation caused sustained share of manufacture sales for Allround as well as continued growth for both Allround+ and Allright. Line Extensions The market for Allround had matured where there was little differentiation among brands, aggressive promotion and price dealing (Perreault Jr, et al., 2014). This created a need to differentiate through new product lines and the team introduced Allround+, a 12-hour OCM in period four and Allright, a four hour non-drowsy allergy capsule, in period six. Increasing value and differentiation gave successful results as seen by the increased market shares of and differentiating our line to meet the needs and preferences of the various segments within the market became part of our strategy. It was understood that Allround+ would be competing with our original Allround 4-hour formula, and a percentage of the market for Allround decreased each period after the introduction of Allround+. However, Allround+ was also increasing in its share of retail sales at a rate higher than Allround was declining in the share of retail sales (James, et al., 2015). We saw this continue through periods five through eight. We interpreted this result as Allround+ gaining organic customers or those from other products as opposed to cannibalizing them all from Allround. This encouraged us to continue with the Allround+ line, and we would have likely done so into period nine, if that had been an option. Allstar was the first company to get to market with a non- drowsy OCM for allergies, which gave us a competitive advantage. Customers showed preferences for fewer side effects and concern for over medicating (James, et al., 2015). We saw a
  • 15. strong satisfaction rating of 54.2% in our first period with Allright (James, et al., 2015), which shows good value for one of our key performance indicators. This satisfaction rating stayed above 51% for the remainder of periods seven and eight (James, et al., 2015). Both of our line extensions were not cost effective when they were first introduced, but that is expected of new products (Winer & Dhar, 2015) and therefore did not cause alarm. Should there have been a period nine, continued growth and threat of entry would be expected with the Allright product. Cumulative Net Income throughout the Simulation and Final Stock Price Cumulative net income and stock price were essential factors throughout the simulation. Since all decisions made during the simulation directly affected both of these metrics, careful consideration was required to maintain consistent, positive growth for both numbers throughout the course of the simulation. The impact of marketing decisions on both cumulative net income and stock price has real-world applications, as noted by Kumar & Shah (2009). Kumar & Shar (2009) point out by successfully marketing to consumers with large consumer equity, a company can drive stock price in a positive direction. At the beginning of the simulation, Allround was a market leader in its segment and in the maturity phase of the product life cycle as referenced by Winer & Dhar (2016). Since the maturity phase is categorized by a product being well known in the marketplace with a flattening sales curve, marketing decisions were made to ensure that Allround was stable and kept steady sales. This was accomplished through conservative changes in both sales force distribution as well as minimizing reformulations throughout the simulation. This conservative approach contrasted with a more aggressive marketing strategy for the other two products released throughout the simulation in terms of budgeting of sales force and marketing versus spending of competitors the products were in direct competition
  • 16. with. The reasoning behind the aggressive marketing for the new products was to ensure an immediate entry into the market with the goal of having a rapid growth in market share. While the group was ultimately successful in raising both cumulative net income and stock price to $960.3 million and $141.43 respectively, there were lessons learned throughout the simulation. The group’s stock price and net income did not grow as rapidly as intended throughout the first half of the simulation. Retail price was not increased in the beginning to keep pace with inflation. Additionally, the group’s gross margin increased too much during the first half of the simulation. Both of these factors caused overproduction to occur. To counteract this, the group successfully brought spending in line and managed prices correctly to bring production levels to a profitable level. References Dalrymple, D. J., & Thorelli, H. B. (1984). Sales force budgeting. Business Horizons, 27(4), 31- 36. doi:10.1016/0007-6813(84)90054-5 Infiniti Research. (10 October, 2018). 5 Essential Criteria for Developing a Target Market Segmentation Strategy - An Infiniti Research Case Study on the Healthy Drinks Segment. Business Wire (English). Retrieved from https://saintleo.idm.oclc. org/login?url=http://search.ebscohost.com/login.aspx?direct=tru e&db=bwh&AN=bizwire.c86618407&site=ehost- live&scope=site James, S., Kinnear, T., & Deighan, M. (2015). PharmaSim The Marketing Management Simulation. Interpretive Simulations. Charlottesville, VA. Kasulis, J. J., Morgan, F. W., Griffith, D. E., & Kenderdine, J. M. (1999). Managing trade promotions in the context of market power. Journal of the Academy of Marketing Science, 27(3), 320-332. Retrieved
  • 17. from https://saintleo.idm.oclc.org/login?url=https://search- proquest- com.saintleo.idm.oclc.org/docview/224877874?accountid=4870 Kumar, V., & Shah, D. (2009). Expanding the Role of Marketing: From Customer Equity to Market Capitalization. Journal of Marketing, 73(6), 119–136. https://doi-org.saintleo.idm.oclc.org/10.1509/jmkg.73.6.119 Perreault Jr., Cannon, J. P., & McCarthy, E. J. (2014). Basic marketing: A marketing strategy planning approach (19th ed.). New York: McGraw Hill/Irwin Pride, W. M. & Ferrell, O. C. (2014). Marketing. Mason, Ohio: South-Western, Cengage Learning Winer, R. S. and Dhar, R. (2016). Marketing management (4th ed.). Boston, MA: Pearson Learning Solution s. Winer, R., & Dhar, R. (2011). Marketing Management (4th ed.). Harlow, Essex: Pearson.
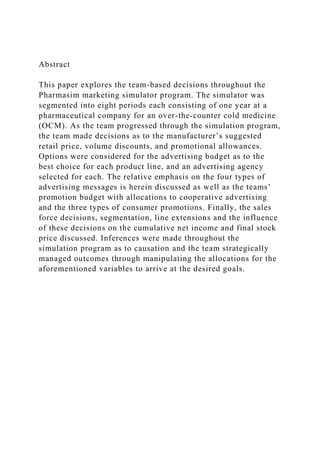
  • 18. APPENDIX A Pharmasim Period by Period Performance Summary and Interpretation Figure 1Net income over the eight periods of the simulation. Reproduced from James, Kinnear & Deighan, 2015.
  • 19. Figure 2Stock price for the eight periods of the simulation. Reproduced from James, et al., 2015. Figure 3Pharmasim performance summary for period zero. Reproduced from James, et al., 2015. Period zero allowed the group to familiarize themselves with the current standing of Allround and assess how to manipulate starting figures and monies as seen in Figure 3 in order to achieve the goals set out in the initial strategy report (see
  • 20. Appendix B). Figure 4Pharmasim performance summary for period one. Reproduced from James, et al., 2015. In period one, slight changes were made so that the market response to our decisions could be observed. In this period, an overall advertising budget of around $23.1 million was allocated for Allround, and BMW advertising agency was selected for advertising, as seen in Figure 4. The purpose of these decisions was to present the company as a brand offering quality products of high value. As a result of the decision in this period, there was an increase in net income from $67million to $80 million and a stock price increase from $38 to $48. Figure 5Pharmasim performance summary for period two. Reproduced from James, et al., 2015. In period two, it was decided to increase the sales force allocation of chain drug stores, grocery stores, and wholesaler support. The price and discounts were kept constant to examine any effect this would have on the net income. There was an incident this period about quality assurance, and it was decided to dispose of the expiring batch with a decision cost of $100,000 to avoid the risk of damage to the brand image. These
  • 21. choices led to a slight increase in the net income and stock price as seen in Figure 5. Figure 6Pharmasim performance summary for period three. Reproduced from James, et al., 2015. In period three, sales force spending was again increased, while the budget for advertising was decreased to 53.3% of the total budget. The price and discounts were kept at the same level. This period generated an incident of cannibalization, meaning that the sale of one product is decreasing the sales of another product. The decision was made to introduce the 12-hour multi- capsule. The decisions at this period were not optimal as the company experienced a decline in the net income and the stock price as seen in Figure 6. This may be because fixed costs were increased and the MSRP was not adjusted for inflation. Figure 7Pharmasim performance summary for period four. Reproduced from James, et al., 2015. In period four, it was decided that the budget allocations ought to be reassessed and reallocated to optimize the benefits of where the budget is being spent. Part of this assessment and reallocation included the decrease of the advertising budget for
  • 22. Allround from $27.1 million to $20 million and reallocating those monies together with an additional $0.9 million towards the advertising budget for the new product line, Allround+. BMW advertising agency was kept for both product lines. To aid in launching the new line extension Allround+, the promotion budget for this product was initially set higher than Allround, particularly with trial sizes as seen in Figure 7. These decisions lead to a positive change in net income and stock price. Figure 8Pharmasim performance summary for period five. Reproduced from James, et al., 2015. In the period five, the overutilization of capacity was addressed as operations were at 124.7% of the capacity as seen in Figure 8. Knowing the impact of such utilization, it was expected to negatively impact the net income if not addressed. Therefore, it was decided to increase the price to decrease the number of units produced and sold. As a result of the price increase, the net income experienced a solid increase to $116 million; utilization came down to 99.5%. Furthermore, these changes translated into an increase in stock price to $76.16. Figure 9Pharmasim performance summary for period six. Reproduced from James, et al., 2015.
  • 23. For period six, the price of Allround was kept at $5.77, and the price for Allround+ was increased from $5.18 to $5.35. In comparison to Allround, Allround+ was performing poorly for the amount that was invested in the product’s advertising and promotion as seen in Figure 9. Without being able to come to a consensus and to increase the efficiency of the advertising budget, the advertising agency for Allround+ was changed to S&R advertising agency, and the advertising budget was decreased by $2 million. In addition, a new product line called Allright was introduced. The MSRP was set at $5.95 and $10 million was allocated for this product’s advertising budget. The decisions made during this period generated an increase of net income to $127 million and a stock price increase to $99.09. Figure 10Pharmasim performance summary for period seven. Reproduced from James, et al., 2015. In period seven, the price was increased conservatively for three of the products to adjust for inflation, while keeping the discounts brackets the same. The advertising budget was also increased for Allright and Allround+ while keeping the budget for Allround the same. As for the promotion strategy, we tried to balance the budget for all three products. These decisions lead to a further increase in net income to $150 and a further
  • 24. increase in stock price to $123.76 as seen in Figure 10. Figure 11Pharmasim performance summary for period eight. Reproduced from James, et al., 2015. For the period eight, the prices for Allround and Allright were increased, while keeping the discount levels the same with the intention of improving the gross margins. An increase of 10% was added to the adverting budget for Allround and the other two products remained as they were in period seven. During this period, the incident of product tampering was addressed. In dealing with this incident, a statement of sympathy was issued for the victims; all damaged products were removed from the shelves at the cost of $100,000 and compensation was offered to victims at the cost of $500,000. Despite these additional costs, the decisions for this period generated a net income increase to $170 and a stock price increase to $141.43 as seen in Figure 11. Overall, the firm managed to create an average stock increase of around 18% for each of the eight periods, which can be considered as a solid return for the investors.
  • 25. APPENDIX B Allstar Brand Initial Strategy Report Allstar Brand Initial Strategy Report Group B: Andrew Carroll, Kelly Decker, Kerline Desir, Abigail Espeut, Alexander Fullerton, Diane Giewat & Vince Hamm Saint Leo University MBA 565 James Womick
  • 26. Student Signature: [Andrew Carroll, Kelly Decker, Kerline Desir, Abigail Espeut, Alexander Fullerton, Diane Giewat & Vince Hamm] Allstar Brands Corporation was founded in 1924 and since then has acquired smaller packaged good companies making it one of the leading manufacturers in the world. The Pharmaceuticals Division of the company has made Allstar Brand’s Allround a critical element in the future success of the company. Allround is a market leader in over-the-counter cold and allergy medications. To meet the expectations of the division and participate in the innovation and future success of the company, Allround’s product line will need to develop a strategy that aids in the decision-making process. This process and plan will support the growth needed to increase cash flows, the presence required to maintain a competitive advantage, and the customer
  • 27. service needed to build long-lasting relationships with consumers. Allround brand produces a four-hour liquid cold medicine that provides a multi-symptom relief; this relief comes from a formula that includes an analgesic, an antihistamine, a decongestant, a cough suppressant, and alcohol. Each of these ingredients focuses on a specific type of ailment: analgesics provide pain relief, antihistamines reduce secretions from nose and eyes, decongestants reduce nasal congestion, cough suppressants reduce the cough reflex, and alcohol provides a base for the other ingredients and helps a person recuperate. This is important because these ingredients give Allround brand a foundation for the type of consumers they want to serve, people who are experiencing one or more of these symptoms and are willing to try an over-the-counter remedy. The targeted group will be a younger population of 18-30 years of age because they more aware of drug uses, looking for a one pill fix, technologically savvy, not afraid to research treatment options, and can be struggling financially or have no medical insurance leading to the inclination to try over-the-counter medication (OCM). Allstar’s longevity, global sales, economies of scale and experience curve are the foundation for its competitive advantage. It is a trusted household name, having been manufacturing household products since 1924 (James, Kinnear
  • 28. & Deighan, 2014). When it comes to over-the-counter medication, brand recognition can be a key determinant in consumer purchasing decisions. Allround’s short term competitive advantage will focus on differentiation and its long- term competitive advantage will be supported by operational effectiveness and adaptability. To gain a short-term competitive advantage, Allround will employ value-adding practices. These practices will be realized though adding the perception of greater value by utilizing comparative marketing measures, which highlight that Allround does in one bottle what competitors do in several competing formulas from different brands. “Why fuss with all the clutter of multiple bottles when you can get the relief that you’re looking for with just one trusted (name)’ will be a message that we portray to consumers to help add value to the Allround formula. The appropriateness of this will be revisited with each term and/or when new formulas and revisions are being considered. Given that our target consumers are looking for convenient and less expensive products, having two or more product features/benefits fused into one can be a major advantage for our sales. Price point is important and must be taken into consideration with perceived value. When consumers perceive products as being equal with all other attributes, price becomes the primary consideration in the purchase decision (Winer, 2016).
  • 29. Allround’s manufacturer's suggested retail price (MSRP) point of $5.29 is not the highest among competing brands with high market share manufacturers such as Coughcure at $5.49 and End at $5.29 with 63.6% and 46.3% of the OCM market share respectively (James, et al., 2014). Coughcure and End, having comparable prices but limited formulations and limited product benefits, allow for Allround to have competitive leverage with comparative marketing and therefore is not considering a change in MSRP. Economies of scale state that Allstar’s global position will help to reduce costs of production for Allround through large-scale operations and Allstar’s experience curve will help to keep costs of production low through learned innovative measures and time spent streamlining the process (Winer, et al. 2016) giving Allround a price-based advantage. Allround is the current leader in market share for cold products with 40.4% of the market (James, et al., 2014) however is it notable to mention that Allround does not hold a share in other cold product categories targeting symptoms such as nasal and cough for which Allround is suitable for (James, et al., 2014). Allround will maintain its competitive advantage long-term through adaptability to consumer preferences. Consumer preferences and trends will be taken into consideration with each proposed formula revision as well as at each term. Allstars performance objectives will focus on increasing our position within the market. In order to do this, we must
  • 30. penetrate the market. By increasing market penetration from the current 60% to 80%, sales would climb 33%. Current sales are $355.3 million, an expected 33% increase would bring sales to $472.5 increasing slightly over $117 million. Overall our projected return on investment is the most important factor when demonstrating our marketing effectiveness. Current market reports show there is room for growth in all the major product categories, including cold, cough, allergy and nasal. Allround history within the market shows on consumer surveys where they have the highest percentage in brand awareness, brand trails and most frequently purchased. While still being competitive in conversion ratio and retention ratio there is room for improvement and will be a focus of two of our intermediary metrics. Allstar’s will use Allround’s company history and current position in the market in order to penetrate the market and grow our share of it. Using a marketing mix and implementing a push/pull strategy will be the focus to increase sales. Strong brands are more appealing to channel partners, when using this method. The push strategy will focus on trade promotions, which would allow us to include a higher than average promotional allowance and offer volume discounts. On the pull side, our strategy will include additional money being budgeted for consumer promotions and advertising. Expanding distribution channels will be beneficial in attracting and
  • 31. retaining new consumers and increasing our sales force. Currently Allround distributes zero trial size promotional items. Adding additional promotional activities will attract potential consumers to our products after introducing it to them and offering a chance to experience their effects. Product development will also be on the forefront of our strategy. Focusing on product reformulation, line extension and introducing new products in the hopes of attracting new consumers and improving our brand positioning. Allstar’s will focus on total conversion ratio which is referenced in consumer survey. “Total conversions is one of the most important metrics for measuring the profitability of your overall marketing efforts” (DeMers, 2014). Although customer retention is difficult to measure it will be a focus of our strategy because customer retention is needed for Allstar’s to be successful in the long run. Retaining existing consumers if more sustainable and cost-effective than actively pursuing new ones. Stock price and market share will provide a good indication of Allstar’s success throughout stimulation. Current stock price is $38.35. Allstar’s will focus efforts on marketing efficiency, share of unit sales, brand awareness, customer satisfaction, capacity utilization, market share and net income because these areas will influence our stock price. For each period, the OCM team will analyze the available market and industry of information, along with surveys related
  • 32. to marketing behavior, competitor’s activities, consumer's opinion, and internal management goals. The OCM team will utilize this information to determine the allocation of the marketing budget, pricing, advertisement options, sale force distribution, retailers’ allowance and discounts percentage and customers’ promotions option. Special attention will be given to the two highest competitors for each period and the performance will also be considered when adjusting these decisions (Winer & Dhar, 2016, pp. 36). Furthermore, the OCM team will utilize current and potential customers feedback to determine the value proposition of the new products that are being introduced and in return, these sources of information for identifying market trends and patterns will help to determine if product usage has increased or decreased due to brand expansion. Each period will advance the promotion of positive marketing efforts and sustainability of this strategic marketing plan. Period 1– Reformulate multi-symptom medication by replacing the cough suppressant with an expectorant. Period 2– Line extension of children’s 4-hour liquid medication. Period 3– Reformulate multi-symptom medication by dropping alcohol ingredient. Period 4– Line extension of 12-hour multi-symptom capsule. Period 5– New product introduction of cold spray. Period 6– New product introduction of 4-hour allergy capsule. Period 7– Reformulation of cold spray with addition of flavor
  • 33. offering. Period 8– Reformulation of 4-hour allergy capsule with extension to 12-hour relief. In summary, the Allstar’s product Allround is a segment leader in over-the-counter cold medicine. With a comprehensive formula, Allround has been successful in capturing 40.4% market share for cold medicine, but has not captured market share in the segments of nasal and cough. Therefore, Allstar will use its household name and brand appeal to increase market share through specific targeting of consumers aged 18-30. This will be accomplished through product development as well as by maximizing existing distribution channels and increasing spending in consumer promotions. Ultimately, by adopting the aforementioned to its strategy, Allstar is expected to increase its market share from 60% to 80%, with a projected sales increase of 33%. References Deighan, M., James, S., and Kinnear, T. (2018). “PharmaSim Decision Aids”. Interpretive