Young & Hot ℂall Girls Goa 8250077686 WhatsApp Number Best Rates of Goa ℂall ...
05 jul 2018
1. Practical Application of Elliott’s Wave Principles by Deepak Kumar July 4, 2018
1 Analysis by Deepak Kumar | www.sweeglu.com
Elliott Wave Analysis Report of Nifty 05 Jul 2018
Nifty opened bit higher at 10715 and declined sharply to register day’s low 10677 but bounced back
again by about 100 points from day’s low to register day’s high 10777 and closed 70 points up at 10769.
Yesterday, Nifty was in very complex type of pattern but one bounce towards 10755-10790 was
expected with 10672 as pattern negation point and stoploss for longs.
Trading strategy was to hold existing longs (taken in 10614-10593 range on Monday) with trailing
stoploss of 10669 (some points below 10672) expecting 10755-10790 as minimum upside targets and
suggested to hold for next day only if Nifty closes near high of the day. Nifty bounced further to achieve
minimum target range 10755-10790 and closed at 10769 (near high of the day). Now, let’s have a fresh
look at latest charts for further scenario.
This analysis report is covering move after 9951 and earlier wave counts are explained in my last “All
Time Frames” analysis report Fresh Elliott Wave Analysis of Nifty on All Time Frame dated 03 Jun 2018.
2. Practical Application of Elliott’s Wave Principles by Deepak Kumar July 4, 2018
2 Analysis by Deepak Kumar | www.sweeglu.com
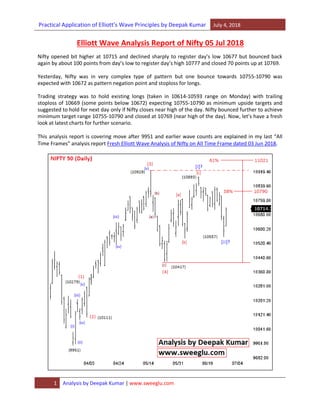
This is daily time bar chart of Nifty covering bounce after low 9951 which I marked as start of wave ‘v’ on
daily chart in my last “All Time Frames” Report. This is the same chart with explanation which I had
explained in my last analysis report because there is in wave counts on this chart.
It seems wave (1) completed from 9951-10229, wave (2) completed from 10229-10111 as Irregular
Correction and wave (3) may be completed at 10929, wave (4) may be completed at 10417 as Simple
Zigzag and wave (5) may be in progress. [Wave (4) retraced deeper than 38%).
Minimum 38%-61% projection for wave (5) is placed at 10790-11021 but end of wave (3) is 10929. So,
10929-11021 is minimum target range on upside in this case.
Nifty can decline below 10417 only if wave (4) turns into Complex Correction (Double Zigzag or Triple
Zigzag) otherwise Nifty is heading for high above 10929 again. And we can get clue of next possibility by
analyzing the progress of wave (5) started from 10417.
So, let’s analyze the progress of expected wave (5) started from 10417 on lowest possible time frame
chart to check its pattern closely.
3. Practical Application of Elliott’s Wave Principles by Deepak Kumar July 4, 2018
3 Analysis by Deepak Kumar | www.sweeglu.com
This is hourly bar chart of Nifty covering bounce from 10417 which I have marked as start of wave (5) on
5 hourly chart. There is change in wave counts. This is again the same chart with explanation which I had
explained in my last analysis report because there is in wave counts on this chart.
There is an [abc] bounce from 10417-10893 followed by a progress of Complex correction (Double
Zigzag till now) from 10893-10557.
So, there is possibility of Ending Diagonal Triangle in progress with inner wave [i] of ED from 10417-
10893, [ii] from 10893-10557 as Double Zigzag correction and wave [iii] of ED may be in progress. Wave
[ii] retraced deeper than 61% and corrected till the start of inner wave [a] of [i].
So, wave [iii] must be 100%-123% of wave [i] which would be of approximate 480-550 points from
10557 if I am right at identifying the formation of ED and inner wave [ii] of ED is really completed at
10557.
Otherwise we can see one more down leg for low below 10557 [as 3rd
(abc) cycle] if this wave [ii] turns
into Triple Zigzag correction. But wave (X)2 need to touch or break brown line [drawn on chart touching
end of (X)1] even if correction turns into Triple Zigzag. So, a bounce towards this line, or may be towards
10740-10800 is expected in this case also.
Other Possibility: - May be the whole decline started from 10929 progressing as Complex Correction
(Double Zigzag or Triple Zigzag) and Nifty needs to decline below 10417 to complete this Complex
Correction. Nifty can bounce above 10929 again but after completing the correction below 10417 in this
case. This is just a rare case but possible at this point of time.
Now, the charts are indicating that a Double Zigzag Correction is completed from 10893-10557 and new
upside wave started from 10557. So, let’s analyze the bounce started from 10557 to find out if the
bounce is progress of wave [iii] of ED or inner wave (X)2 of Triple Zigzag.
4. Practical Application of Elliott’s Wave Principles by Deepak Kumar July 4, 2018
4 Analysis by Deepak Kumar | www.sweeglu.com
This is 5 minute time bar chart of Nifty covering bounce from 10557 which I am expecting as start of
inner wave [iii] of ED or inner wave (X)2 of Triple Zigzag. Both these wave must be a (abc) move.
There is no change in wave counts yet and pattern is progressing as per expectations, it seems an
impulse completed from 10557-10708 which can be marked as wave (a or 1). Wave (b or 2) may be
completed from 10708-10604 as Irregular Correction which retraced by more than 61% and wave (c or
3) may be in progress from 10604.
Normal 100%-123% projection for wave (c or 3) is placed at 10755-10790 whereas 10755 is already
achieved and Nifty registered high 10777.
Within wave (c or 3), it seems inner wave (i) completed from 10604-10672 and wave (ii) may be
completed from 10708-10630 and wave (iii) may be in progress. Inner waves of (iii) are not clear.
5. Practical Application of Elliott’s Wave Principles by Deepak Kumar July 4, 2018
5 Analysis by Deepak Kumar | www.sweeglu.com
Fibonacci wise, normal 23%-38% retracement of wave (iii) of (c or 3) is placed at 10742-10720. So,
10742-10720 is immediate support range on downside and 10720 is immediate breakeven point below
which we can think of any downward reversal.
Nifty if breaks and trade below breakeven point 10720 for 15 minutes then further decline towards
10605-10557 can be expected.
Conclusion
For long/medium term,
Same as I explained in my all time frames report, Outlook for medium/long term is still bullish because
Nifty is within the middle of wave (3) on largest wave cycle and there is Irregular Correction at top. Nifty
has long way to go with occasional corrections (maximum 23%-38% corrections with 9918 as breakeven
point and 8968 as pattern negation point. Nifty may not break below 8968 in any case in coming years
before competition of larger wave cycle. We need to revise whole wave counts if Nifty ever broke
below 8968.
For Short Term,
Nifty already achieved expected 10755-10790 range but pattern doesn’t seem completed and there is
possibility of more bounce and upper range cannot be calculated.
We have 10742-10720 as immediate support on downside and 10720 is breakeven point. Nifty if breaks
and trade below 10720 for 15 minutes will open the possibility of further decline towards 10605-10557
range. Same 10720 can be used as stoploss for longs.
We need to keep all these conditions in mind.
Trading Points of View:
According to fresh conditions on charts: -
There is possibility of more bounce as pattern doesn’t seems completed but we can’t calculate probable
upside range, so our trading strategy must be holding longs with trailing stoploss until the stoploss
triggers or until we get clarity in pattern.
So, the longs taken on Monday in 10614-10593 range closed in 150 points profit. Those who are still
holding can hold the same for tomorrow using trailing stoploss of 10709 (some points below 10720)
expecting bounce towards 10790 and above. Hold for next day only if Nifty closes near high of the day.
Those who are holding multi lots must book partial profit.
Fresh Trade: -
1. Nifty if completes a corrective pattern in 10742-10720 range then fresh buying can be done in
10742-10720 range using stoploss of 10709 expecting targets towards 10790 and above. This
trade can be confirmed during market hours only after seeing the pattern of decline.
6. Practical Application of Elliott’s Wave Principles by Deepak Kumar July 4, 2018
6 Analysis by Deepak Kumar | www.sweeglu.com
2. Nifty if breaks and trades below 10720 continuously for 15 minutes then Selling can be done on
rise in 10720-10742 range using stoploss of 10751 expecting decline towards 10605-10557 in
coming days.
It is very difficult to manage trade in these types of complex patterns because of sudden up-down
swings. I had explained the conditions and suggested most probable trading strategy based on my
experience. Otherwise, traders can plan their own trades using their own experience based on this
conditions explained above.
DISCLAIMER
Trading Strategies suggested in this Report:
Trading strategy suggested in this report is just to show my subscriber how they can make trading
strategies in different market conditions based on Elliott Wave Counts. These trading strategies are not
trading recommendations. Any trade based on these trading strategies will be your own decisions and I
will not be responsible for any loss or profit for the same.
Trading based on my Elliott Wave Analysis Reports:
These Elliott Wave Analysis reports I prepared mainly for my book subscribers to show them practically
how to apply Elliott Wave Theory practically on charts to identify market moves, so that they can
understand better and learn faster. These reports are honest analysis based on whatever I can
understand from charts. These reports cover outlook of market but are not trading recommendations.
Trading based on these reports are your personal decision and trade only if you can understand these
reports completely or can identify change in wave patterns.
Request to Subscriber/Students:
Please don’t ask me about any personal trades, trading advice or market movement during live market
hours as I clearly mentioned in my service disclaimer. There are 100s of clients ready to get my advisory
tips service but I never provide, there is a strong reason behind it. Please try to understand. It is a
humble request as I feel uncomfortable to answer same words again and again.
Practical Application of Elliott’s Wave Principles by Deepak Kumar
(The perfect tool to predict the future of Stock Market)
By : Deepak Kumar
Phone: 8082165121, 7337307543
WhatsApp: 8082165121
Email: sweeglu@gmail.com
Website: www.sweeglu.com
7. Practical Application of Elliott’s Wave Principles by Deepak Kumar July 4, 2018
7 Analysis by Deepak Kumar | www.sweeglu.com
Contact Timing: 10 AM – 10:00 PM