Daily Technical Report:09 October 2018
•
0 likes•9 views

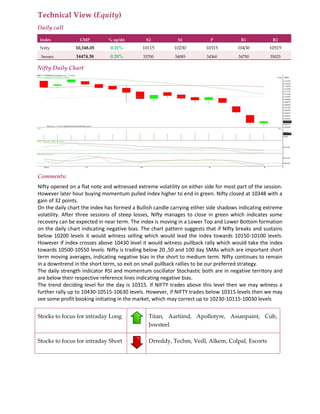
Nifty opened flat but saw extreme volatility throughout the day before closing higher up 32 points. The daily chart formed a bullish candle with shadows on both sides. After three days of steep losses, the small recovery indicates more may follow short-term. However, the index remains in a downtrend and below short-term moving averages, so an exit strategy on small rallies is preferred. Key support levels are 10200 and 10150-10100, while resistance is at 10430 and 10500-10550. Technical indicators also remain in negative territory.
Recommended

Recommended
More Related Content
What's hot
What's hot (13)
Similar to Daily Technical Report:09 October 2018
Similar to Daily Technical Report:09 October 2018 (20)
More from Axis Direct
More from Axis Direct (20)
Recently uploaded
Recently uploaded (20)
Daily Technical Report:09 October 2018
- 1. Technical View (Equity) Daily call Index CMP % up/dn S2 S1 P R1 R2 Nifty 10,348.05 0.31% 10115 10230 10315 10430 10515 Sensex 34474.38 0.28% 33700 34085 34360 34750 35025 Nifty Daily Chart Comments: Nifty opened on a flat note and witnessed extreme volatility on either side for most part of the session. However later hour buying momentum pulled index higher to end in green. Nifty closed at 10348 with a gain of 32 points. On the daily chart the index has formed a Bullish candle carrying either side shadows indicating extreme volatility. After three sessions of steep losses, Nifty manages to close in green which indicates some recovery can be expected in near term. The index is moving in a Lower Top and Lower Bottom formation on the daily chart indicating negative bias. The chart pattern suggests that if Nifty breaks and sustains below 10200 levels it would witness selling which would lead the index towards 10150-10100 levels. However if index crosses above 10430 level it would witness pullback rally which would take the index towards 10500-10550 levels. Nifty is trading below 20 ,50 and 100 day SMAs which are important short term moving averages, indicating negative bias in the short to medium term. Nifty continues to remain in a downtrend in the short term, so exit on small pullback rallies to be our preferred strategy. The daily strength indicator RSI and momentum oscillator Stochastic both are in negative territory and are below their respective reference lines indicating negative bias. The trend deciding level for the day is 10315. If NIFTY trades above this level then we may witness a further rally up to 10430-10515-10630 levels. However, if NIFTY trades below 10315 levels then we may see some profit booking initiating in the market, which may correct up to 10230-10115-10030 levels Stocks to focus for intraday Long Titan, Aartiind, Apollotyre, Asianpaint, Cub, Jswsteel Stocks to focus for intraday Short Drreddy, Techm, Vedl, Alkem, Colpal, Escorts