Daily Technical Report:14 February 2019
•
0 likes•7 views

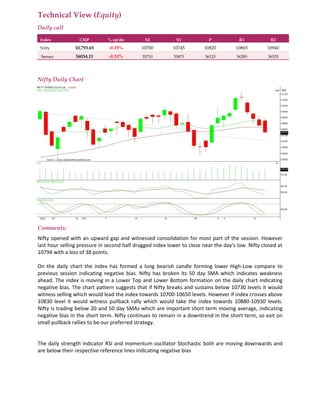
The Nifty index closed lower by 38 points due to last hour selling pressure, forming a long bearish candle on the daily chart. This indicates ongoing negative bias as the index has broken below its 50-day simple moving average of 10730. If the Nifty remains below this level, it could decline further to 10700-10650, but a move above 10830 could trigger a short pullback rally to 10880-10930. Technical indicators like the RSI and Stochastic are also moving downward below their reference lines, keeping the short-term outlook negative.

Recommended
Recommended
More Related Content
What's hot
What's hot (20)
Similar to Daily Technical Report:14 February 2019
Similar to Daily Technical Report:14 February 2019 (18)
More from Axis Direct
More from Axis Direct (20)
Recently uploaded
Recently uploaded (20)
Daily Technical Report:14 February 2019
- 1. Technical View (Equity) Daily call Index CMP % up/dn S2 S1 P R1 R2 Nifty 10,793.65 -0.35% 10700 10745 10820 10865 10940 Sensex 36034.11 -0.33% 35710 35875 36125 36285 36535 Nifty Daily Chart Comments: Nifty opened with an upward gap and witnessed consolidation for most part of the session. However last hour selling pressure in second half dragged index lower to close near the day's low. Nifty closed at 10794 with a loss of 38 points. On the daily chart the index has formed a long bearish candle forming lower High-Low compare to previous session indicating negative bias. Nifty has broken its 50 day SMA which indicates weakness ahead. The index is moving in a Lower Top and Lower Bottom formation on the daily chart indicating negative bias. The chart pattern suggests that if Nifty breaks and sustains below 10730 levels it would witness selling which would lead the index towards 10700-10650 levels. However if index crosses above 10830 level it would witness pullback rally which would take the index towards 10880-10930 levels. Nifty is trading below 20 and 50 day SMAs which are important short term moving average, indicating negative bias in the short term. Nifty continues to remain in a downtrend in the short term, so exit on small pullback rallies to be our preferred strategy. The daily strength indicator RSI and momentum oscillator Stochastic both are moving downwards and are below their respective reference lines indicating negative bias
- 2. The trend deciding level for the day is 10820. If NIFTY trades above this level then we may witness a further rally up to 10865-10940-10985 levels. However, if NIFTY trades below 10820 levels then we may see some profit booking initiating in the market, which may correct up to 10745-10700-10625 levels Stocks to focus for intraday Long Mothersumi, Tatamotors, Icicigi, Justdial, Shoperstop Stocks to focus for intraday Short Asianpaint, Bajfinance, Gail, Icicibank, Infratel