This document provides formatting instructions for authors submitting papers to the International Journal of Current Engineering and Technology. The template explains how to format figures, equations, tables, references, and other elements of the paper. Authors must follow the instructions and template format for their papers to be published. Keywords include terms like thermal analysis, pre-conditioner, in-mold, and inoculant's efficiency.
2. Ramesh et al Place the running title here in this space
2| International Journal of Current Engineeringand Technology, Vol.5, No.3(June 2015)
2.1 Placing the graphs
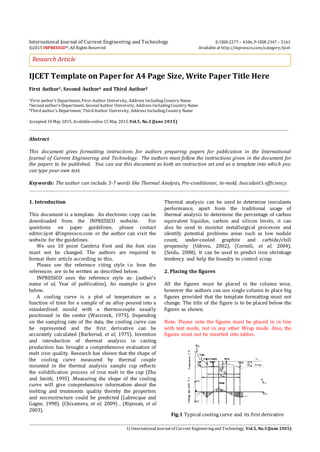
The graphs must be properly drawn in MS excel. Please
note that all the legends should be drawn in the MS
excel single file. They are not to be inserted in MS Word
which will affect the formatting of the template. Care
should also be taken to keep the font as Cambria. As
the default font in Excel is Calibri. So the graphs by
default take it. The authors are required to keep the
font as Cambria. The graphs must be in line with text
and are not be placed in any other wrap mode
2.2 Using and placing the equations
Please not that all the equations must be written in in
Microsoft equation 3.0 or above versions. Click Insert
and under Object you will find the Microsoft equation
3.0. Type all your equations here. Do not paste
equations from any other file. Equations appearing as
images will not be considered .Such equations are not
clear when the paper is converted in pdf. An example
of Microsoft equation 3.0 is given as under.
Timeproduction
Timeavailable
TimeTakt (1)
Please note that the properties of the equations must
not be locked
3. Placing the tables
It should be noted that all the tables must be firstly
drawn in Excel and after that they should be placed in
your article. The heading of the table should be above
the table. An example is given as under.
Note: Please note the tables must be placed in in line
with text mode, not in any other Wrap mode. Also, the
figures must not be inserted into tables
Table 1 Experimental procedure parameters
S. No Parameters Values
1 Melting
Changes
Acid lining coreless induction
furnace,100kg, 2400Hz
2 Charges 3.6%C, 1.22%Si, 0.02%P, 0.016%S,
0.04%Cr, 0.47%Mn, 0.005%As,
0.001%V, 0.001%Pb, 0.002%Ti.
3 Base Metal 3.56%C, 2.78%Si, 0.47%Mn,
0.020%P, 0.008%S, 0.0384%Cr,
0.0384%Cr, 0.042%Mo, 0.023%Ni,
Conclusions
The authors can write the conclusion as a whole in a
paragraph or by making points. An example is given as
under.
1) Derivatives of the cooling curve can be used to
understand the small changes in the
undercooling of the liquidus and solidus
temperature.
2) Thermal analysis is a good technique to control
carbides, shrinkage and micro-shrinkage
formation.
3) It is visibly shown that there is significant
reduction in undercooling degree on the alloys and
the value of inoculation index was increased.
Although the addition of Al,Ca,Zr-FeSi pre-
conditioners gives no significant influence .
4) The use of relative performance makes a clear
distinction of the alloys efficiency and could be
concluded that Ca,RE,S,O-FeSi inoculated iron gave
the most influence.
5) From the result obtained, it could be deduced
comparatively that Ca,RE,S,O-FeSi inoculant give
the best efficiency followed by Ca,Zr-FeSi and
Ca,Ba-FeSi inoculants respectively.
References
The authors are required to follow the following
reference style i.e. Authors names (Year of
publication), Title of the Article, Name of the journal in
Italics, Vol. No. Page No. The examples is given as
under
J.B.Humphreys,(1961), Effect of composition on the liquidus
and eutectic temperature and on the eutectic point of cast
irons, BCRIAJ,19,609-621.
R.G.Warsinsk, (1975) Ford develops CE cooling curve
computer, Foundry M&T,3,104-107
L.Backerud, K.Nilsson, N.Steen,(1975) The metallurgy of cast
iron,St.Saphorin,SwiitzerlandGenrgi publishing
company,pp.625-637.
P.Zhu, R.W.Smith, (1995) Thermal analysis of nodular
graphite cast iron, AFS Transaction, 103,601-609
C.Labrecque, M.Gagne,(1998), Interpretation of cooling
curves of cast iron: A literature review, AFS
Transaction,106,pp.83-90
M. Chisamera, I.Riposan, S. Stan, D. White, (2009), Influence
of Residual Aluminum on Solidification Pattern of Ductile
iron, International Journal of Cast metals research, vol.22,no.6,
pp. 401-410.
I.Riposan, M.Chisamera, S. Stan, C. Gadarautanu, T. Skaland,
(2003), Analysis of Cooling and Contraction Curves to
Identify the Influence of Inoculants on Shrinkage behavior of
Ductile Irons, Keith Millis Symposium on Ductile Cast Iron,
pp.125-135.
A.Udroiu,(2002), The use of Thermal Analysis for Process
Control of Ductile Iron, Seminarium Nova cast, Italy.
J. corneli, V.Ettinger, W. Baumgart, (2004), Thermal analysis
,an Unique Fingerprint of a melt ,66th World Foundry
Congress 6-9 , pp. 743-756.
Seidu, S.O (2008). Influence of Inoculant’s type on thermal
analysis parameters of ductile irons, 4thinternaltion
conference, Galati, Romania, pp. 237-241.
M. Chisamera, S. Stan, I. Riposan, E. Stefan, G. Costache,
(2007), Thermal analysis of Inoculated Grey Cast Irons,
UGALMAT,Galati,TechnologiisiMaterialeAvansate,University
press,Vol.1, pp.17-23.