1. Statistics Denmark 3 January 2006
Annegrete Wulff AWU/-
awu@dst.dk
Statistics Denmark’s StatBank 2005
A user survey
Statistics Denmark has as one of its main goals to focus on user friendliness
and quality of the products and services.
To follow up on this an annual user survey of the Internet Databank StatBank
is conducted since 2001. The scope of the 2005 survey has been changed from
a general user satisfaction survey to through light on more specific functions
of the StatBank.
Main conclusion 1444 users cared to fill in the web survey that was active for three days. The
respond rate in this survey has been very high: 36 per cent of the users have
responded. This is almost three times the respond rate from the previous year.
1/3 visits the StatBank for the first time. 2/3 find what they are looking for. A
major part of the users are students.
1/4 comments on the usefulness of the StatBank.
The action plan for 2006 includes an improved effort on easing the
accessability for first time visitors.
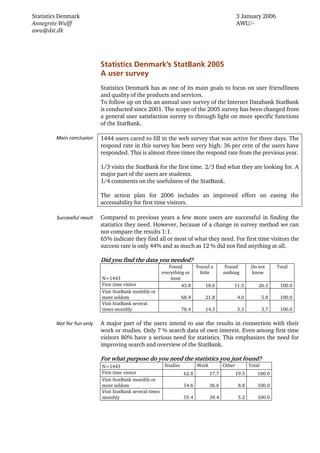
Compared to previous years a few more users are successful in finding the
Successful result
statistics they need. However, because of a change in survey method we can
not compare the results 1:1.
65% indicate they find all or most of what they need. For first time visitors the
success rate is only 44% and as much as 12 % did not find anything at all.
Did you find the data you needed?
Found Found a Found Do not Total
everything or little nothing know
N=1443 most
First time visitor 43.8 18.6 11.5 26.1 100.0
Visit StatBank monthly or
more seldom 68.4 21.8 4.0 5.8 100.0
Visit StatBank several
times monthly 78.4 14.3 3.3 3.7 100.0
A major part of the users intend to use the results in connection with their
Not for fun only
work or studies. Only 7 % search data of own interest. Even among first time
visitors 80% have a serious need for statistics. This emphasizes the need for
improving search and overview of the StatBank.
For what purpose do you need the statistics you just found?
Studies Work Other Total
N=1443
First time visitor 62.8 17.7 19.5 100.0
Visit StatBank monthly or
more seldom 54.6 36.6 8.8 100.0
Visit StatBank several times
55.4 39.4 5.2 100.0
monthly
2. A possibility to use automatic updates of StatBank retrievals via Excel web
Automatic updates
queries has been developed. It is included in the Data shoot function. 40% of
the users state that it is something they need. Another 47 % expects that they
will use at a later occasion.
The question is rather complex and it is not evident if the answer concerns
automatic update in general or the specific Excel web query function. A link to
a demo site, www.dst.dk/datashooting, explaining the Excel web query
method has been visited by less than 10% of the respondents during the
survey period.
One out of four respondents has taken the time to write a comment in free
More comments from the
text. In 2004 one out of six did so. People writing their e-mail address will get
users
a comment or answer in return. 75% of all commenting wrote an e-mail
address.
The comments cover approval as well as disapproval and wishes to get access
to even more detailed data and longer time series. There is a positive
correlation between being a novice in StatBank and mentioning of the site as
confusing.
Reading the results makes it obvious that we shall focus on first time users
Action plan
helping them to get a better overview of the site. This implies a thorough
examination of all situations where the user has to make selections. Moreover
it will include a usability test.
We shall look into:
− The page where the tables are presented will be re-arranged, grouped and
checked for meaningful titles.
− Help function shall be more visible.
− Sorting within the boxes where values are selected.
− Search function improved.
The user survey is available on www.dst.dk/usersurvey together with
previous surveys.
2
3. Appendix 1 Method
Since 2001 an annual user satisfaction survey of StatBank.dk has been carried
out. The results are published on www.dst.dk/usersurvey.
The method as well as the questionnaire is more or less identical in the 2001-
2004 surveys. In 2005 we decided to focus on the large group of first time
users. Thus we had to design the survey in a way where people had actually
come into the StatBank and tried to work around there. That is when they had
made there selections and got a table on screen.
It is our intention every second year to repeat the large survey. The years in
between we will conduct some minor survey specific on the use of certain
functions or users.
The survey which was conducted as a web query was running 22-24
November 2005. 1444 persons responded, making a respond rate of 36%.
If certain conditions were fulfilled the user was eliminated and did not get the
Conditions
questionnaire:
− Users with a Statistics Denmark IP-address were eliminated.
− Users with a browser different from Explorer 5 or newer or a Firefox were
eliminated. These browsers cover 95% of all users. (The condition was set
in order not to get in trouble with pop-ups in older browser versions).
− Users are only asked to participate once.
− Users skipping the selection page are eliminated (this will exclude data
shooters going directly to their saved table).
There are only five questions in the questionnaire. The questionnaire pops up
Pop-up
inside StatBank when a selected table is shown on screen. It was shown only
in the Danish version of StatBank.
The box says:
Sorry to disturb you.
We have 5 quick questions. Your answers can help us improve the StatBank. You
can also give us your comments, if you answer the scheme.
Will you answer the 5 questions?
[Yes], [Later], [No]
3
4. Annex 2: StatBank questionnaire 2005
1. How often do you use the StatBank?
2005 2004
This is the 452 31.3 268 22.8
first time
Once a 377 26.1 300 25.5
month or less
A couple of 307 21.3 342 29.1
times a
month
Once a week 248 17.2 267 22.7
or more
Do not know 57 4.1 - -
Total 1444 100 % 1177 100%
2. For what purpose do you need the statistics you just found?
2005 2004
Studies 831 59.6 606 51.5
Work 460 31.8 455 38,7
Personal 103 7.1 79 6.7
interest
Other 36 2.5 24 2.0
Do not know 14 1.0 13 1.1
Total 1444 100% 1177 100%
3. Did you find the data you needed
2005 2004
Do you usually find what you need?
Yes,
60 6.6
279 19.3
everything Always
Almost
Yes, partly
412 45.2
661 45.8 always
No, very
356 39.2
little 254 17.6 Usually
Almost
No, nothing
73 8
87 6.0 never
Did not
Do not
need
know 8 0.9
163 11.3 anything
643 100
Total 1444 100%
4
5. 4. A retrieval from StatBank can be saved in Excel. You can get automatic
update to this file with the latest data, without opening the StatBank
again. Is this something you can use? (See a demo on
www.dst.dk/datashooting)
2005
Yes, I need that 580 40.1
Seems smart but I do 674 46.7
not need it right now
No, I do not need that 82 5.6
Do not know 108 7.5
Total 1444 100%
5. Do you have any comments regarding the StatBank?
2005 2004 2003 2002
Number 345 183 248 258
Per cent 23.4 15.6 20.1 22.9
6. Write your e-mail address if you want Statistics Denmark to return an
answer or comment.
244 -or 70.8 per cent - out of the 345 that made a comment wrote also their e-
mail address.
5