
Recommended
Recommended
More Related Content
Similar to Read the paper titled Improving Patient Care and the Bottom Line .docx
Similar to Read the paper titled Improving Patient Care and the Bottom Line .docx (20)
More from angelicar11
More from angelicar11 (20)
Recently uploaded
Recently uploaded (20)
Read the paper titled Improving Patient Care and the Bottom Line .docx
- 1. Read the paper titled “Improving Patient Care and the Bottom Line with Location Analytics” Page 8-12 only (Not all the whole document) And address the following in 500 words (in two pages regular/Standard Margin): Section 1 - Overview / summary of the reading - this may include: · What are the key points? · What was learned? · What are the most important issues? · Why is it important (or not)? Section 2 - Your reaction and wider implications - this may include: · What do you agree/disagree with and why? · What critiques do you have? · What additional things do you want to learn? · What questions does this reading raise? · What related examples have you found or observed in the real- world? · Links to other relevant materials (websites, videos, etc.) Enrich your Data with Location Analytics Sponsored By: §.sas PAGE 2
- 2. Table of Contents: Page 3 The Future of Location Analytics: Q&A with Tapan Patel and Murali Nori of SAS Page 8 Improving Patient Care and the Bottom Line with Location Analytics Page 13 Location Analytics Use Case: Connected Vehicles Page 16 Enhancing Your BI Systems with Location Analytics: The SAS® Vision Page 18 Location and Insight in the Age of the Internet of Things Page 21 The Value of In-House Alliances in Adopting Location Analytics Page 24 How Spatial Analysis Leads to Insight Page 28 Prescriptive Analytics Project Delivering Big Dividends at UPS Page 31 Pokémon GO and Monetizing the Massive Value of Geolocation Data PAGE 3 Sponsored by The Future of Location
- 3. Analytics: Q&A with Tapan Patel and Murali Nori of SAS Nicole D’Angelo 1. Organizations are already collecting vast amounts of data from a myriad of sources. Why should they add location data to the analytical mix? The most common uses of analytics and reporting are based on business data. Location information doesn’t get much attention. But all business has to happen somewhere. The Internet of Things has created connected cars, connected people, and analytics at the edge, and this technology is making business rethink some use cases. Location will be an important aspect for these kinds of things. Driverless cars, Uber, drones—all are evolving, and real technologies and business models are being built around them. These all rely on location as an important facet, thus making location an important aspect of business analysis and business data that organizations need to pay more attention to. 2. What business issues have you seen being solved by using location analytics? Some are covered above. Add to that, business scenarios where location is a primary factor, such as property insurance companies trying to determine the price of insurance based on location, healthcare organizations trying to understand the types of services needed based on the demographic data of a
- 4. city or location, or new transportation companies, like Uber and Lyft, analyzing and understanding the use of their services. 3. What are some challenges organizations might face as they begin implementing processes and technology for analyzing location data? Location information has specific requirements that are needed to add it to business intelligence or data visualization applications. For example, to represent a bank on a geographic map, you need latitude and longitude information. To represent a region like a zip code, county, state, or sales territory, you will need shape files that are used to draw the boundaries on a map. Tapan Patel Principal Product Marketing Manager, SAS Murali Nori Senior Product Manager, SAS PAGE 4 The Future of Location Analytics: Q&A with Tapan Patel and Murali Nori of SAS Organizations need to plan to implement software tools that can be used to geocode a
- 5. location to obtain latitude and longitude information and to create the shape files necessary to draw the shapes on maps. Getting the correct tools is the first step to creating and using location information in an organization. Going beyond the collection, creation and visualization of the location information on maps, the greater value is in using this for analysis. 4. How can organizations overcome these challenges? To get the best use of location analytics, organizations need to have a good software application that brings together business data, location-based GIS data, and analytics in a seamless and easy-to-use way. Another important step to overcoming these challenges and realizing the benefit of location analytics is to invest in cultural change and training. An informed and trained workforce will overcome the challenges of adopting location analytics. One good approach is to start with business use cases that are useful to the company and can be used to drive decisions. 5. Are special skill sets required to leverage location information? The skills required for using location analytics vary depending on the role of a person in the organization. Business managers and executives who are receiving and using the information may require less training. Those who are creating reports, dashboards or special analytics may need knowledge of analytics and an understanding of the capabilities of
- 6. the application. For advanced GIS users and the creators of GIS maps, more skills in that direction are necessary. 6. In all areas of analytics, data cannot give the organization a competitive advantage unless you have a well-developed strategy for how you’re going to use that data. How can organizations best develop a strategy for using location data? Organizations using location data need to collect, access, and prepare data, and updates will depend on what type of use case they are trying to solve, expected outcomes, and the cost and effort necessary. At a basic level, the organization will already have access to the geographic definitions (e.g., geo-tagged social-media data and latitude/longitude to customer addresses) of the entities they are trying to analyze, and they will need to augment it with third-party external data sources like weather data, crime statistics, or consumer spending, and then integrate these different datasets. For additional value, organizations should consider collecting location data over time to understand the movement of entities (e.g., customers and assets) and array of new sources (e.g., GPS, NFC and Beacons). In many cases, consumers are voluntarily offering location- aware data through their mobile devices, which provides much more contextual depth. The speed, scale, and complexity of these types of location data puts a lot of demands on data management technology, information architecture and available
- 7. skill sets. Finally, location data may often include personally identifiable information, and organizations must keep in mind privacy and data protection regulations. PAGE 5 The Future of Location Analytics: Q&A with Tapan Patel and Murali Nori of SAS 7. How do organizations identify the right use cases for location analytics? Location analytics is applicable to all types of organizations in different industries and, in fact, it is also relevant to all functional units within an organization. Hence, organizations need to focus on projects or use cases that fulfill high-priority requirements and deliver the highest returns. Keep in mind data preparation challenges, availability of skills and competencies, and data privacy, security and ethics issues. Organizations can take advantage of location analytics to drive use cases in the following (sample) categories: • Grow business with proper site or channel selection: Expand your market footprint, capture the next generation of customers, and identify where future growth is going to come from by quickly finding and qualifying all potential new locations or online channels. • Improve customer experience or targeted marketing: Combine
- 8. geospatial location, ease of access, context, and proximity to make relevant marketing offers or improve experiences. This enables marketers to proactively meet customer needs. • Improve public services and government planning: Whether it is responding to emergency situations, alleviating traffic congestion, offering social or public services to needy families, or improving law enforcement, local, state, and federal entities are prime candidates for location analytics. • Optimize business processes by adding and analyzing the “where” dimension: Adding the location context of assets—manufacturing, assembling, logistics, distribution and servicing—helps optimize businesses process and adds value for organizations. 8. How can organizations ensure that they’re using the right visual discovery tool to gather insights from location analytics? Once again, organizations should take into consideration their use cases, types of users and their skills, types of analyses being performed, level of customization desired, and current analytics maturity level. Select the right visual- discovery and self-service analytics tools to meet the needs of the following types of roles to realize the value of location analytics: • Business analysts who will benefit (not just) from easy access to traditional insights, but also from quickly and visually identifying opportunities or risks
- 9. from the “where” dimension offered by location data, to augment their reports and explorations. For example, how can they recognize customer segments to pursue? How many customers live within a given distance of a specific store, and how long does it take them to drive to it? • Front-line staff and business users will benefit by adding location context as they receive interactive insights and can take action as part of their operational tasks. Similarly, line-of-business executives, in relevant use cases, can better track and understand business performance using location-specific context. • Data scientists can explore location data and use it as one of several variables for creating predictive models. Whether it is to optimally place future sites, understand why customers behave differently in different locations, or effectively predict customers’ future needs, location data can improve the yield from predictive models for organizations. PAGE 6 The Future of Location Analytics: Q&A with Tapan Patel and Murali Nori of SAS 9. How will the use of location analytics transform common approaches to business intelligence, analytics, or big data? How does location analytics
- 10. add value to your business intelligence and analytics initiatives? At present, location analytics is primarily being used in a traditional manner—to analyze data in an interactive geo-map through reports, dashboards, or explorations. But it needs to go further. With new scenarios supported by digitalization, mobility, and IoT, location- dependent decision-making offers a lot more potential for organizations of all stripes. They need to go beyond just reporting items, events, or performance across locations. More value can be derived if location data can be correlated with historical behavior or if location data is used as a continuous variable in your analyses to predict future outcomes. For example, realize the impact of drive time and drive distance on highlights or trends you are trying to explore, determine optimal locations (e.g., of stores, facilities, or service centers) based on demographics and available resources, or combine location data with analytical techniques (e.g., clustering) to better segment customers in a more useful and relevant manner. Location analytics adds the “where” element to the traditional set of business intelligence and analytics questions, and allows for new insights that you might have missed or not thought of. 10. What industries benefit most from location analytics? All industries benefit from location analytics because business always happens somewhere! Products and services are sold somewhere, though some
- 11. industries are affected more by the product and services they sell in certain areas. Insurance for the same size house will be different based on its location, even in the same state. The probability of hurricane damage to a house on a beach is more than a house that is inland. In the utility industry, for example, Google Fiber efforts to estimate the cost of services in a location depends on the density of people and the technically oriented population in that area. In the transportation industry where Uber plays, pricing and profitability depends on the availability of drivers and the propensity of people to use Uber in a certain location. 11. What are the security and privacy concerns about location information? Security is an important point to consider and it varies for each company and business use case. In the case of connected people using data from smartphones, smart watches, and fitness tracking devices that track location and time of day for daily activities, location information should be very secure. If hacked, this can be a serious personal security concern. On the other hand, data that is summarized at higher levels—for example, on the zip code, state, or country level—may not be very sensitive from a security point of view because no individual is exposed. The retail industry uses the concept of geo-fencing to send promotions to customers when they are within a specific store location. They detect your
- 12. location from your phone and send promotions via that phone. This is an example of an area that is evolving, and not many security guidelines or enforcements are in place. PAGE 7 The Future of Location Analytics: Q&A with Tapan Patel and Murali Nori of SAS 12. How does location intelligence benefit from IoT and advance new business use cases? IoT and drones will play an interesting role in enhancing location-based analytics in the future. IoT devices come in different sizes and capabilities, and are assigned to an endpoint like a person, machine or device. Because most of these tend to collect data from a specific location they become valuable data sources. More important is the volume of data that IoT devices send out. Consider a smartphone as an example of an IoT device. Look at the data sent by an exercise app from a smartphone as someone runs. At the end of the run, the app provides the route of the trail on a map as well as other stats like time, calories burned, distance, and speed. The app can summarize the data to provide stats for a week or month. An IoT device deployed in a car can track the route, speed, and driving habits of the driver.
- 13. This provides information on the daily commute of a driver and time spent in car, allowing appropriate products to be promoted. Driving habits like braking and acceleration enable warranty analysts to estimate wear and tear on the car. Insurance companies can use the Tapan Patel is Principal Product Marketing Manager at SAS. With more than 15 years in the enterprise software market, he leads global marketing efforts at SAS for Business Intelligence, Predictive Analytics, and In-memory Analytics. More specifically, he leads go-to-market initiatives for Visual Analytics and Visual Statistics product lines. Murali Nori is Senior Product Manager at SAS. He has worked in Business Intelligence (BI) technologies for 14 years. Murali is very passionate about BI and believes in how it can transform big and small businesses from chaos to smarter organizations. He enjoys his role and the opportunity to work with customers, sales organizations, and R&D to build the product roadmap and influence product direction that can solve customer problems. Murali’s focus is on SAS® Visual Analytics, location analytics, mobile BI and big data analysis. PAGE 8 Sponsored by
- 14. Improving Patient Care and the Bottom Line with Location Analytics by Murali Nori Better health care at lower costs, for everyone – how do health care providers get there? Understanding the gaps in patient care, patient needs, and the geographic distribution of the patient population are important elements to consider when making decisions about improving the quality of care and reducing its costs. To effectively analyze gaps in patient care, the data needs to be in a single place or system. However, in many organizations, data is spread across a myriad of spreadsheets and database systems. Data not organized for visual exploration and coherent analysis isn’t useful for decision making. Hence the need for visually appealing and scalable analytical tools to help organizations be more efficient, effective and economically successful. Visualizing patient data geographically is the first step to understanding gaps in patient care. We can use analytics to understand the likelihood of different diseases in different locations based on historical data, demographic data and lifestyle trends. Analytics can also help organizations understand the gaps between the needs of the population and the services available in its location. Providers and administrators can forecast trends in the cost and quality of care and understand differences across
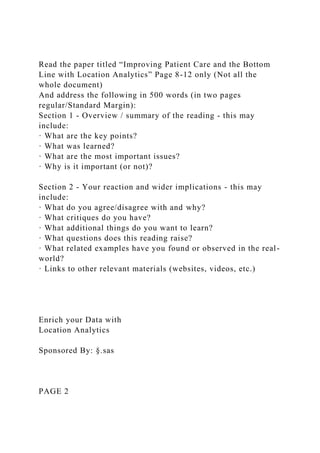
- 15. populations. Visualizing these data points makes it easy for users with different skills and backgrounds to understand and grasp the data. In today’s world, people constantly move across different regions, states or countries for social and economic opportunities. Health care providers need to have tools to understand the changes in the population mix and to predict the trends more quickly compared to a few months, a few years, or a decade back. Using location- based analytics, one can visualize the changes in population composition and health to understand their needs. One example is diabetes care. According to the American Diabetes Association, almost 29 million Americans have diabetes and 86 million have pre- diabetes. Nearly $322 billion is spent on treating their diabetes and pre-diabetes, and for every $5 spent on health care, $1 goes toward diabetes treatment. (See Figure 1.) These data points lead to many questions, like the following: • Where are the most people with diabetes located? • Are there adequate medical facilities there? PAGE 9 Improving Patient Care and the Bottom Line with Location Analytics
- 16. • In each location, how many people actively participate in diabetes education and management? • In each location, what is the mix of population with Type 1 and Type 2 diabetes? • With demographic data and lifestyle data combined, what else can we learn from analysis? • Are different ages affected by diabetes in different parts of the country? Figure 1: Diabetes Costs from the American Diabetes Association PAGE 10 Improving Patient Care and the Bottom Line with Location Analytics Some of these questions can be answered using location information that is mapped for data visualization. In Figure 2, from the Centers for Disease Control and Prevention (CDC), you can see the US trends in obesity over time and its relation to the increase in diabetes among its population. Adding location context to the analysis can provide better analysis of the problem and can lead to diagnosis and management of diabetes at an early stage, which can significantly
- 17. reduce the overall cost for diabetes care. Better care in the early stages of diabetes can reduce the chances of the disease progressing, including more serious medical complications like dialysis and amputation. The real value of gathering location information comes from analyzing it in combination with business or operational data. Analyzing location information in combination with business information, demographic information, and social media information provides a more complete picture. Reports from SAS® Visual Analytics are shown in Figures 3 and 4. In Figure 3, the prevalence of diabetes over time can be visualized at the county level in the US. We can also use population data, income, incidents, etc., to get a complete picture. Using the drop-down control on the top left, we can select different states to see the data for any given state or county. In this example, the seamless interactions between the map and the business data is critical to realizing the value of the location data. Figure 2: Diabetes Trends in US Adults from the Centers for Disease Control and Prevention PAGE 11 Improving Patient Care and the Bottom Line with Location Analytics
- 18. When a hospital chain plans to provide diabetes-related services, they can determine the likely number of patients in and around the location, as well as the types of services needed for different severities of the disease. This helps them size the staff and facility accordingly, which helps eliminate unwanted fixed and variable costs. They can filter or drill down to a county, zip code, city or town level that works for their scenario. Hospitals can understand the trends in the location so they can plan for the future as well. Understanding the lifestyle behaviors in a given area, trends by age, and demographics is important in the treatment of diabetes. The next step is using location data combined with self-service analytics like regression, forecasting and clustering. Figures 5 illustrates how data can be analyzed using distance variables, like drive-by- distance and drive-by-time analytics. In this case, the location information is visualized on the map, and clustering analysis is performed using the data points selected on the map. Figure 3: The Number of Men and Women with Diabetes by County in the US Figure 4: Obesity Visualized Using a Geo Map PAGE 12 Improving Patient Care and the Bottom Line with Location Analytics
- 19. The polygon on the map illustrates the drive time (for example, 10 minutes) from a specific location selected on the map. All the data points within the polygon are used by the cluster analysis and visualized in the charts beside the map. It helps to group the data points to understand both the patterns and relationships. These types of analyses can help providers understand the optimal type, size and location of a health care facility, the services to offer, and the specialty staffing that will be required. These factors, in addition to others, will determine the quality of care and patient satisfaction at a given cost for a health care provider. Today, location information is also obtained from wearable devices like exercise trackers, smartphones and smart watches. Many applications have been developed to track a person’s activity and exercise patterns. The location information from these devices can be added to overall demographic data to help health care providers advise patients and improve the quality of care. Location analysis helps business analysts and managers understand what happens and where it happens. Combined with analytics, location information becomes a powerful asset in decision- Figure 5 Using travel time and travel distance to identify area of interest
- 20. PAGE 13 Sponsored by Location Analytics Use Case: Connected Vehicles by Murali Nori In a world of connected vehicles, using location information can shape existing business models and create new ones. Let’s look at a few emerging business trends. First, consider how ride sharing (with the emergence of companies like Uber and Lyft) has reshaped the taxi market space globally. Second, think of how cars and trucks can record and transmit data to understand driving behavior and vehicle conditions. This provides information about the state of the vehicle in context to its location and can be used to analyze and support location-based interactions as well as predictive maintenance. Analysts predict there will be more than 380 million connected vehicles on our roads by 2021. This opens exciting opportunities for the global automotive industry, prompting automakers to consider options for future success. However, traditional approaches to data management and analytics might not be sufficient to create and sustain value in this new, connected world. Figure 1 illustrates different scenarios for how location data can play an important role in
- 21. business opportunities. Connected vehicles - location plays an important role Usage-based insurance Ride sharing Warranty analysis Driverless cars Route optimization Figure 1: Examples of how connected vehicles can use streaming location information. PAGE 14 Location Analytics Use Case: Connected Vehicles Ride Sharing In the case of ride sharing, providing the location of passengers waiting for taxis and the taxis that are available on maps is a good first step. Understanding where and when more people tend to need the services, and where they most likely will be going, helps reduce the time required to respond to a ride request. This provides better service to customers
- 22. and leads to a more profitable and successful business. Location analytics plays a big role in the functioning and success of ride-sharing services. Taxi companies and other ride-sharing ventures need location data for all points of interest, including tourist destinations, businesses and house addresses. Based on the latitude and longitude of waiting passengers, taxi drivers can find the most optimal route for pick up and drop off. Passengers looking for a taxi need the ability to see where the available taxis are, as well as details like the type of vehicle, the taxi number and how long it will take for the taxi to arrive. Company analysts need to optimize the routes for different traffic conditions, for the best value to customers and for their own profitability. Drive-time analysis plays a big role in this optimization. Connected Transportation In the transportation industry, route analytics plays an important role for truck drivers and trucking companies. Delivering goods to customers in the shortest amount of time, and most economically, continues to be the most important goal. Access to granular and accurate location data is the foundational element required to support this objective. Location information of a truck can be combined with weather data to plan the best routes and understand wear and tear on a vehicle. In addition,
- 23. combining location data with weather, altitude and other environmental factors results in a better understanding of sensor data patterns. And this data can be correlated with warranty claims to help plan and manage warranty and maintenance costs. Understanding location and operating conditions makes it possible to identify potential root causes of quality issues and to predict failures before they occur. With SAS Visual Analytics, you can analyze the path of a truck on a specified route along with altitude, speed, engine temperature and RPMs. (See Figure 2.) As the size of a truck increases, the cost of the truck increases and a breakdown becomes more expensive for the owner. A more analytical approach ties a vehicle’s wear and tear with the location and weather to help better plan maintenance of the trucks. Location information can also be combined with operational systems to better plan the delivery of goods. For example, knowing how many customers are in a specific area can help optimize delivery routes. Looking at the trends among the customers for the types of popular goods improves inventory planning so inventory can be located closer to consumer demand. Evaluating the net customer value can also help plan the level of service appropriate for a given area. PAGE 15
- 24. Location Analytics Use Case: Connected Vehicles Driverless Cars In the near future, driverless cars will be on the roads, changing the way people and goods are moved. The entire car industry of the future will depend on location analytics playing a critical role in the development of new business models. The emergence of smart devices, with high-performance processing capabilities and increased memory at lower costs, has had a significant impact on development of driverless cars. One component of the data is location of the vehicle. At any given point, location, time and speed becomes important to plan and guide the car. The instrumentation of vehicles creates the opportunity to collect real-time data, enabling real- time scenario analysis, which reduces the time required to make decisions. Location information becomes a very important asset in the future business models of ride sharing, optimized delivery of consumer goods using autonomous drones, and driverless cars. For these business models, evolving the use of location- based data is an essential piece of this new connected vehicle wor Figure 2: A truck’s trip analysis, including altitude, speed and engine temperature, from SAS® Visual Analytics.
- 25. PAGE 16 Sponsored by Enhancing Your BI Systems with Location Analytics: The SAS® Vision Location data has long been a big portion of business data, although it is rarely used to analyze business metrics. Not many business analysts have taken advantage of incorporating location data into their analytical workflows. Traditionally, location data has been used solely for mapping and GIS purposes. Most analytical workflows are focused on business data. Organizations try to glean insights from business data by using analytical algorithms to predict trends. In many cases, these analytical workflows and business intelligence (BI) systems are silos and are not integrated. Typical BI reports and dashboards contribute to one part of business insights. Advanced analytics, like forecasting and predictive analytics, add a second layer and produce deeper insights. A third dimension can be added to business insights by using location information and augmenting location data with demographic and lifestyle data to better understand everything from consumer purchasing patterns and habits to trends in health care issues like diabetes. At SAS, we see location analytics as not just putting points on a
- 26. map. Rather, it’s part of a much larger picture of using location context for analysis in graphs, tables and visual analytics. Presenting the results of predictive analytics along with location data on maps provides easy-to-understand visualizations and helps everyone better understand their business because most people find maps very easy to comprehend. Here is one example of how location data can be used to drive downstream analysis. Imagine you’re looking at sales data for different products, like shoes, childrens’ clothes and toys. Analysts can place the data on geographic maps to see where customers are located. They can produce geographic clusters of customers, find out where the most profitable customers reside, and create reports in BI systems that contain sales, profits and other metrics. And, analysts are able to select an area on a geo-map and use the data points to perform further analysis in their BI systems. The ability to use geo-maps to produce ad-hoc visualizations and analysis helps business managers identify customer patterns and drill into more details of the business. Now let’s look at a different situation—how to use analytics to create location-based visualizations. Business managers always want to know projections for the next quarter, the next six months and the next year so they can plan their resources and adjust expectations accordingly. SAS enables you to do predictive analysis, like forecasting of sales, and then
- 27. PAGE 17 Enhancing Your BI Systems with Location Analytics: The SAS® Vision use the forecasted results as visualizations on maps. This allows business managers to see and compare current data and predicted projections for the future. By using location information on maps, business managers can clearly see how customer clusters are changing over time and better plan distribution and logistics. At SAS, we see location analytics as an extension of BI. We like the idea of using location data for mapping and driving downstream analysis, as well as using analytics and location information to drive mapping visualizations. Location analytics provides yet another way for business users to dig into data and get a visual understanding of information to realize the PAGE 18 Sponsored by Location and Insight in the Age of the Internet of Things by Helen Thompson
- 28. Gartner once again put the Internet of Things (IoT) at the top of its annual hype cycle, meaning that Gartner believes that the IoT is at the peak of inflated expectations. As a result, naysayers have drawn their knives of negativity and are predicting the demise of the IoT due to a lack of a killer app for both businesses and consumers. I believe this misses the point. The IoT isn’t about a thing; it’s about all things on the Internet. If the IoT truly is about only one thing, then that thing is the opportunity that is to be gained by data – real- time data streams in particular. Look at all the IoT siblings that are on the hype cycle: autonomous vehicles, connected homes, wearables, advanced analytics, and machine learning. All of these involve billions of objects equipped with sensors that continually throw off data. But there is no value from the IoT without the ability to make practical use of the data that is continually created. Geographic data adds perspective and identifies relationships between data points that otherwise appear unrelated and unrelatable. Mark Bonchek, Harvard’s first doctoral recipient on the topic of social media way back in 1997, explored an interesting concept in the Harvard Business Review in May 2013: little data. Big data is the information that is collected about
- 29. many people. Little data is information we know about an individual. Both big data and little data can be enhanced with location information. Geographic relationships can now be parametrized so that we can easily ask questions that help us gain real knowledge about customers as consumers and their habits and needs. Where: The Forgotten ‘W’ But how do we pinpoint that individual or smaller community to provide context to the ocean of big data? Geography can provide a where to the who, what, why, and when that we already have collected. This is easier than it may seem. Every 21st century dataset and transaction contains location information – a customer address, the store location of a purchase, counts of riders on mass transit as they embark and disembark on their journeys. Helen Thompson, Director of Commercial Marketing, Esri http://www.gartner.com/newsroom/id/3114217 http://data-informed.com/you-dont-have-to-choose-between-big- data-and-iot/ http://data-informed.com/data-lust-the-iot-and-the-quantified- self/ http://data-informed.com/machine-learning-sees-defrauding- with-the-trees/
- 30. https://hbr.org/2013/05/little-data-makes-big-data-mor/ PAGE 19 Location and Insight in the Age of the Internet of Things Think about a shopping list. A few years ago, I had to scan the weekly ads to find the best prices for my shopping trip. Today, by opting in to a store’s loyalty program, I am provided offers each week based on purchases I’ve made previously. The store knows that I frequently buy apples and carrots, so it provides me with a digital coupon for these products. This is little data. The store also can sift through the purchasing habits of others who shop at the same location as I do and also purchase apples and carrots. Maybe the store discovers that a majority of these people also purchase mangoes, and offers me a coupon to buy mangoes, too. This is big data. Thanks to sensors, the store can use algorithms to predict how many additional mangoes might be purchased from this promotion and stocks the shelves accordingly. This is insight from big data and little data viewed through a geographic context. Providing Context by Connecting Data with Geography A store can apply a geographic context inside the store during a customer’s path to
- 31. purchase to drive improvements in customer experience and engagement. It’s possible that soon we not only will receive coupons for what the store expects us to buy, but also will receive reminders as we shop in the produce aisle. Perhaps we will be given an alternative to apples, together with a list of locally sourced ingredients that are on sale and a recipe for a meal. Not only do we save money, we have a better experience too. With knowledge of suppliers that is maintained throughout the supply chain all the way to the store, the grocer can substitute ingredients that might be at risk of spoiling soon (those apples are starting to get a little soft) or a higher-value alternative (mangoes) that improves profitability over my regularly purchased apple. Providing a geographic context to data changes how organizations see and use the data. It also helps organizations gain better insight. Geographic context can be provided through location information that is as simple as a farm name, an address, a GPS coordinate, the owner or supplier name in a manifest, or the number of the vehicle collecting the produce. Systems with geographic context that feed analytics enable enterprises to join data between disparate systems. The little data approach to these datasets – understanding the where in all data – enables an understanding of the entire supply chain in context.
- 32. Solution s via Sensor Today, sensors are capable of monitoring purchases of farm fresh vegetables and comparing customer preference by supplier and farm. Potential out-of-stocks can be identified, and comparable products can be sourced to respond to market dynamics. Operations can be streamlined and customer buying habits and actions systematized through machine-to-machine and data-to-data learning. PAGE 20 Location and Insight in the Age of the Internet of Things When unexpected events occur, like a supply chain interruption or food contamination, the same geographic context can be applied to minimize impact.
- 33. Sensors on refrigerated trucks or cold storage facilities can identify failures that could lead to human health risks. Location-specific analysis and big/little data logic, enhanced with geographic context and connections, can optimize the response and mitigate future issues. Geographic context can help organizations identify all stores where a potentially contaminated product is sold, and other potential contaminations associated with the supplier or source location also can be analyzed. Local health data can be sourced straight from community agencies so past outbreaks or clusters can be identified. Applying geographic context supercharges the value and benefit of data from sensor streams, static Helen Thompson is Director of Commercial Marketing at Esri. Over the past 20 years, Helen has applied her entrepreneurial and technological passion to create a better future through geographically relevant decision making. Geographic context is
- 34. central to some of society’s biggest opportunities and challenges, including climate change, risk reduction, driverless cars, 3D technology, and global interconnections. Helen is a recognized thought leader, keynote speaker, and expert on spatial theory and location platforms, using her knowledge to advance the understanding and use of spatial technology in business and society. PAGE 21 Sponsored by The Value of In-House Alliances in Adopting Location Analytics by Michael Goldberg Here’s what Cirque du Soleil knows about its typical ticket buyers in North America: They are between 35 to 55 years old. They live in households that earn
- 35. more than $100,000 per year. Just over half (52 percent) are female. And most of them won’t drive more than 60 minutes to see a show. That last data point is a critical one, said Axel Bedikyan, director of marketing intelligence and planning at Cirque du Soleil. The company sold 15 million tickets in 2012, but there is a big opportunity to grow: only 20 percent of North American consumers have seen a Cirque spectacle, in spite of broad market awareness. Bedikyan said his company needs to be smarter about making performances accessible to those prospective customers. Bedikyan was one of several speakers at the Esri Business Summit, held in July in San Diego. There, executives discussed the challenges involved in implementing location analytics. The biggest issue cited by Bedikyan, as well as by executives from retailers like Starbucks and Petco, was winning acceptance across their organizations for what analytics can do. This effort requires communicating with IT and business leaders
- 36. about the need to think differently about the data they collect and analyze for decision- making, like where to hold a performance or where to build a new store. For analytics champions inside an enterprise, “The magic does come when you find a BI or IT counterpart,” said Mark Smith, CEO and chief research officer at Ventana Research, during one of the sessions. It’s not enough for one business group to be a service center for another, Smith said, suggesting that such an arrangement would inhibit adoption. A proof- of-concept project to justify the ROI of analytics is a good tactic to win support, he added. Getting Others to Join the Analytics Circus At Cirque du Soleil, Bedikyan said he has sought to build alliances with marketers in the different units of the global company. For example, he showed his colleagues data that correlated the three locations of recent performances in the Dallas metropolitan area with the drive times to the particular venues. The analysis
- 37. showed that a 2011 show at Dr. Pepper Arena earned better results than a 2007 show at Fair Park and a 2012 performance at 500 Memorial Drive. The results matched demographic data that showed the Dr. Pepper location was a shorter drive for Cirque du Soleil’s typically affluent audience, he said. https://www.cirquedusoleil.com/ http://www.ventanaresearch.com/ PAGE 22 The Value of In-House Alliances in Adopting Location Analytics This kind of finding “provides a new hypothesis that we can go and test” in other locations, Bedikyan said. Bedikyan said the goal of such projects is to breed analytics champions within different business units, especially among marketing professionals, and he cited four factors to
- 38. successfully working with marketers: 1. Engage creatively with people who can become ambassadors in the business units. 2. Understand drivers and barriers for them to using analytics. There were people who might be interested in adopting analytics but hesitated. “As we went along, we came up with ways to help them use it,” Bedikyan said. 3. Start small. He suggested concentrating on one or two markets at first. Brainstorm with colleagues working there, and then spread ideas based on their experiences to other executives. 4. Get the analytics team staffed right to support the spread of analytics capabilities. “Quality is more important than quantity,” he said, adding that he had hired a person who has expertise in both marketing and geographic systems for his team based at headquarters in Montreal. Bedikyan said his campaign would continue. “We are just
- 39. starting our journey. Three years ago, we were blind. Today we are location aware,” he said. “We’re making this information enterprise- wide, if anyone from marketing or [other] executives wants to, they can pull up an update.” At Starbucks, BI Mixes with Location Analytics Patrick O’Hagan, a demographer at Starbucks Coffee who leads an analytics team, has taken a similar collaboration path but through a different door. O’Hagan has formed alliances with colleagues in the BI department, and the resulting work using Esri’s ArcGIS mapping software has spread “map intelligence” to functions including real estate, construction, facilities and design. Business needs have driven adoption of the tools, he said. “I had a partner in IT, but we never got prioritized,” said O’Hagan, strategy manager, portfolio strategy and market planning at Starbucks. “It took me working with a flexible person in the BI team” to make progress, he said. They started with small projects and
- 40. showed the results to others. And by working closely with BI professionals, it enables the practice of using location analytics to grow because colleagues will see fresh opportunities to use the tools. “You have to mesh GIS with all the analytics as a company,” he added. Participants at the conference said having strong internal partnerships is ideal for effective adoption of analytics, and the lack of such partnerships can stall efforts to build momentum. Shawn Hanna, the director of financial analysis and analytical services at Petco, the pet supplies retailer, uses location analytics in store site selections—the company was featured http://data-informed.com/data-driven-location-choices-drive- latest-starbucks-surge/ PAGE 23
- 41. The Value of In-House Alliances in Adopting Location Analytics in a 2010 case study using the technology—and to analyze merchandise sales by market locations. Hanna said that his analytics organization, based in the finance department at Petco, was working with colleagues in marketing and the company’s website to raise the profile of location analytics. “You can show where the flea and tick [product category] is doing well this time of year,” he said, while adding that his team is still working to build strong partnerships. Smith, of Ventana Research, said that there remains an organizational inertia at many enterprises when it comes to fields like location analytics. “If you look at a broader context, organizations have a conventional wisdom approach that says ‘We’ve always done it that way. Dashboards and reports make them prettier and it will
- 42. be fine.’ But it won’t be. Those are slower, and less satisfying to customers,” Smith said. “We have to continue to demonstrate there’s a better way of doing Michael Goldberg is an independent journalist, writer, and editor focusing on business management and technology topics, including big data analytics. http://www.esri.com/library/articles/petco-case-study.pdf PAGE 24 Sponsored by How Spatial Analysis Leads to Insight by Linda Beale and Andy Mitchell Spatial analysis is a process that starts by asking a question. Getting the question right is the key to working out what tools to use and what analysis to
- 43. employ toward deriving a meaningful answer. Being able to better understand your data should help you to make appropriate decisions about your analysis –and anticipate how your choices will affect the results. The web is now a source of vast amounts of data, and spatial analysis offers the means by which this data becomes valuable. As the value of analysis and spatial data gains adoption, methods and models for how to use analysis are becoming more widely available. Academics, professionals, communities, and individuals are all sharing their analytical techniques. These spatial data analysis practices cut across many disciplines. The applications are endless, and embracing a multidisciplinary approach to spatial analysis can bring significant rewards. Geographic information system (GIS) analysis helps you to make informed decisions, but it doesn’t make the decisions for you. Doing that requires your expertise. For example, you learn that multiscale web maps can require analysis to be done
- 44. at multiple scales since, for many aggregated datasets, the results are only relevant for the scale at which the analysis is performed. You’ll also need to learn to interpret results carefully – you should have an idea of the expected results and carefully check the analysis if the conclusions differ significantly. As more communities see the power that analyzing their data with location brings, GIS technology is being pushed to new levels. Data from disparate sources is being combined, and new information is revealing new patterns and insights. Even the concept of geographic space is undergoing a challenge, as we map data using both physical and social geographies. Web maps bring spatial data and the notion of spatial analysis to everyone. The idea that location matters is no longer just the geographer’s doctrine; its value has been widely recognized and embraced. Geography matters. How is Spatial Analysis Used? Ask questions, derive answers
- 45. Spatial analysis is used by people around the world to derive new information and make informed decisions. The organizations that use spatial analysis in their work are wide- ranging—local and state governments, national agencies, businesses of all stripes, utility companies, colleges and universities, NGOs—the list goes on. Here are just a few examples. PAGE 25 How Spatial Analysis Leads to Insight Transportation: The Portland Bureau of Transportation uses spatial analysis to reveal the pattern of accidents and their relationship to traffic corridors. Water quality: NOAA developed an analysis methodology that uses land cover as an indicator of water quality. Public health: This series of maps shows mosquito hotspots
- 46. week by week. The information helps East Flagler Mosquito Control District in Florida target its suppression efforts. https://pdx.maps.arcgis.com/home/signin.html?returnUrl=http% 3A//pdx.maps.arcgis.com/apps/MapSeries/index.html%3Fappid %3D28c26c3acc604f2cba87aff0fe7f7b24 http://noaa.maps.arcgis.com/apps/MapSeries/index.html?appid= e7eb6e9decb14c17a2fef4d36fee1714 https://www.arcgis.com/apps/MapSeries/index.html?appid=1d35 16dff91f46d09a4cb9693cbe4439&webmap=0ff4cb105a5f464ba9 c415d2937014ee PAGE 26 How Spatial Analysis Leads to Insight Urban planning: Kenton County, Kentucky, uses spatial analysis to map walkability in various communities and to identify gaps in sidewalk connectivity. Conservation: WWF mapped extreme weather events, rainfall, and drought in Brazil over
- 47. three decades. The trends and patterns help identify areas for future conservation projects. Agriculture: This app from World Resources Institute lets government agencies and private companies find sites that are suitable for sustainable palm oil production in Indonesia. http://nkapc.maps.arcgis.com/apps/MapJournal/index.html?appi d=45163688d3ed46f19a829c3a1496f557&webmap=4f03319a5da e4e12bfff309dfc7ee9a2 http://panda.maps.arcgis.com/apps/MapSeries/index.html?appid =d7e1af788d2741df86ef295e67fca182 http://www.globalforestwatch.org/map/3/15.00/27.00/ALL/grays cale/loss,forestgain?begin=2001-01-01&end=2015-01- 01&threshold=30 PAGE 27 How Spatial Analysis Leads to Insight Spatial Data and Spatial Analysis Most data and measurements can be associated with locations
- 48. and, therefore, can be placed on the map. Using spatial data you know both what is present and where it is. The real world can be represented as discrete data, stored by its exact geographic location (called “feature data”), or continuous data represented by regular grids (called “raster data”). Of course, the nature of what you’re analyzing influences how it is best represented. The natural environment (elevation, temperature, precipitation) is often represented using raster grids; whereas, the built environment (roads, buildings) and administrative data (countries, census areas) tend to be represented as vector data. Further information that describes what is at each location can be attached; these are often referred to as “attributes.” In GIS each dataset is managed as a layer and can be graphically combined using analytical operators. By combining layers using operators and displays, GIS enables you to work with these layers to explore questions and
- 49. find answers. In addition to locational and attribute information, spatial data inherently contains geometric and topological properties. Geometric properties include position and measurements, such as length, direction, area, and volume. Topological properties represent spatial relationships such as connectivity, inclusion, and adjacency. Using these spatial properties, you can ask even more types of questions of your data Excerpted from The ArcGIS Book: 10 Big Ideas about Applying Geography to Your World, Christian Harder, Editor. Copyright 2015 Esri. Reprinted with permission. The idea of stacking layers containing different kinds of data and comparing them to each other based on where things are located is the foundational concept of
- 50. spatial analysis. The layers are interlocking in the sense that they are all locked to true geographic space. (Image courtesy of NOAA). http://learn.arcgis.com/en/arcgis-book/ PAGE 28 Sponsored by Thomas Davenport Prescriptive Analytics Project Delivering Big Dividends at UPS by Thomas H. Davenport I recently attended the 2016 INFORMS Conference on Business Analytics and Operations Research in Orlando. INFORMS, the Institute for Operations Research and the Management Sciences, has historically had an Operations Research – that is, optimization of logistics and resources – focus, but the organization is slowly
- 51. branching out into other areas of analytics. A hallmark of this annual conference is the awarding of the Franz Edelman Award, which recognizes excellence in Operations Research and analytics in the public and private sectors that changes the involved organizations. I suspect that most readers have never heard of either Franz Edelman (who headed Operations Research at the no-longer-with-us RCA Corporation) or the award, but the Operations Research community takes it very seriously. I am somewhat marginal to the Operations Research gang – I view it as just another type of analytics. But the winners often set a great example for the rest of the world. That’s particularly true this year, when the winner was logistics and parcel delivery company UPS for its ORION project. ORION, an acronym that stands for On- Road Integrated Optimization and Navigation, is perhaps the largest commercial analytics project ever undertaken. It required well
- 52. over a decade to build and roll out, and more than $250 million of investment by UPS. At its peak, over 700 UPSers were working on change management and rollout of the system. So the company clearly went all in on this project. Because they won the award, you might guess that the company is receiving something in return for its investment and indeed it is. How about savings (in driver productivity and fuel economy) of between $300 and $400 million a year? How about 100 million fewer miles driven and a resulting cut in carbon emissions of 100,000 metric tons a year? You don’t see those levels of benefits from an analytics project very often, and these have been confirmed through intensive measurement and reported to Wall Street analysts. https://www.pressroom.ups.com/pressroom/ContentDetailsView er.page?ConceptType=Factsheets&id=1426321623549-553 https://www.pressroom.ups.com/pressroom/ContentDetailsView er.page?ConceptType=Factsheets&id=1426321623549-553 http://data-informed.com/how-big-data-is-helping-to-tackle- climate-change/
- 53. PAGE 29 Prescriptive Analytics Project Delivering Big Dividends at UPS What does ORION do? It’s basically prescriptive analytics for UPS’s 55,000 drivers in the United States (the international rollouts will come soon). Instead of following the same route every day, ORION analyzes the packages to be delivered that day and determines an optimal routing for the “package cars.” The drivers are told where to go next by their handheld computers. You also may be wondering why ORION was so expensive and took so long to roll out. There are two fundamental reasons: maps and change management. The optimization algorithm itself was difficult to develop, but that aspect of the work paled in comparison to the other two components. UPS had to develop its own maps to ensure that the drivers would be directed to the right place every time and to the correct location for package drop-off or
- 54. pickup. No commercially available maps could do that for the 250 million different locations to which UPS delivers. Secondly, imagine that you have to communicate and inculcate a new way of performing a core daily task to 55,000 workers. UPS devoted six days of training and support to each of the drivers. To their credit, most of the drivers wanted to know how the system worked before they would give up their time-honored routes, and so considerable effort was devoted to turning the “black box” algorithm into a “glass box.” Most of the drivers were enthusiastic about the new approach once they had experienced it. Jack Levis, the company’s Senior Director of Process Management who also leads the Operations Research and Advanced Analytics groups, led the ORION project and cites six factors as the reasons for ORION’s success: • Education. Education about the system took place at every level, from the CEO to drivers.
- 55. • Communication of the vision. Lots of effort went into explaining how the system would work and how it would add value. • Support from the top. As an indication of this, UPS’s CEO, David Abney, a former driver himself, was present at the INFORMS conference and testified to ORION’s value. • Quick wins. ORION really involved a series of smaller projects, each of which brought benefits. • Training and certification. These were a major component of the staffing and expense of the project, but absolutely necessary. • Measurement. The project maintained a dashboard down to the local district level about how the rollout was proceeding and the benefits achieved from adoption. Of course, it didn’t hurt that UPS has a long history of measurement and improvement
- 56. through industrial engineering. Many companies would have had to change their cultures in this direction before taking on a project like ORION, but UPS already had it. http://data-informed.com/future-big-data-prescriptive-analytics- changes-game/ http://data-informed.com/transform-culture-realize-big-datas- full-potential/ PAGE 30 Prescriptive Analytics Project Delivering Big Dividends at UPS And the benefits from ORION are only just the beginning of what UPS can realize. There is, of course, the global rollout of these tools. And to maintain a level of simplicity for drivers, ORION only optimizes routes at the beginning of the workday. More sophisticated programs down the road could re-optimize during the day, take traffic patterns into account, and even get one driver to exchange packages with another during their routes.
- 57. There aren’t many companies that have made bets on analytics to this degree. When I first began writing about them a decade ago, I referred to such companies as “analytical competitors.” When you invest in analytics at the level of hundreds of millions of dollars – and more importantly, deliver value at multiples of that sum – it’s safe to assume that you Tom Davenport, the author of several best-selling management books on analytics and big data, is the President’s Distinguished Professor of Information Technology and Management at Babson College, a Fellow of the MIT Initiative on the Digital Economy, co-founder of the International Institute for Analytics, and an independent senior adviser to Deloitte Analytics. He also is a member of the Data Informed Board of Advisers. http://data-informed.com/data-informed-board-advisers/ PAGE 31
- 58. Sponsored by Pokémon GO and Monetizing the Massive Value of Geolocation Data by Anshu Prasad and Arpita Ghosal Our abilities to collect and utilize geolocation data are evolving rapidly. Put simply, geolocation adds the “where” to the Internet of Things. Vast amounts of data are being generated from billions of location-aware sensors and Internet- enabled devices, including smartphones and tablets. This flood of new data, particularly when combined with other forms of big data, provides valuable information that can be intelligently mined to deduce patterns and uncover new insights. This immense potential is driving the development of new location-enabled products and services to enhance customer experiences and create new business opportunities.
- 59. Geolocation-enabled tools are just a part of an emerging ecosystem of advanced analytics tools. Fascinating new use cases are emerging regularly, catalyzing business innovation and prompting the development of new ways to monetize the value they generate. However, there are striking gaps between leaders and laggards in their ability to capture this value. Traditional companies operating on corporate timelines are typically unable to manage the pace of change required, let alone exploit or monetize it to maximum advantage. Pokémon GO Nowhere is this more evident than in the recent Pokémon GO phenomenon. This GPS- powered smartphone game uses augmented reality to blend the real and the digital worlds and tasks players to locate creatures and treasures as they navigate their physical neighborhoods. Perhaps because of its massive popularity and unprecedented adoption rate – within the first week of launch, Pokémon GO had more
- 60. daily users than Twitter and received more tweets than Brexit – the business world has been slow to appreciate its monetization value. One key aspect to appreciate is the network effect as ecosystem players beyond Niantic (the game developer) and Nintendo (the company with ownership rights to the characters) Anshu Prasad Arpita Ghosal http://data-informed.com/how-the-internet-of-things-changes- big-data-analytics/ PAGE 32 Pokémon GO and Monetizing the Massive Value of Geolocation Data capture value from Pokémon GO’s runaway success. Of course, Niantic is earning revenues from in-app purchases and Nintendo from licensing and collaboration fees. To underscore
- 61. the excitement the game has generated, Nintendo reported that $7.5 billion had been added to its market capitalization within a few days of the game’s launch. But it’s important to remember that Apple and Google also are generating revenues from their in-app marketing and sales as users continue to play the game. Retail locations, bars, and restaurants are trying to partner with Niantic to become “real-life locations” in the game and drive customer traffic to their businesses. There are also indirect effects being reported, with some players calling the game a disguised fitness app and claiming to lose as much as five pounds per week from the additional walking. Add to this the potential for game developers such as Niantic to open up new revenue streams through sales of their aggregated geolocation data to third parties interested in personalized marketing, and value creation possibilities expand considerably across the broader ecosystem. Apple’s in-app sales model provides another example to
- 62. appreciate the interdependence and reciprocity that benefits both Apple and broader ecosystem participants. In-app sales drive revenues for partners by providing access to Apple’s loyal customer base and a consistent user experience. In turn, Apple benefits from ecosystem partners providing its users a unique and ever expanding assortment of books, games, music, media, and storage services. Companies looking to capture value from geolocation data should consider these examples and look for data sources and monetization opportunities beyond those that directly benefit their enterprise. These may range from indoor and outdoor precision marketing solutions to location-based initiatives in the healthcare domain. Automotive sensor data can help manufacturers accelerate product design, improve vehicle performance, and enhance driver safety. Their dealer networks can use this same data to better target customers needing preventive maintenance or other services to enhance retention and build customer loyalty. Whether we consider the geolocation data alone or its
- 63. combination with supplemental data, the potential for companies to use this data to better engage customers is virtually limitless. Geolocation Data Challenges However, as with most rapidly growing technologies, and big data more broadly, effective use of geolocation data requires managing several risks and consistent challenges – namely capturing, cleansing, integrating, and storing huge volumes of complex data. Though the technology to capture and store vast amounts of data has grown rapidly over the past few years, ensuring data quality, especially in a real-time environment, remains a key challenge. Most organizations also need to develop the advanced data science capabilities required to analyze, visualize, and use geolocation insights. They also often struggle with how best to embed these insights into their strategic and operations decision-making processes. Using geolocation data also poses some specific additional challenges. Privacy and security
- 64. concerns associated with the capture, storage, and use of location data are concerns for companies, regulators, and users alike. Incidents already have been reported in which http://data-informed.com/how-to-navigate-data-privacy/ PAGE 33 Pokémon GO and Monetizing the Massive Value of Geolocation Data criminals have used geolocation data to lure victims to unsecure locations. Regulators and advocacy organizations have cautioned parents against allowing children to play games such as Pokémon GO unsupervised. Others have highlighted the extensive access and right of use to geolocation and other data that users sometimes unwittingly give app developers such as Niantic when accepting broad user-permission agreements as a condition to accessing the app. And corporate IT departments fight an unending battle to limit exposure of their
- 65. networks to data theft and other cybercrime by restricting employees from using corporate credentials to log in to apps and social platforms. Much like the technology landscape, perspectives on who should be held accountable for protecting the privacy and security of geolocation data are rapidly evolving. When data is aggregated from multiple third-party sources, ultimate accountability for security and data privacy becomes harder to determine. Companies must understand who owns the source data and whether users have provided affirmative opt-in authorization for its use. It’s also important to understand where direct consent may not be required – for example, an asset owner using telematics to track the location of commercial vehicles without direct consent from the driver – and to establish protocols accordingly. Companies looking to exploit geolocation data also need to stay informed about emerging regulations, which often differ by country. For example, the EU recently approved new rules on personal data protection, including usage of geolocation data.
- 66. U.S. lawmakers increasingly are introducing legislation intended to address privacy issues associated with the collection, use, and disclosure of geolocation information. Awareness of and compliance with multiple regulatory regimes likely will remain a necessity for companies exploring global uses for geolocation data. But even with the many challenges, the potential value to be unlocked from geolocation data means it is here to stay. And, given the innovation and pace at which new use cases are emerging, anticipating a diverse ecosystem with interactions between developers, data aggregators, data originators, regulators, and users will prepare new market entrants for the landscape they will need to navigate. Innovators will continue to invest in new data sources, analytics capabilities, talent, and processes to capture new business value. Regulators will play an increasingly important role in setting and monitoring data standards and guidelines. The various stakeholders will need to demonstrate a commitment to uphold privacy and
- 67. security standards to engender trust among the other ecosystem players. Ultimately, individuals will need to be better informed about how their choices and actions will shape the development of the next generation of innovations enabled Anshu Prasad is a partner with A.T. Kearney and leads the firm’s global Analytics Practice. He is based in New York and can be reached at [email protected] Arpita Ghosal is a consultant with A.T. Kearney Procurement and Analytic