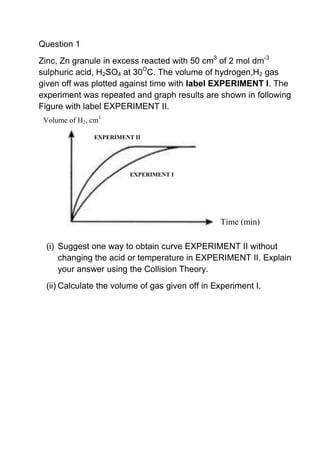
1. Question 1<br />Zinc, Zn granule in excess reacted with 50 cm3 of 2 mol dm-3 sulphuric acid, H2SO4 at 30OC. The volume of hydrogen,H2 gas given off was plotted against time with label EXPERIMENT I. The experiment was repeated and graph results are shown in following Figure with label EXPERIMENT II.<br />Volume of H2, cm3EXPERIMENT IEXPERIMENT IITime (min)<br />48722333071<br />(i)Suggest one way to obtain curve EXPERIMENT II without changing the acid or temperature in EXPERIMENT II. Explain your answer using the Collision Theory.<br />(ii)Calculate the volume of gas given off in Experiment I.<br />Question 2 Zinc, Zn powder in excess reacted with 50 cm3 of 2 mol dm-3 hydrochloric acid, HCl at 30OC. The volume of hydrogen,H2 gas given off was plotted against time with label EXPERIMENT I. The experiment was repeated and graph results are shown in following Figure with label EXPERIMENT II.<br />639623327076<br />Volume of H2, cm3EXPERIMENT IEXPERIMENT IITime (min)<br />(i)Suggest one way to obtain curve EXPERIMENT II without changing the zinc or temperature in EXPERIMENT II. Explain your answer using the Collision Theory.<br />(ii)Calculate the volume of gas given off in Experiment I.<br />Question 3<br />Zinc, Zn granule in excess reacted with 50 cm3 of 2 mol dm-3 sulphuric acid, H2SO4 at 30OC. The volume of hydrogen,H2 gas given off was plotted against time with label EXPERIMENT I. The experiment was repeated and graph results are shown in following Figure with label EXPERIMENT II.<br />793242339090<br />Volume of H2, cm3EXPERIMENT IEXPERIMENT IITime (min)<br />(i)Suggest one way to obtain curve EXPERIMENT II without changing the zinc, acid or temperature in EXPERIMENT II. Explain your answer using the Collision Theory.<br />(ii)Calculate the volume of gas given off in Experiment I.<br />Question 4<br />Zinc, Zn powder in excess reacted with 50 cm3 of 2 mol dm-3 hydrochloric acid, HCl at 30OC. The volume of hydrogen,H2 gas given off was plotted against time with label EXPERIMENT I. The experiment was repeated and graph results are shown in following Figure with label EXPERIMENT II.<br />946861-1485951<br />Volume of H2, cm3EXPERIMENT IEXPERIMENT IITime (min)(i)With changing the temperature in EXPERIMENT II. Explain your answer using the Collision Theory.<br />(ii)Calculate the volume of gas given off in Experiment I.<br />