The Quality of Accident Investigation in the tier-one Australian Construction Industry
•
0 likes•150 views

Primary research results in the quality of accident investigation conducted by Australian tier-one construction companies.

Recommended
Recommended
More Related Content
What's hot
What's hot (8)
Similar to The Quality of Accident Investigation in the tier-one Australian Construction Industry
Similar to The Quality of Accident Investigation in the tier-one Australian Construction Industry (20)
Recently uploaded
Recently uploaded (20)
The Quality of Accident Investigation in the tier-one Australian Construction Industry
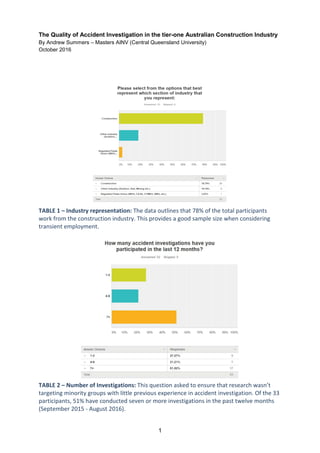
- 1. 1 The Quality of Accident Investigation in the tier-one Australian Construction Industry By Andrew Summers – Masters AINV (Central Queensland University) October 2016 TABLE 1 – Industry representation: The data outlines that 78% of the total participants work from the construction industry. This provides a good sample size when considering transient employment. TABLE 2 – Number of Investigations: This question asked to ensure that research wasn’t targeting minority groups with little previous experience in accident investigation. Of the 33 participants, 51% have conducted seven or more investigations in the past twelve months (September 2015 - August 2016).
- 2. 2 1. HST Manager 2. Super awesome HSE guy! 3. NSW Operations Manager of a safety consultancy 4. Safety Manager 5. WHS Manager 6. Safety Manager 7. Principal Safety Manager 8. Construction manager 9. Environmental Consultant 10. Safety Advisor 11. ANZ HSE Manager 12. HSE manager 13. General Manager EHS - International Businesses 14. Safety Advisor 15. WHS Consultant 16. Head of Safety 17. Group GM HSEQ 18. HS Manager 19. Principal Advisor – Safety 20. Senior Safety Advisor 21. Safety manager 22. Project Safety Manager 23. WHS & Risk Consultant 24. Safety Manager 25. Safety Manager 26. EHS Manager 27. Project Director 28. HSE Advisor 29. Safety Manager 30. Senior Safety Advisor 31. Construction Manager 32. Safety Manager 33. Ex-WorkSafe investigator TABLE 3 – Job title: With the exception of participants #8,9,27 & 31, the job titles of the research participants appear to come from a HSE background, equating to 29 (87%).
- 3. 3 TABLE 4 – Company size: 63% of the research participants comes from large Australian organisations who employ greater than 1001 employees. TABLE 5 – Historic employment: 57% of participants have worked for 3+ employers in the last 10 years
- 4. 4 TABLE 6 – Investigation methods: The result demonstrates that the investigation scenarios that are primarily conducted within the Australian construction industry vary, with only 15% equating to simple linear investigations. TABLE 7 – Employers investigation standards: A mixed result from participants with 48% agreeing that their company do accident investigations well, while 30% believing their company does not do accident investigations well.
- 5. 5
- 6. 6 TABLE 8 – Employers investigation techniques: This outlines that 84% of participant employers use the ICAM causation technique. TABLE 9 – Workplace investigation procedure: 21% of participants do not have a procedure or checklist for following/referring to when conducting accident investigations.
- 7. 7 TABLE 10 – Industry investigation standards: 40% of participants believe that the industry does accident investigations well. TABLE 11 – Peer reviewed investigations: 70% of the participants agree or strongly agree with accident investigation get reviewed and approved by peers.
- 8. 8 TABLE 12 – Quality assurance techniques: 84% of research participants agree that a minimal standard of quality should be met. TABLE 13 – Quality assurance training: This data represents the view that participants agree or strongly agree (80%) that a quality assurance process is needed in the curriculum for teaching causation techniques.
- 9. 9 TABLE 14 – Investigation training: 96% of participants have undertaken accident training to some extent. TABLE 15 – National investigation curriculum: It is agreed and strongly agreed (85%) that a national accident investigation curriculum should be in place for accident investigation training.
- 10. 10 TABLE 16 – Investigation facilitators: 100% of participants agree or strongly agree that facilitators of investigations should receive ‘appropriate’ training. TABLE 17 – Training by RTO’s: 64% of participants agree or strongly agree that accident investigator training should be done by Registered Training Organisations (RTO’s).
- 11. 11 TABLE 18 – Training duration: Short term Accident Investigation training equates to 45% of the participants overall training.
- 12. 12 TABLE 19 – Causation techniques: 84% of research participants have undertaken ICAM training, with TapRoot and Why Tree coming in 2nd and third respectively.
- 13. 13 TABLE 20 – Transient employment: 26 research participants (78%) agree or strongly agree that prescribed accident investigation techniques would assist the transient construction worker. TABLE 21 – Prescribing fundamentals: 66% of participants either agree or strongly agree that in order to get consistent quality investigations, that the WHS legislation should prescribe fundamental investigation obligations.
- 14. 14 TABLE 22 – If not, Why not: The “if not, why not” clause was supported by 64% of research participants either agreeing or strongly agreeing. TABLE 23 – Minimum standards: 80% of participants either agree or strongly agree that minimum accident investigation fundamentals should be reported on a prescribed template to ensure certain event information is investigated.
- 15. 15 TABLE 24 – Completing investigations: The proposed idea of having an approved accident investigator from a PCBU who would maintain accreditation so that a quality standard could be met had 33% of respondents disagree or strongly disagree to the idea. TABLE 25 – Amending legislation: Prescribing WHS legislation with minimum standards was agreed or strongly agreed with 73% of participants.
- 16. 16 TABLE 26 – Investigation photos: 87% of research participants agree or strongly agree that incident scene photographs with added commentary helps explain accident causation. TABLE 27 – Logic diagrams: 79% of participants agree or strongly agree with the belief that logic diagrams help explain causation logic, with 0% believing the contrary.
- 17. 17 TABLE 28 – Causation logic: Supporting table 26, 60% of research participants include logic diagrams to help explain logic in their investigations. TABLE 29 – Benefits of Logic Diagrams: 66% of participants say yes to logic diagrams being needed to demonstrate logic in accident investigation reports.
- 18. 18 TABLE 30 – Participant perspectives: 87% of participants believe that Root cause can occur multiple times within an event of an accident, with 18% disagreeing or strongly disagreeing with this claim.
- 19. 19 1. Root Cause is the basic cause or the fundamental problem that resulted in the incident to occur. If we are talking about energies, it is the path that allowed the energy to result in an incident or event. 2. An underlying condition or set of conditions that allowed the proximal causes of an incident to develop. 3. The underlying system failure that permitted the failures/errors to occur that lead to the event. The fifth of the five whys 4. Identifying a reason that an incident occurred 5. One event that led to an incident occurring. 6. The fundamental cause, or causes, of an event or chain of events 7. My interpretation of root cause is the main cause of a particular incident. There may have been other contributing factors that lead up to a specific incident, but there was a specific cause that resulted in an incident 8. To find the key reason or more likely reasons why an accident or incident has taken place. 9. A viewpoint of the factors leading to an incident at a given point of time 10. Is the main cause after an incident occurred based on the investigation 11. Deeply embedded faults within an organisations or an individuals practice or process that if unfetted can peculate to more likely cause or contribute to incidents 12. If controlled the event would not have happened 13. Identification of the primary cause/s of the event - those that if did not occur, would have prevented the event from occurring. 14. The original causal factor that sets off a series of other causal factors, which align to create an event. 15. The last failure that occurred resulting in release of energy, could have many contributing factors 16. A misnomer as there are normally several causes if you dig deeply enough 17. . (no answer) 18. When the money runs out or we stop looking. Absence of best practise. 19. The primary causation of the event. 20. What directly caused the accident to occur 21. there is often more than one cause of an incident, as such i don’t think the root cause term adds merit 22. Root cause is a meaningful cause that leads to a sequence of events. Without the root cause the event wouldn’t have occurred. 23. Identifying the systemic, management actions or behaviours which existed as the underlying cause which created a situation for the event to occur 24. It’s the fundamental reason for the occurrence 25. The primary cause leading to the incident/near hit. 26. Drilling down to the actual cause which may not associated with site conditions 27. Fundamental reason for the occurrence 28. Failure of system that caused incident 29. Underlying reason/s that set the environment prior to or at the time of the incident 30. The basic definitive reason as to why the event happened 31. What is the one element, which if it did not exist, the incident would not have occurred. 32. The thing or thing that management has control over that if in a correct state, will not lead to an incident. 33. Not applicable in my methodology TABLE 31 – Root cause: The research participant’s responses on their interpretation of the meaning of root cause.