More Related Content
Similar to ASEE Metal Impingement paper 50 final
Similar to ASEE Metal Impingement paper 50 final (20)
ASEE Metal Impingement paper 50 final
- 1. 2016 ASEE Southeast Section Conference
© American Society for Engineering Education, 2016
Metal Impingement Erosion Laboratory Experience
Stephen Hill, Ph.D., Gustavo Bodstein, Andre Eggert and Pedro Rosa
Mercer University/ Universidade Federal do Paraná/Milwaukee School of Engineering/University of Alabama
Abstract
Metal impact erosion is a common problem in the world today. This erosion is caused by the
impingement of solid particles that are carried in a transport fluid on to a metal surface.
Depending on the hardness of the metal and intensity of the impact determine the magnitude to
the erosional process. A group of international students from the Brazil Scientific Mobility
Program (BSMP) were brought together with no knowledge on the topic of impact erosion.
They were placed together on an engineering team and through a ten week experimental project;
these students were exposed to impact erosion on various metals using a custom designed
erosion apparatus. This experimental study allowed the students to compare the obtained data to
published results as well as become familiar with industry standard testing procedures. What is
presented is a summary of the student’s learning experience with respect to the science of
impingement erosion.
Keywords
Laboratory experience, erosion, testing, fluid flow
Introduction
Erosion of metal components when exposed to sand laden slurries continue to be a problem in
many industries1
. The cost associated with replacement of eroded parts and the downtime
needed when replacing these components often result in large losses to corporations. The ability
to model erosional effects on metal components accurately can aid in the reduction of the cost
associated with the losses by allowing these metal components to be placed in optimal locations
and to allow for replacement to occur before catastrophic failure occurs. After a senior design
team built a custom liquid/solid impact erosion test fixture, a group of students from the Brazil
Scientific Mobility Program (BSMP) were brought together from different universities around
the states to use the apparatus and examine the effect of erosion on different metals. The BSMP
is a one-year, non-degree program for Brazilian students to study in the United States. BSMP is
part of the Brazilian government's larger initiative to grant Brazilian university students the
opportunity to study abroad at US colleges and universities, by offering scholarships to students
in the Science, Technology, Engineering and Mathematics (STEM) fields. After completion of
an academic year including a summer internship, students return to Brazil to complete their
degrees. Three students accepted the program to come and perform research at Mercer
University. All were at different Universities and no experience in regards to the project and
testing that they were about to undertake. The purpose of this project was to expose the students
to a research experience in a 10-week session concerning liquid/solid impact erosion.
- 2. 2016 ASEE Southeast Section Conference
© American Society for Engineering Education, 2016
Background
Erosion has been studied by many researchers over the years. Ambrosini et al2
study the erosion
behavior of AISI 4140 steel under various heat treatment conditions. Harsha et al3
carried out
research to study the erosion behavior of ferrous and non-ferrous materials and compared the
data to various published data and models. Hutchings4
developed erosion models for normal and
oblique angle for various materials and determined the process that causes erosions during the
impact events. These include micro ploughing, small craters of indentation, and micro-
cracking5
. Many others took these models and improved upon them via testing 5-11
. The
common thread between these models and predictions are the ability to run experiments to test
the impact of erosion.
The testing methods are comprised of pneumatic systems and slurry flow systems. Two main
types of solid particle erosion testing equipment exist: the centrifugal tester or the injector tester.
The centrifugal is based on the projection of particles through centrifugal forces. The particles
are fed through the center of a rotating disk accelerated through radial ceramic tubes and ejected
onto samples placed around the disk12
. The second is the most frequently used type testing
system. It is based on specifications found in the ASTM standard G76. The particle velocity and
particle feed rates need to be measured and controlled before or during testing. The standard test
consists of exposing the sample surface for a fixed total mass of powder and evaluating the
amount of volume or mass loss. The erosion rate of the tested sample is calculated by dividing
the worn volume by the total mass of particles that have impacted the surface13
.
However, this investigator is interested in the differences between the gas injector studies and
actual erosion rates observed in liquid/solid environments. Hence, the students were tasked with
running various experiments on metal samples using water as the carrier fluid and 20/40 sand as
the particulate solid. The 20/40 refers to the mesh sizes that the sand is sieved between and
corresponds to sizes 0.017-in and 0.033-in, such that most sand grains are between those two
sizes. The students were just expected to run a set number of tests and if time allowed compare
to some published data of similar erosion tests. The idea here is that since the fixture had not
been fully validated, that comparison studies were needed if this device would be used in any
scientific studies. At any rate during the process the students gained knowledge and insight on
the aspects of testing, erosion, and computational fluid dynamics.
Test Apparatus
The testing apparatus for the students is the erosion test fixture that was designed by a Senior Design
group at Mercer University during the previous two semesters. At Mercer University, seniors
complete a two semester senior design sequence where they must first determine a project and
perform the analysis of building the project and secondly executing the manufacturing and testing of
the apparatus. The design group constructed the erosion test fixture with the components listed in
Table 1 and a schematic of the test fixture shown in Figure 1.
- 3. 2016 ASEE Southeast Section Conference
© American Society for Engineering Education, 2016
Table 1: Erosion Test Fixture Components
Sand Input Method Auger System
Pump Selection Double Diaphragm
Controller Type Arduino Mega 2560
Motor Type Brushless DC NTM Prop Drive Series 35-36A
Display Screen LCD Screen
Figure 1: Erosion Test Fixture
This device consists of a settling tank, a sand hopper, pump, nozzle, and auger to deliver the sand
and water to the test piece contained in the tank. The pump is a double diaphragm pump that is
connected to air pressure within the lab. The air pressure in the lab is adjusted to control the
flow rate via an air regulator on the pump itself. The pump will provide the same pressure to the
fluid as the air supply it is connected. The fluid is pumped through PVC piping to both the sand
hopper and to PVC piping that is connected to the nozzle. The line into the sand hopper fluidizes
the sand particles inside of the tank and balances the pressure between the two lines. A bronze
auger, Figure 2, rotates and pushes the sand/water slurry from the tank into a junction where the
fluid from the clean water line is flow freely.
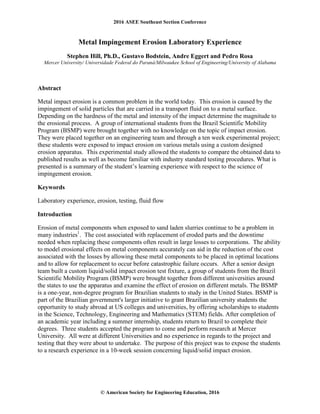
Figure 2: Bronze Augers
This happens at a vertical section of piping that is directly above the nozzle exit. The nozzle is
contained in a metal sleeve and down inside of the tank beneath the sand hopper shown in Figure
3. The nozzle can be run either out of the water or beneath the water when impinging on the
metal sample.
Item Number Part Description
1 Auger
2 Control Box
3 Diaphragm Pump
4 Frame
5 Sand Hopper
6 Settling Tank
- 4. 2016 ASEE Southeast Section Conference
© American Society for Engineering Education, 2016
Figure 3: Manifold from Hopper to Nozzle
The nozzles in the systems are sand blasting nozzles used in a commercially available deadman
sand blasting valve and were purchased from a local hardware store. The ID of the nozzle was
checked periodically to ensure that diameter had not increased. Once erosion was seen present on
the nozzles, they were removed from the testing apparatus and a new nozzle was added in place.
Figure 4: Ceramic Sand Blasting Nozzle
The entire apparatus is placed on a steel framed covered with a sheet of treated plywood and
covered with a waterproof mat. This platform will support all of the system components,
connections and allow ease of access for maintenance and operation. One power cord to a
standard AC outlet and a connection to an air supply capable of supplying 100 psi is all that is
needed to operate the device. The entire device is shown in Figure 5.
- 5. 2016 ASEE Southeast Section Conference
© American Society for Engineering Education, 2016
Figure 5: Erosion Test Fixture
A control box is located on the stand that is used to control the motor via an Arduino mega 2560
microcontroller hidden in the box. LCD display on the box show the pump pressure and the
motor RPM percentage during operation. The motor is a Brushless DC NTM Prop Drive Series
and was connected to a gear transmission to step down the motor 8.3:1. The gear assembly is
shown below in Figure 6.
Figure 6: Transmission Assembly
Samples are placed on the sample holder, Figure 7. The sample holder has attachments that
allow the angle of the sample to be varied from 30o
, 45o
, 60o
, and 90o
from the vertical axis
where the nozzle is ejecting a mixture of sand and water.
- 6. 2016 ASEE Southeast Section Conference
© American Society for Engineering Education, 2016
Figure 7: Sample Holder
Experimental Procedure
Students were tasked with testing aluminum and steel samples under specified conditions. Both
metals were obtained from local mills with the specifications provided. The type of aluminum
used was 6061 and the steel used was 4140 steel. Sample coupons were prepared for testing by
cutting the bar stock in 3-in by 3-in coupons. In some cases, the bar stock thickness was reduced
via grinding or a milling operation. After discussing the project with the students, a set of
parameters were listed that could be investigated. The parameters studied were:
• Angle of Impact: 30o
, 45o
, 60o
, and 90o
from the vertical axis of the nozzle
• Metal Type: Aluminum and Steel
• Sand Volume: 2,000 ml, 4,000 ml, 6,000 ml, 8,000 ml, and 10,000 ml
• Specimen and nozzle under water and/or Specimen and nozzle out of water
• Air Pressure: 80, 90, and100 psi
• Nozzle Size: 0.157-in ceramic used for sand blasting applications
With 17 variables listed this meant that 240 experiments would need to be run in order to
complete the full matrix. After a little discussion the air pressure variation was reduced to 90 psi
only which resulted in 80 trials. This was achievable during the time allotted along with some
repetition of test to verify results.
The instructor met with the students the first day to explain the experiments and to demonstrate
the necessary equipment to run each test. Operating manuals were given to the students for the
erosion test fixture and other equipment needed to move forward. Students were expected to
determine the time needed to perform the aforementioned tests and allow time for retests. All
relevant data was captured in a project management database, BASECAMP. BASECAMP is a
project management tool free for academic usages to help with scheduling, data storage, and
reporting. BASECAMP can be found on the web at www.basecamp.com. The team worked out
a matrix for testing and together with the instructor worked out an experimental procedure to
- 7. 2016 ASEE Southeast Section Conference
© American Society for Engineering Education, 2016
follow for testing. The only inputs from the instructor were slight changes in priority of some
tests and repeating select tests to ensure the data collected was consistent.
The experimental plan is shown below:
• Using bar stock provided, test hardness in a few locations to ensure the values meet the
specifications provided.
• Cut samples to correct size for testing
• Label metal sample with number.
• Obtain mass/weight of sample using scale pre-experiment
• Place sample on sample holder at desired angle
• Fill setting tank with water.
• Connect Air to Pump and set air pressure to test value.
• Circulate water through PVC lines with sand hopper isolated from main line at low rate.
• Load desired amount of sand into sand hopper
• Replace top seal of sand hopper and open relief valve at the top of the hopper to allow air
to escape while filling with water.
• Fill hopper with water until water comes out of relief valve and then close.
• Set valves in proper test position and circulate water only
• Initialize motor from control box
• Open valve that isolates the sand/water slurry mixture from main line
• Turn on motor and set at predetermined RPM for test.
• Run test until sand is completely out of sand hopper.
• Remove sample and label with date, time, and orientation
• Flush system completely
• Dry sample and obtain weight/mass on scale.
• Attempt to measure the dimensions of the eroded piece.
Uncertainty, safety, and data collections procedures were discussed and other general questions
answered. After watching the students complete a few sample tests, they were left to accomplish
the aforementioned tasks. To run one sample took on average 10 to 15 minutes, with about 1 to
2 hours of pre-test preparation and post-test cleaning. Needless to say sand in a workspace
leaves a mess and more importantly without cleaning the system properly, damage and skewed
results can occur.
After running multiple tests, the students determined the following data was actually
measureable and reportable on a per test basis:
• Sample Mass before test
• Sand Volume before test
• Sample Mass after test
• Some dimensions of eroded spot, but this became more difficult
• Test duration
• Flow pressure
• Observations during tests
- 8. 2016 ASEE Southeast Section Conference
© American Society for Engineering Education, 2016
Student Learning
After a few tests, the students started reducing the time for pretest and post-test activities. They
were able to discover more efficient ways of ensuring the lines and tank were clean. This
included changing the valve sequencing to the flushing procedure. They were aggressive with
the number of tests run per day initially, and once they figured out the actual time needed per
test, they were able to easily proceed through the matrix. After some of the initial tests, it
became evident that the uncertainty of the scale used to measure the weight before and after
testing was larger than the mass loss in some cases. So the students sought out more accurate
scales to use. Also since it was three students working together, the students were able to
perform the tests very efficiently.
When comparing the work ethic and preparedness to traditional undergraduate students at
Mercer University, they could be ranked in the top third using the same rubrics used in typical
assessment techniques for a lab based class. Communication and writing skills would lag behind
since English is not their native language, but scientific approach and thoroughness would allow
them to be rated slightly higher than traditional students in the same year of schooling.
Actual student performance was measured via the experimental plan, test performance, data
analysis, weekly reports, and group poster at the end of the project. The students separated the
work load and provided more than adequate information for each assessed group listed. Some of
the work is presented in the next section.
Experimental Data
The students looked at the difference of angle of impact on each type of metal. The first two
plots shows the variance of angle on the magnitude of the erosion. Figure 8 shows the erosion
amount increasing to an angle of about 60o
and then decreasing as the erosion sample became
normal to the nozzle with an aluminum sample. While in Figure 9, the steel had its maximum
erosion at 45o
and then decreased.
- 9. 2016 ASEE Southeast Section Conference
© American Society for Engineering Education, 2016
Figure 8: Mass Lost with Aluminum
Figure 9: Mass Loss with Steel
Hutchings has a plot in his paper that shows what is to be expected from erosion versus angle for
brittle versus ductile metals, Figure 10. The data in this study agrees with that plot qualitatively;
however, the angle of maximum erosion does not match the plot.
0
0.05
0.1
0.15
0.2
0.25
0.3
0.35
0 20 40 60 80 100
MASSLOST(G)
ANGLE OF IMPACT
Mass Lost (Aluminum out Water)
2000 ml of sand 4000 ml of sand 6000 ml of sand
8000 ml of sand 10,000 ml of sand
0
0.05
0.1
0.15
0.2
0.25
0.3
0 20 40 60 80 100
MASSLOST(G)
ANGLE OF IMPACT
Mass Lost (Steel out of water)
2000 ml of sand 4000 ml of sand 6000 ml of sand
8000 ml of sand 10,000 ml of sand
- 10. 2016 ASEE Southeast Section Conference
© American Society for Engineering Education, 2016
Figure 10: Erosion Dependence on Angle14
Some of this is due to uncertainty of the measurements obtained. Other reasons that the data
does not completely match is probably due to using liquid/solid flow versus gas/solid flow.
Regardless, this illustrates the type of information that can be used and obtained with the test
apparatus.
Another interesting observation occurred, when the samples and nozzle were both submerged in
the water, the maximum point of erosion becomes the minimum point of erosion with both
metals. These tests were repeated with similar results. Representative plots are shown in
Figures 11 and 12. The thought here was that due to the nozzle being submerged, the velocity of
the sand particles was decelerated. And the liquid layer acted as a buffer from the erosion.
Figure 11: Mass Loss with Aluminum
0
0.05
0.1
0.15
0.2
0.25
0 20 40 60 80 100
MASSLOST(G)
ANGLE OF IMPACT
Mass Lost (Aluminum in Water)
2000 ml of sand 4000 ml of sand 6000 ml of sand
8000 ml of sand 10,000 ml of sand
- 11. 2016 ASEE Southeast Section Conference
© American Society for Engineering Education, 2016
Figure 12: Mass Loss with Steel
The reason the maximum changes to a minimum is a little confusing and needs to be studied
further too really understand why this transition occurred. Some of the eroded pieces were
measured using a Keyence one shot 3-D Measuring Macroscope VR-3200. This device
measures light as it bends over the geometry as a profilometer would use a stylus to measure the
imperfection. Using this device, the actual volume measurement of lost material can be
measured to determine an erosion rate.
Figure 13: Image and Measurement of Erosion
0
0.02
0.04
0.06
0.08
0.1
0.12
0.14
0.16
0.18
0 20 40 60 80 100
MASSLOST(G)
ANGLE OF IMPACT
Mass lost (Steel in Water)
2000 ml of sand 4000 ml of sand 6000 ml of sand
8000 ml of sand 10,000 ml of sand
- 12. 2016 ASEE Southeast Section Conference
© American Society for Engineering Education, 2016
This information together can be used to create erosion rates versus impact angles and fully
compare to published data. This is just a small sample of the data collected and analyzed. This
data will be compared to published data of steel and aluminum as part of another study within
the coming year and hopefully published in a technical journal once the trends are fully
understood. The purpose here is to illustrate the value of the learning experience of both
students and faculty in these situations.
Conclusions
The students involved in this study essentially went from having very little experimental
background to being able to fully perform complex tests with no aid within a very short time
frame. They were able to develop experimental test matrix determine number of tests needed to
be run and towards the end of the research period, identify items that either needed to be retested
or improved. They were able to analyze the data obtained and present the data in a form that was
easy for most to understand. Although the data has not been fully compared to other researchers
published work at this time that is not the goal of this paper. The goal was to show the learning
experience obtained from the research experience and to show that the experimental apparatus
can be used in more advanced research studies. The data that was obtained when both the
sample and nozzle were submerged in water may be an anomaly, but one that should be
investigated further with another group at the same conditions as these test and at higher
pressures and flowrates. Overall, the methodology that was used by the students illustrates the
ability to use the testing apparatus designed by students for actual research in the field of erosion.
Acknowledgements
We would like to thank Evan Etinge of Keyence Corporation for measuring the eroded samples
using the VR-3200.
References
1. Humphrey, J.A., “Fundamentals of fluid motion in erosion by solid particle impact”, Int. J. Heat and Fluid
Flow, 1990, 170–190.
2. Ambrosini L and Bahadur S., “Erosion of AISI 4140 Steel”, Wear, 1987;117, 37-48
3. Harsha A.P. and Bhaskar, D.,”Solid Particle Erosion Behavior of Ferrous and Non-ferrous Materials and
Correlations of Erosion Data with Erosion Models”, Materials and Design, 2008; 29, 1745-1754.
4. Hutchings I. M., Tribology: Friction and Wear of Engineering Materials, Edward Arnold, London, 1992.
5. Camacho-Laguna, Juan, Torres-Vite, M., Hernandez-Gallardo, E, and Cardemas-Vera, E, “Solid Particle
Erosion on Different Metallic Materials”, Tribology in Engineering, 2013, 63-78.
6. Oka, Y, Ohnogi, H, Hosokawa, T, and Matsumura, “The Impact angle dependence of erosion damage
caused by solid particle impact”, Wear, 1997; 203-204, pp.573-579.
7. Tabakoff, W and Metwally, M, “Coating effect on Particle Trajectories and turbine blade erosion” ASME
Cogen-turbo proceedings, 1991, vol 6.
8. Finnie, I., “Some Reflections on the past and future of erosion”, Wear, 1997,186-187, 1-10.
- 13. 2016 ASEE Southeast Section Conference
© American Society for Engineering Education, 2016
9. Levy A. V. and Chik P., “The Effects of Erodent Composition and Shape on the Erosion of Steel”, Wear
1983; 89, 151-162.
10. Liebhard M. and Levy A., “The Effect of Erodent Particle Characteristics on the Erosion of Metals”, Wear
1991; 151, 381-390.
11. Shirazi, S.A., Shadley, J.R., McLaury, B.S., Rybicki, E.F., "A Procedure to Predict Solid Particle Erosion
in Elbows and Tees," Journal of Pressure Vessel Technology, Vol. 117, 1995, pp. 45-52.
12. Bousser et al., Solid Particle Erosion Mechanism of Protective Coatings for Aerospace Applications,
Surface and Coating Technology, (2014).
13. ASTM-G76, ASTM International, West Conshohocken, PA, 2007. 6.
14. I.M. Hutchings, Tribology: friction and wear of engineering materials, CRC Press, London, 1992. 273.
Stephen Hill Ph.D.
Stephen Hill received his doctorate from Georgia Institute of Technology in 1999. He is
currently an associate professor in the School of Engineering at Mercer University. He worked
for the oilfield services giant Schlumberger for 14 years before returning to academia in 2013 to
pursue his goal of educating the next wave of engineers entering the work force. His experience
in the work force was in product development of downhole tools related to the extraction of oil
and natural gas from various reservoirs. His current research interest includes impact erosion,
two phase flow phenomena, solid/liquid phase change, and highly ionized plasma.
Gustavo Vieira Bodstein
Gustavo Vieira Bodstein is a Mechanical Engineering Student at the Universidade
Federal do Paraná in Brazil. He studied in the United States via the Brazil Scientific
Mobility Program at Saint Cloud State University in Minnesota through the 2014-2015
academic year and is back in Brazil.
André do Nascimento Eggert
André do Nascimento Eggert is a Mechanical Engineering Student at Escola Superior de
Administração, Marketing e Comunicação de Sorocab in Brazil. He is in his junior year and
currently studying at the Milwaukee School of Engineer in Milwaukee, WI through the Brazil
Scientific Mobility Program.
Pedro Gomes Vieira Rosa
Pedro Henrique Gomes Vieira Rosa is a Metallurgical Engineering Student at Pontificia
Universidade Catolica de Minas Gerais, in Brazil. He is in his sophomore year and is a part of
the Brazil Scientific Mobility Program at the University of Alabama at Tuscaloosa.