
Recommended
More Related Content
What's hot
What's hot (18)
Viewers also liked
Viewers also liked (20)
More from andreagoings
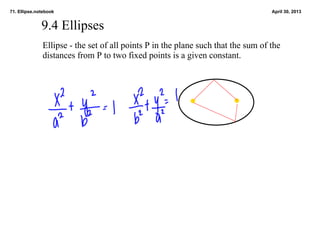
Lesson 71
- 2. 71. Ellipse.notebook April 30, 2013 Longer side major axis Fixed points foci Standard form x2 y2 a2 b2+ = 1 a or b = half length of x or y 1. x2 y2 25 9 + = 1 Maj axis __ Vertices of Maj __________ Min axis __ Vertices of Min __________ x 2 y 2 b 2 a 2+ = 1