Разработан первый полевой тест на марихуану
•
0 likes•20,359 views

Разработан первый полевой тест на марихуану

Recommended
Recommended
More Related Content
Similar to Разработан первый полевой тест на марихуану
Similar to Разработан первый полевой тест на марихуану (20)
More from Anatol Alizar
More from Anatol Alizar (20)
Recently uploaded
Recently uploaded (20)
Разработан первый полевой тест на марихуану
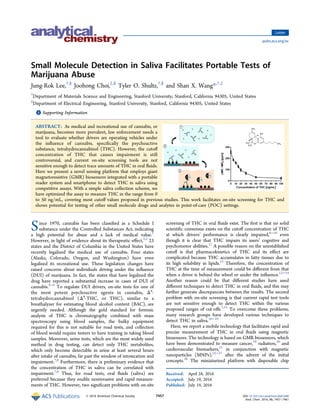
- 1. Small Molecule Detection in Saliva Facilitates Portable Tests of Marijuana Abuse Jung-Rok Lee,†,§ Joohong Choi,‡,§ Tyler O. Shultz,†,§ and Shan X. Wang*,†,‡ † Department of Materials Science and Engineering, Stanford University, Stanford, California 94305, United States ‡ Department of Electrical Engineering, Stanford University, Stanford, California 94305, United States *S Supporting Information ABSTRACT: As medical and recreational use of cannabis, or marijuana, becomes more prevalent, law enforcement needs a tool to evaluate whether drivers are operating vehicles under the influence of cannabis, specifically the psychoactive substance, tetrahydrocannabinol (THC). However, the cutoff concentration of THC that causes impairment is still controversial, and current on-site screening tools are not sensitive enough to detect trace amounts of THC in oral fluids. Here we present a novel sensing platform that employs giant magnetoresistive (GMR) biosensors integrated with a portable reader system and smartphone to detect THC in saliva using competitive assays. With a simple saliva collection scheme, we have optimized the assay to measure THC in the range from 0 to 50 ng/mL, covering most cutoff values proposed in previous studies. This work facilitates on-site screening for THC and shows potential for testing of other small molecule drugs and analytes in point-of-care (POC) settings. Since 1970, cannabis has been classified as a Schedule I substance under the Controlled Substances Act, indicating a high potential for abuse and a lack of medical value.1 However, in light of evidence about its therapeutic effect,2,3 23 states and the District of Columbia in the United States have recently legalized the medical use of cannabis. Four states (Alaska, Colorado, Oregon, and Washington) have even legalized its recreational use. These legislation changes have raised concerns about individuals driving under the influence (DUI) of marijuana. In fact, the states that have legalized the drug have reported a substantial increase in cases of DUI of cannabis.4−6 To regulate DUI drivers, on-site tests for one of the most potent psychoactive agents in cannabis, Δ9 - tetrahydrocannabinol (Δ9 -THC, or THC), similar to a breathalyzer for estimating blood alcohol content (BAC), are urgently needed. Although the gold standard for forensic analysis of THC is chromatography combined with mass spectroscopy using blood samples, the bulky equipment required for this is not suitable for road tests, and collection of blood would require testers to have training in taking blood samples. Moreover, urine tests, which are the most widely used method in drug testing, can detect only THC metabolites, which only become detectable in urine at least several hours after intake of cannabis, far past the window of intoxication and impairment.7,8 Furthermore, there is preliminary evidence that the concentration of THC in saliva can be correlated with impairment.7,9 Thus, for road tests, oral fluids (saliva) are preferred because they enable noninvasive and rapid measure- ments of THC. However, two significant problems with on-site screening of THC in oral fluids exist. The first is that no solid scientific consensus exists on the cutoff concentration of THC at which drivers’ performance is clearly impaired,8−10 even though it is clear that THC impairs its users’ cognitive and psychomotor abilities.11 A possible reason on the unestablished cutoff is that pharmacokinetics of THC and its effect are complicated because THC accumulates in fatty tissues due to its high solubility in lipids.12 Therefore, the concentration of THC at the time of measurement could be different from that when a driver is behind the wheel or under the influence.12−14 Another reason could be that different studies have used different techniques to detect THC in oral fluids, and this may further generate discrepancies between the results. The second problem with on-site screening is that current rapid test tools are not sensitive enough to detect THC within the various proposed ranges of cut-offs.7,15 To overcome these problems, many research groups have developed various techniques to detect THC in saliva.16−18 Here, we report a mobile technology that facilitates rapid and precise measurement of THC in oral fluids using magnetic biosensors. The technology is based on GMR biosensors, which have been demonstrated to measure cancer,19 radiation,20 and cardiovascular biomarkers,21 in conjunction with magnetic nanoparticles (MNPs),22−27 after the advent of the initial concepts.28 The miniaturized platform with disposable chip Received: April 28, 2016 Accepted: July 19, 2016 Published: July 19, 2016 Letter pubs.acs.org/ac © 2016 American Chemical Society 7457 DOI: 10.1021/acs.analchem.6b01688 Anal. Chem. 2016, 88, 7457−7461
- 2. cartridges incorporates Bluetooth communication protocols, which enable POC measurement and compatibility with any types of smartphones or laptops equipped with Bluetooth ports (Figure 1A). The GMR biosensor chip consists of 80 sensors that can be individually functionalized for multiplex assays (Figure 1B). A new concept of toroidal core coil for applying an external magnetic field and a compact design of circuit board reduced power consumption significantly and improved the portability of the device (Figure S1). To measure small molecules such as THC (molecular weight, 314.5 Da), we employed competitive assays instead of traditional sandwich assays, as demonstrated previously,16 because the small molecules usually lack two binding sites (i.e., epitopes) required for the sandwich assays.29,30 Even though these molecules have sufficient epitopes for binding to two antibodies, the sandwich cannot be formed due to steric hindrance. Our competitive assay requires only one type of antibody that can recognize THC and link MNPs to the bound THC on the surface of the biosensor via biotin−streptavidin interaction (Figure 1C). The biotinylated antibodies were added to the sample of interest that contained THC and incubated for 15 min to bind to THC in the sample as preincubation (details in Supporting Information). Then, 50 μL of the mixture were added to the chip where bovine serum albumin (BSA) and THC conjugated with BSA (THC-BSA) were immobilized on different sensors to allow unoccupied antibodies to bind to THC-BSA on the sensors for an additional 15 min. After washing the chip, the chip cartridge was inserted into the measurement reader, and 40 μL of streptavidin-coated MNPs were introduced. The stray field from the bound MNPs disturbs the magnetization of biosensors underneath, which changes the resistance of the biosensor. The changes in resistance, monitored as GMR biosensor signals (ΔMR/MR0), are proportional to the number of bound MNPs31 and have an inverse relationship with the concen- tration of THC in the sample due to the nature of competitive assays. Figure 1D shows the measurement signals for THC at 5 ng/mL spiked in saliva using the smartphone and customized app shown in Figure 1A. To the best of our knowledge, this is the first demonstration that GMR biosensors are capable of detecting small molecules. To collect saliva samples from drivers, we have developed a simple sample collection strategy using a cotton swab, syringe, and filter unit, which can be easily performed without any trained medical professional (Figure 2). First, oral fluid is collected with a cotton swab. The swab is then inserted into a syringe and squeezed to release the fluid. This step replaces a centrifuging process, which is not manageable on the road. The filter unit attached to the syringe further removes viscous mucus, food particles, and extra debris in the sample. This approach could also address the contamination issue, previously reported,32 that causes high concentrations of THC at the initial measurement. In our testing, we collected saliva samples from a donor in our research group who claimed to be drug- free and used them to dilute THC. Although there is no solid scientific consensus on the cutoff concentration of THC, most previous studies have suggested the values ranging from 2 to 25 ng/mL.9,15,33 To achieve better sensitivity around this range, we optimized the concentration of anti-THC biotinylated antibodies and incubation time. First, Figure 1. GMR biosensor platform and competitive assays. (A) Left: a measurement reader includes a toroid core coil, electrical circuits, and Bluetooth module. The dimension of the reader is 105 mm × 90 mm. Middle: a disposable cartridge is based on a customized design of printed circuit board (PCB) integrated with a GMR biosensor chip and reaction well. Right: a smartphone with customized app. (B) Disposable cartridge. GMR biosensor chip was wire-bonded to the customized PCB, and the reaction well was glued on top of the chip. The GMR biosensor chip consists of 80 sensors, and the last row (8 sensors at the bottom) are used as electrical reference sensors. As an example, capture probes (BSA or THC-BSA) were spotted on four sensors in the middle. The scale bar is 500 μm. (C) Schematic of competitive assay. Step 1: anti-THC biotinylated antibodies were mixed with a THC-containing sample and preincubated to bind to THC. Yellow circles represent THC. Step 2: the mixture was added to the chip where BSA and THC-BSA were immobilized on different sensors and incubated for unoccupied antibodies to bind THC-BSA. Step 3: Unbound antibodies were washed, and MNPs were added to the chip to read out the signals. (D) Real-time measurement signals. The chip was added to the reader, and MNPs were then added to the chip at ∼1.5 min. THC-BSA, BSA, and biotinylated BSA (Biotin-BSA) were immobilized on different sensors, and signals from these sensors were monitored. The signals are the average of 8 identical sensor signals and referenced to the averaged signal from reference sensors. The error bars represent standard deviations of 8 identical sensor signals. Figure 2. Saliva collection scheme. Step 1: A cotton swab, filter unit, and syringe are prepared. Plunger of the syringe is completely pulled out. The cotton swab is placed for 1 or 2 min in the mouth of an individual who is being tested to fully absorb oral fluids. Step 2: The filter unit is attached to the syringe, and the saturated cotton swab is loaded into the syringe. Step 3: The cotton swab is squeezed using the plunger, and the released fluid is collected in a test tube. Analytical Chemistry Letter DOI: 10.1021/acs.analchem.6b01688 Anal. Chem. 2016, 88, 7457−7461 7458
- 3. three different concentrations of antibodies (5, 1, and 0.5 μg/ mL) were tested with zero analyte and THC at 5 and 20 ng/ mL, respectively (Figure 3A). The antibodies at 5 μg/mL showed less reduction in signals as the concentration of THC increases compared to other antibody concentrations, which results in a wider dynamic range. The concentration of 1 μg/ mL produced a fairly linear titration curve within the range, while 0.5 μg/mL showed a steeper drop at 5 ng/mL of THC but almost the same signal as 1 μg/mL of antibodies at 20 ng/ mL of THC. In addition, the mass concentrations of antibodies (1 μg/mL) and THC (5 ng/mL) correspond to 7 nM and 16 nM in molar concentration, respectively. Considering the bivalency of the antibody, the binding capacity is well-matched. Thus, the depletion of antibodies by THC was effectively monitored in the competitive assays, and we therefore used antibodies at 1 μg/mL for subsequent experiments. To determine an optimal time frame for incubation of a sample mixture with the chip, three different incubation times (5, 10, and 15 min) for the chip incubation were tested with 15 min of preincubation (Figure 3B). The signals were saturated for around 15 min, and the difference between signals of 0 and 5 ng/mL of THC was maximized in the case of 15 min of chip incubation. Using these conditions (1 μg/mL of antibodies and 15 min/15 min incubation), we obtained a titration curve with a dynamic range from 0 to 50 ng/mL of THC in saliva (Figure 3C). Furthermore, preincubation and chip-incubation times were reduced to 5 and 10 min, respectively, and the GMR sensor signals were taken at 5 min after adding MNPs instead of 10 min to carry out the entire measurement within 20 min (Figure S2). The result showed no significant loss in performance. This was because the signal levels of 10 min chip-incubation was fairly close to those of 15 min incubation as shown in Figure 3B, and the sensor signals typically reached their plateaus within less than 5 min after addition of MNPs as shown in Figure 1D. Moreover, the result revealed that preincubation time was still not a limiting factor when it was set to 5 min. Since the preincubation is three-dimensional mixing and binding between THC and antibodies, which is much faster than binding of antibodies to THC on planar surfaces during the chip-incubation, the preincubation could be further reduced, compared to the chip-incubation. Without any preincubation, THC in a wider dynamic range (0 to 200 ng/ mL) was detected with 5 μg/mL of antibodies within 3 min of total assay time (Figure 3D), which showed promise for roadside testing. In this case, a higher concentration of antibodies warranted less chip-incubation time to obtain a substantial signal of antibody binding to THC on the surface. In a similar manner, the assay can be further tailored to adjust the sensitivity and dynamic range by changing antibody concentration and incubation time if the cutoff concentration of THC is beyond the current range. Since the binding of the antibodies to THC is a thermodynamic process, the temperature affects the assay results and there are day-to-day variations in measurement signals due to temperature fluctuations, chip-to-chip variations, or incubation time variations. Thus, to increase accuracy of the assay and minimize the measurement variation, we have designed a two-compartment cartridge where two reaction wells are installed on a GMR biosensor chip to measure both the sample of interest and a reference sample simultaneously with the same chip (Figure 4A), which ensures that both samples experience the same experimental condition including temperature, incubation time, and biochip fabrication. Since two samples are measured with the same chip at the same time, all measurement variation such as chip-to-chip variation, Figure 3. Optimization of the assay and titration curves. (A) Sensitivity and dynamic range tuning with antibody concentration. Three antibody concentrations (5, 1, and 0.5 μg/mL) were tested with 3 different sample concentrations (0, 5, and 20 ng/mL), respectively. The signals at 5 and 20 ng/mL were normalized by the signal at 0 ng/ mL for each antibody concentration for comparison. (B) Optimization of chip incubation time. The antibodies at 1 μg/mL were used to detect both THC at 0 and 5 ng/mL with 3 different chip incubation durations. A 15 min preincubation was performed to mix the sample with antibodies. The data point is denoted with an asterisk if Welch’s t- test shows p < 0.01. (C) Titration curve of the assay with saliva samples. The concentration of THC in the sample varied from 0 to 100 ng/mL. The biotinylated antibodies at 1 μg/mL and 15 min preincubation/15 min chip incubation were used. (D) 3 min assays using single step incubation without preincubation. The mixture of the sample and antibody was immediately added to the chip and incubated for 2 min. The concentration of the antibodies was 5 μg/mL, and the signals were obtained 1 min after adding MNPs. The signals are the average of 4 identical sensors, and the error bars represent the standard deviations. Figure 4. Two-compartment cartridge. (A) Customized design of two- compartment cartridge. A GMR biosensor chip was wire-bonded to the PCB, and a two-compartment reaction well with a gasket made of polydimethylsiloxane (PDMS) was assembled on the chip. Each compartment includes 20 biosensors. (B) Simultaneous THC measurement of two samples. Saliva samples containing THC at 0 and 5 ng/mL, respectively, were measured with the same chip using the two-compartment cartridge. The average and standard deviation of signals from 4 THC-BSA coated sensors in each compartment (blue and red) are shown. The p-value was determined using Welch’s t-test. Analytical Chemistry Letter DOI: 10.1021/acs.analchem.6b01688 Anal. Chem. 2016, 88, 7457−7461 7459
- 4. temperature fluctuation, and reagent variation can be reduced or even eliminated. For demonstration, saliva samples containing 0 and 5 ng/mL of THC, respectively, were measured with the two-compartment cartridge (Figure 4B). With the measurement using the two-compartment cartridge, the tester can easily determine whether the test result is positive or negative by the difference between the signals of two samples. For example, if it is assumed that the cutoff concentration is 5 ng/mL (reference sample) and the sample without THC (0 ng/mL) is collected from a driver, the test result is negative, i.e., a higher signal than the reference sample means negative, and a signal lower than or equal to the reference is positive. To investigate whether the competitive assay could be applicable to other small molecules, we performed measure- ment of morphine (285.3 Da) by replacing THC with morphine. The sensors were coated with morphine-BSA in lieu of THC-BSA, and antimorphine antibodies at 0.1 μg/mL were used. The signals from zero analyte, morphine at 10 and 100 ng/mL showed statistically significant differences (Figure S3). In summary, we have demonstrated that the miniaturized GMR biosensor platform enables rapid and precise detection of THC in saliva. This platform validated the technical feasibility for on-site screening on drivers under the influence, and our results showed that the technique could be used to establish the cutoff concentration of THC, performing the tests without any delays involved with transferring samples to the clinical laboratories. In addition, the platform is capable of detecting THC in blood (Figure S4), because GMR biosensors are matrix-insensitive.19 Thus, the correlation between concen- trations of THC in blood and saliva, which is currently controversial,7,9,33,34 could be addressed with a more accurate comparison using the same measurement modality. With the multiplexing capability of the GMR biosensor chip, the next generation of the platform could include metabolites of THC on the sensors to simultaneously detect THC and its metabolites in blood and urine. This multiplex measurement would allow researchers to study the pharmacokinetics of the drug more rigorously. Furthermore, because it has been recently reported that 11-nor-9-Carboxy-THC (THC- COOH) in saliva could be a better biomarker to detect cannabis use,35 it would be interesting to measure THC- COOH and THC together to increase the accuracy of the test and develop a new criterion of cutoff. In addition, if there is a better biomarker that can reveal THC’s pharmacodynamics in the brain and the relationship with its concentration in blood or saliva, it could be a more precise indicator for the level of impairment. However, there is a potential limitation of testing THC in saliva. THC in saliva is thought to originate from oral mucosal depots, not from blood.32 Thus, if cannabis is consumed through edibles it would be difficult to detect THC in saliva. Lastly, since the competitive assays are applicable to detection of any type of small molecules, the platform could be used to detect different drugs such as heroin and cocaine in addition to THC and morphine as well as to detect therapeutic small molecule inhibitors in cancer treat- ments.36,37 ■ ASSOCIATED CONTENT *S Supporting Information The Supporting Information is available free of charge on the ACS Publications website at DOI: 10.1021/acs.anal- chem.6b01688. Full experimental details, electronics, 20 min assays, morphine measurement, and measurement of THC in blood (Figures S1−S4) (PDF) ■ AUTHOR INFORMATION Corresponding Author *E-mail: sxwang@stanford.edu. Fax: +1 (650) 736-1984. Author Contributions § J.-R.L., J.C., and T.O.S. contributed equally. Notes The authors declare the following competing financial interest(s): J.-R.L., T.O.S., and S.X.W. have related patents or patent applications assigned to Stanford University and out- licensed for potential commercialization. S.X.W. has stock or stock options in MagArray, Inc., which has licensed relevant patents from Stanford University for commercialization of GMR biosensor chips. ■ ACKNOWLEDGMENTS This work was supported in part by Stanford Center for Magnetic Nanotechnology and Skippy Frank Translational Fund. J.C. acknowledges the STX Foundation fellowship. We would like to acknowledge the XPRIZE Foundation and Nokia Sensing XCHALLENGE competition for motivating the design of the platform. ■ REFERENCES (1) Bostwick, J. M. Mayo Clin. Proc. 2012, 87, 172−186. (2) Hoffmann, D. E.; Weber, E. N. Engl. J. Med. 2010, 362, 1453− 1457. (3) Hill, K. P. JAMA 2015, 313, 2474−2483. (4) Pollini, R. A.; Romano, E.; Johnson, M. B.; Lacey, J. H. Drug Alcohol Depend. 2015, 150, 135−140. (5) Maxwell, J. C.; Mendelson, B. J. Addict. Med. 2016, 10, 3−12. (6) Wilkinson, S. T.; Yarnell, S.; Radhakrishnan, R.; Ball, S. A.; D’Souza, D. C. Annu. Rev. Med. 2016, 67, 453−466. (7) Kintz, P.; Cirimele, V.; Ludes, B. J. Anal. Toxicol. 2000, 24, 557− 561. (8) Allen, K. R. Ann. Clin. Biochem. 2011, 48, 531−541. (9) Ramaekers, J. G.; Moeller, M. R.; van Ruitenbeek, P.; Theunissen, E. L.; Schneider, E.; Kauert, G. Drug Alcohol Depend. 2006, 85, 114− 122. (10) Kadehjian, L. Forensic Sci. Int. 2005, 150, 151−160. (11) Ramaekers, J. G.; Robbe, H. W.; O’Hanlon, J. F. Hum. Psychopharmacol. 2000, 15, 551−558. (12) Ashton, C. H. Br. J. Psychiatry 2001, 178, 101−106. (13) Hartman, R. L.; Brown, T. L.; Milavetz, G.; Spurgin, A.; Gorelick, D. A.; Gaffney, G.; Huestis, M. A. Clin. Chem. 2015, 61, 850−869. (14) Wood, E.; Brooks-Russell, A.; Drum, P. Traffic Inj Prev 2016, 17, 105−108. (15) Verstraete, A. G. Forensic Sci. Int. 2005, 150, 143−150. (16) Bruls, D. M.; Evers, T. H.; Kahlman, J. A.; van Lankvelt, P. J.; Ovsyanko, M.; Pelssers, E. G.; Schleipen, J. J.; de Theije, F. K.; Verschuren, C. A.; van der Wijk, T.; van Zon, J. B.; Dittmer, W. U.; Immink, A. H.; Nieuwenhuis, J. H.; Prins, M. W. Lab Chip 2009, 9, 3504−3510. (17) Shao, J.; Li, Z. Y.; Jiang, H.; Wang, W. L.; Wu, Y. X. Proc. SPIE 2014, 9297, 92971K. Analytical Chemistry Letter DOI: 10.1021/acs.analchem.6b01688 Anal. Chem. 2016, 88, 7457−7461 7460
- 5. (18) Molnar, A.; Lewis, J.; Doble, P.; Hansen, G.; Prolov, T.; Fu, S. Forensic Sci. Int. 2012, 215, 92−96. (19) Gaster, R. S.; Hall, D. A.; Nielsen, C. H.; Osterfeld, S. J.; Yu, H.; Mach, K. E.; Wilson, R. J.; Murmann, B.; Liao, J. C.; Gambhir, S. S.; Wang, S. X. Nat. Med. 2009, 15, 1327−1332. (20) Kim, D.; Marchetti, F.; Chen, Z.; Zaric, S.; Wilson, R. J.; Hall, D. A.; Gaster, R. S.; Lee, J. R.; Wang, J.; Osterfeld, S. J.; Yu, H.; White, R. M.; Blakely, W. F.; Peterson, L. E.; Bhatnagar, S.; Mannion, B.; Tseng, S.; Roth, K.; Coleman, M.; Snijders, A. M.; Wyrobek, A. J.; Wang, S. X. Sci. Rep. 2013, 3, 2234. (21) Wang, Y.; Wang, W.; Yu, L.; Tu, L.; Feng, Y.; Klein, T.; Wang, J. P. Biosens. Bioelectron. 2015, 70, 61−68. (22) Lee, N.; Yoo, D.; Ling, D.; Cho, M. H.; Hyeon, T.; Cheon, J. Chem. Rev. 2015, 115, 10637−10689. (23) Chapman, S.; Dobrovolskaia, M.; Farahani, K.; Goodwin, A.; Joshi, A.; Lee, H.; Meade, T.; Pomper, M.; Ptak, K.; Rao, J.; Singh, R.; Sridhar, S.; Stern, S.; Wang, A.; Weaver, J. B.; Woloschak, G.; Yang, L. Nano Today 2013, 8, 454−460. (24) Sun, S.; Zeng, H.; Robinson, D. B.; Raoux, S.; Rice, P. M.; Wang, S. X.; Li, G. J. Am. Chem. Soc. 2004, 126, 273−279. (25) Wang, W.; Wang, Y.; Tu, L.; Feng, Y.; Klein, T.; Wang, J. P. Sci. Rep. 2014, 4, 5716. (26) Lee, J. R.; Sato, N.; Bechstein, D. J.; Osterfeld, S. J.; Wang, J.; Gani, A. W.; Hall, D. A.; Wang, S. X. Sci. Rep. 2016, 6, 18692. (27) Park, J.; Joo, J.; Kwon, S. G.; Jang, Y.; Hyeon, T. Angew. Chem., Int. Ed. 2007, 46, 4630−4660. (28) Baselt, D. R.; Lee, G. U.; Natesan, M.; Metzger, S. W.; Sheehan, P. E.; Colton, R. J. Biosens. Bioelectron. 1998, 13, 731−739. (29) Zuo, X.; Xiao, Y.; Plaxco, K. W. J. Am. Chem. Soc. 2009, 131, 6944−6945. (30) Yakes, B. J.; Etheridge, S. M.; Mulvaney, S. P.; Tamanaha, C. R. Mar. Drugs 2010, 8, 565−576. (31) Wang, S. X.; Li, G. IEEE Trans. Magn. 2008, 44, 1687−1702. (32) Huestis, M. A.; Cone, E. J. J. Anal. Toxicol. 2004, 28, 394−399. (33) Van der Linden, T.; Wille, S. M.; Ramirez-Fernandez, M.; Verstraete, A. G.; Samyn, N. Forensic Sci. Int. 2015, 249, 148−155. (34) Laloup, M.; Del Mar Ramirez Fernandez, M.; Wood, M.; De Boeck, G.; Maes, V.; Samyn, N. Forensic Sci. Int. 2006, 161, 175−179. (35) Milman, G.; Barnes, A. J.; Schwope, D. M.; Schwilke, E. W.; Darwin, W. D.; Goodwin, R. S.; Kelly, D. L.; Gorelick, D. A.; Huestis, M. A. Clin. Chem. 2010, 56, 1261−1269. (36) Baker, B. R.; Lai, R. Y.; Wood, M. S.; Doctor, E. H.; Heeger, A. J.; Plaxco, K. W. J. Am. Chem. Soc. 2006, 128, 3138−3139. (37) Wang, W. U.; Chen, C.; Lin, K. H.; Fang, Y.; Lieber, C. M. Proc. Natl. Acad. Sci. U. S. A. 2005, 102, 3208−3212. Analytical Chemistry Letter DOI: 10.1021/acs.analchem.6b01688 Anal. Chem. 2016, 88, 7457−7461 7461