More Related Content
Similar to Box and-whisker-plots (20)
Box and-whisker-plots
- 1. tudent
C
earning
L
S
entre
http://flowingdata.com/2008/02/15/how-to-read-and-use-a-box-and-whisker-plot/
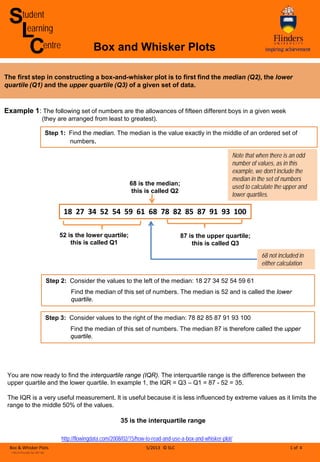
The first step in constructing a box-and-whisker plot is to first find the median (Q2), the lower
quartile (Q1) and the upper quartile (Q3) of a given set of data.
18 27 34 52 54 59 61 68 78 82 85 87 91 93 100
You are now ready to find the interquartile range (IQR). The interquartile range is the difference between the
upper quartile and the lower quartile. In example 1, the IQR = Q3 – Q1 = 87 - 52 = 35.
The IQR is a very useful measurement. It is useful because it is less influenced by extreme values as it limits the
range to the middle 50% of the values.
35 is the interquartile range
Step 1: Find the median. The median is the value exactly in the middle of an ordered set of
numbers.
68 is the median;
this is called Q2
Step 2: Consider the values to the left of the median: 18 27 34 52 54 59 61
Find the median of this set of numbers. The median is 52 and is called the lower
quartile.
52 is the lower quartile;
this is called Q1
Step 3: Consider values to the right of the median: 78 82 85 87 91 93 100
Find the median of this set of numbers. The median 87 is therefore called the upper
quartile.
87 is the upper quartile;
this is called Q3
Box and Whisker Plots
Example 1: The following set of numbers are the allowances of fifteen different boys in a given week
(they are arranged from least to greatest).
Note that when there is an odd
number of values, as in this
example, we don’t include the
median in the set of numbers
used to calculate the upper and
lower quartiles.
68 not included in
either calculation
Box & Whisker Plots 5/2013 © SLC 1 of 4
- 2. 42 63 64 64 70 73 76 77 81 81
Step 1: Find the median. The median is the value exactly in the middle of an ordered set of
numbers.
The median in this example is in-between 70
and 73, so the median is calculated by taking
the mean of 70 and 73:
Median =
70+73
2
=71.5
Step 2: Consider the values to the left of the median: 42 63 64 64 70
Find the median of this set of numbers. The median is 64.
64 is the lower quartile;
this is called Q1
Step 3: Consider the values to the right of the median: 72 76 77 81 81
Find the median of this set of numbers. The median is 77 and is called the upper
quartile.
77 is the upper quartile;
this is called Q3
Example 2: The following set of numbers are the percentages achieved on a test by a group of 10
students (they are arranged from least to greatest).
Note that when the number of values is
even the median lies between the two
middle values. As in this example, we
include the data value just below the
median in the set of numbers used to
calculate the lower quartile, and the
number just above the median in the set
of numbers used to calculate the upper
quartile.
70 is included in calculation
for the lower quartile and 73
is included in calculation for
the upper quartile.
You are now ready to find the interquartile range (IQR). The interquartile range is the difference
between the upper quartile and the lower quartile. In example 2, the IQR = Q3 – Q1 = 77 - 64 = 13.
The IQR is a very useful measurement. It is useful because it is less influenced by extreme values as it
limits the range to the middle 50% of the values.
13 is the interquartile range
Box & Whisker Plots 5/2013 © SLC 2 of 4
71.5 is the median;
this is called Q2
- 3. IQR
What do Box and Whisker plots look like?
They can be either vertical:
Or horizontal:
Box & Whisker Plots 5/2013 © SLC 3 of 4
- 4. Look at these box-and-whisker plots:
Hours spent listening to the radio each week
Q1 What is the interquartile range for the following set of numbers?
4, 5, 6, 8, 9, 11, 13, 16, 16, 18, 20, 21, 25, 30, 31, 33, 36, 37, 40, 41
Clue: you have to take the average (mean)
of even data sets
Q2 What is the interquartile range for the information shown in the box and whisker plot below?
Q3 For the information shown in the box and whisker plot below, what are the median, range and interquartile
range?
Which person has a higher median?
Kathy has the higher median.
Kathy
Tiffany
20 40 60 80
Q
11
is
the
mean
of
9
and
11
=
(9
+
11)
÷
2
=
10
Q
22
is
the
mean
of
18
and
20
=
(18
+
20)
÷
2
=
19
Q
33
is
the
mean
of
16
and
17
=
(31
+
33)
÷
2
=
32
Therefore
the
interquartile
range
=
Q
33
-
Q
11
=
32
-
10
=
22
The
upper
quartile,
Q
3
is
9
The
lower
quartile,
Q
1
is
4
Therefore,
the
interquartile
range
=
9
-
4
=
5
Median
=
Q
2
=
6.5
Range
=
Highest
value
-
Lowest
value
=
14
-
0
=
14
Interquartile
range
=
Q
3
-
Q
1
=
12
-
2
=
10
STUDENT LEARNING CENTRE
REGISTRY BUILDING ANNEXE
TEL: 61-8-8201 2518
E-MAIL: slc@flinders.edu.au
INTERNET: http://www.flinders.edu.au/SLC
POSTAL: PO BOX 2100, ADELAIDE, SA 5001
Box & Whisker Plots 5/2013 © SLC 4 of 4