INCIDENCE OF ABSORPTION AT THE INTERFACE OF GALAXIES AND IGM
•Download as PPTX, PDF•
1 like•671 views


Recommended
Recommended
More Related Content
What's hot
What's hot (20)
Viewers also liked
Viewers also liked (17)
Similar to INCIDENCE OF ABSORPTION AT THE INTERFACE OF GALAXIES AND IGM
Similar to INCIDENCE OF ABSORPTION AT THE INTERFACE OF GALAXIES AND IGM (20)
INCIDENCE OF ABSORPTION AT THE INTERFACE OF GALAXIES AND IGM
- 1. INCIDENCE OF ABSORPTION AT THE INTERFACE OF GALAXIES AND IGM Ramiz Ahmad Indian Institute of Space Science and Technology May, 2012
- 2. Plan of the talk 1. Introduction. 2. Details about data. 3. Data analysis. 4. Method of measurement. 5. Results and observations. 6. Conclusion.
- 3. What is out there?
- 4. What is out there? What is it made up of?
- 5. What is out there? What is it made up of? Composition of the universe (present day)
- 6. Distribution of the baryonic matter: ~ 6-10 % are in the form of galaxies.
- 7. Distribution of the baryonic matter: ~ 6-10 % are in the form of galaxies. => 90-93 % of the baryonic matter are in the form of IGM
- 9. Owing to the high temperature of the IGM, the UV region of the electromagnetic spectra is the best region to study it.
- 10. Owing to the high temperature of the IGM, the UV region of the electromagnetic spectra is the best region to study it. Cosmic Origin Spectrograph- Aboard the Hubble Space Telescope COS is capable of producing high sensitivity medium and low resolution far-UV and near-UV spectra
- 11. The data was obtained from the public archive of the COS (Cosmic Origin Spectrograph) available at Multi-mission Archive (MAST) at Space Telescope Science Institute (STScI) webpage : http://archive.stsci.edu/
- 12. The data was obtained from the public archive of the COS (Cosmic Origin Spectrograph) available at Multi-mission Archive (MAST) at Space Telescope Science Institute (STScI) webpage : http://archive.stsci.edu/ COS Grating Parameters
- 13. Data Analysis
- 14. Data Analysis Sample table
- 15. Data Analysis Step1: The data is converted into either ASCII or the .sav format depending upon the requirement. Step2: The data is re-binned. Step3: Then various rebinned files are co-added with the exposure time as the weightage factor. Step4: The spectra is then plotted using the co-added files and from the spectra the continuum normalized spectra is obtained on which all the final analysis is done.
- 16. Continuum Normalized Spectra of HE0153-4520
- 17. Line Measurements Using Apparent Optical Depth Method The direct integration of the observed optical path difference is done
- 18. Line Measurements Using Apparent Optical Depth Method The direct integration of the observed optical path difference is done
- 19. Line Measurements Using Apparent Optical Depth Method The first moment of the optical depth gives the central velocity of the absorption line
- 20. Line Measurements Using Apparent Optical Depth Method The first moment of the optical depth gives the central velocity of the absorption line And we get the Doppler width from the second moment of the apparent optical depth
- 21. Line Measurements Using Apparent Optical Depth Method The first moment of the optical depth gives the central velocity of the absorption line And we get the Doppler width from the second moment of the apparent optical depth Where,
- 22. Line Measurements Using Apparent Optical Depth Method The general expression for the calculation of equivalent width is Where f(v) is the continuum normalised flux of the spectra in the velocity space.
- 24. Observations and Results 1. HE0153-4520 2. HE0226-4110 3. HE0238-1904 4. MS0117.2-2837
- 25. Observations and Results System plot for HE0153-4520
- 26. Observations and Results System plot for HE0226-4110
- 27. Observations and Results System plot for HE0238-1904
- 28. Observations and Results System plot for MS0117.2-2837
- 29. Observations and Results If the line is clearly resolved, a value of the parameter can be obtained. In case of the absence of the absorption line or unresolved line, only an upper limit could be calculated.
- 30. Observations and Results If the line is clearly resolved, a value of the parameter can be obtained. In case of the absence of the absorption line or unresolved line, only an upper limit could be calculated. The table shows the measured values and the upper limit of the various parameters (Wr (mA)= Equivalent width in milli-angstrom, ba= Doppler parameter)
- 31. Observations and Results The table shows a list of the line of the sights, associated absorbers, impact parameters and the equivalent width.
- 32. Observations and Results Variation of the equivalent depth with impact parameter.
- 33. Conclusion 1. There is no obvious relation between the impact parameters of the galaxies and the equivalent width of the absorption lines.
- 34. Conclusion 1. There is no obvious relation between the impact parameters of the galaxies and the equivalent width of the absorption lines. 2. Based on the measurement of the Doppler parameter, the average value of the temperature was found to be 5 x 10^4 K, which is consistent with the temperature of the photoionized component of the IGM.
- 35. Conclusion 1. There is no obvious relation between the impact parameters of the galaxies and the equivalent width of the absorption lines. 2. Based on the measurement of the Doppler parameter, the average value of the temperature was found to be 5 x 10^4 K, which is consistent with the temperature of the photoionized component of the IGM. 3. Although in none of the case any other absorption line by any metal ion is detected, from the measurement an upper limit was calculated for the ions in all the cases and is in agreement with the model of cosmic abundance percentage. The absence of metal absorption is consistent with low metallicity (of ~1/10 solar) typical of low-z IGM.
- 36. Conclusion 1. There is no obvious relation between the impact parameters of the galaxies and the equivalent width of the absorption lines. 2. Based on the measurement of the Doppler parameter, the average value of the temperature was found to be 5 x 10^4 K, which is consistent with the temperature of the photoionized component of the IGM. 3. Although in none of the case any other absorption line by any metal ion is detected, from the measurement an upper limit was calculated for the ions in all the cases and is in agreement with the model of cosmic abundance percentage. The absence of metal absorption is consistent with low metallicity (of ~1/10 solar) typical of low-z IGM. 4. Though as of now, nothing can be said about the relation between the impact parameter and the equivalent width because of the lack of the number of data points, one conclusion that can be drawn based on the above graphs is that there is a possibility that the IGM surrounding the galaxies is patchy.
- 37. References: 1. Penton, Steven V.; Stocke, John T.; Shull, J. Michael, “The Local Lyα Forest. IV. Space Telescope Imaging Spectrograph G140M Spectra and Results on the Distribution and baryon Content of H I Absorbers”, The Astrophysical Journal Supplement Series , 152:29-62, 2004 May. 2. Lehner, N.; Savage, B. D.; Wakker, B. P.; Sembach, K. R.; Tripp, T. M. “Low- Redshift Intergalactic Absorption Lines in the Spectrum of HE 0226-4110”, The Astrophysical Journal Supplement Series , 164:1 – 37, 2006 May 3. Blair D. Savage, Kenneth R. Sembach, “The Analysis of Apparent Optical Depth Profiles for Interstellar Absorption Lines”, The Astrophysical Journal, 379: 245-259,1991 September 20 4. Joel N. Bregman, "The Search for the Missing Baryons at Low Redshift", Annu. Rev. Astron. Astrophys. 2007. 45:221–59 5. Anand Narayanan, Bart P. Wakker, Blair D. Savage, Brian A. Keeney, J. Michael Shull, John T. Stocke, and Kenneth R. Sembach, "Cosmic Origins Spectrograph And Fuse Observations of T ∼ 10^5 K Gas In A Nearby Galaxy Filament", The Astrophysical Journal, 721:960–974, 2010 October
- 38. Thank You!
Editor's Notes
- Afternoon everyone. The aim of my project was to study the incidence of absorption lines at the interface of galaxies and IGM.It was done under the guidance of Dr. Anand Narayanan.
- This is how I plan to go about the presentation. I will start with an introduction then go on to discuss the source and type of data used. Then will discuss the data analysis and several steps involved in that. Then I will be discussing the method used for the measurement of various features of interest, discuss the result and then discuss a few conclusion made based on the observations.
- One of the key questions that needs to be answered by astrophysicists is what is really out there?
- Which immediately leads us to another question, what is it made up of?Without finding the answer to these questions, it is impossible to understand how the universe evolved after the big bang.Until very recently, about four decades ago, astronomers thought that universe was composed entirely of the baryonic matter. However, owing to the recent observations and the data from WMAP and several other satellites, the present day composition of the universe stands at this
- The normal matter or the baryonic matter contributes only to roughly 5% of the total energy density. Which means that all the galaxies and the intergalactic medium which we directly observe are but a small fraction of what is really out there. We shall focus on this part of the energy density and see how it is distributed across the cosmos.
- The bulk of the material has not collapsed into luminous structures and are in circumgalactic regions and in the unvirialized large-scale intergalactic filaments.
- Which emphasise the importance of studying on the IGM.And that is what I did. In my project, I studied the IGM lying just outside the galactic halo with the help of the absorption lines present in the continuum spectra of a background source.
- The figure shows a galactic filament.Distribution of galaxies (circles, from NED) and AGNs (stars) in the field of the galaxy filament. The solid black line roughly outlines the filament. Circle sizes are proportional to the D25 diameters of the galaxies, with minimum size for galaxies smaller than 5kpc. Circle colours indicate the galaxy systematic velocities, following to the legend in the right bottom corner.Four sight lines were chosen, depending on the availability of the public data and the presence of a background source.
- The data (QSO spectra) which I have used for analysis was recorded by the Cosmic Origins Spectrograph (COS), aboard the Hubble Space Telescope (HST). COS is capable of producing high sensitivity medium and low resolution far-UV and near-UV spectra.
- The two detectors and seven diffraction gratings (three for FUV, four for NUV) of COS enable high-sensitivity spectroscopy at low and moderate resolution across the FUV and NUV bands.
- The data is downloaded from the website, which in table form looks like this...
- The following table shows how the data is recorded and the various parameters involved. There are various other columns which shows the type of aperture used, name of the detector, proposal id, release date etc which I have omitted for the lack of the space.The data comes in the FITS format, which is converted into either ASCII format or .sav format depending on the need.The
- Final analysis basically means the search for absorption lines, and once the absorption lines are found with some confidence, measuring the various parameters associated with the absorption lines.
- There are several methods available to determine the column density from the absorption line measurement. But we shall focus on the line measurements using the AOD Method.In this method the direct integration of the observed optical path difference is done
- And skipping how the formula is derived, the final expression comes out to be like this...So, all that is required is to divide the value of the flux at any point with the value of the continuum normalised flux at that point, and then integrate it over the width of the absorption line.
- Which is integrated over the range in which the absorption line is present.
- Four sight lines were selected in order to do the study, namely
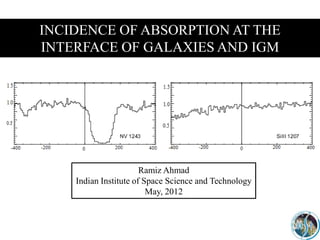
- The x-axis represents the velocity, or variation from the central line, and the y-axis represents the continuum normalised flux of the spectra.The solid vertical line represents where the absorption lines are supposed to be present for each ion.
- As can be seen, the lyman alpha absorption lines are clearly identifiable in all the spectra except for that of HE0238-1904.Based on these system plots, the measurements were carried out. In the cases where the absorption line is easily identifiable, a value of the parameter can be obtained, however if the line is absent or is not well resolved only an upper limit can be obtained, for example
- For example, in the case of spectra of MS01117.2-2837, the following table gives the list of various parameters calculated
- And as is clear from the spectra of system plot of MS017.2-2837, except for HI 1215 line, no other absorption line is present, so only an upper limit on the respective parameters could be placed.The purpose of calculating the equivalent width was to check whether the equivalent widths of the Lyman-alpha lines is showing any apparent correlation with the impact parameters of the sight line with the nearest galaxies in the filament.
- As is evident from the figure, there is no apparent relation between the impact parameters and the equivalent width of the absorption lines (lyman alpha). This is in accordance with what has been reported in the literature so far.