Impact of organizational culture on employee performance at Sona Koyo Steering Systems Ltd
•
6 likes•320 views

Project Report On the Sona Koyo Steering Systems Limited Sanand Ahmedabad, Gujarat.

Recommended
Recommended
More Related Content
What's hot
What's hot (16)
Similar to Impact of organizational culture on employee performance at Sona Koyo Steering Systems Ltd
Similar to Impact of organizational culture on employee performance at Sona Koyo Steering Systems Ltd (20)
Recently uploaded
Recently uploaded (20)
Impact of organizational culture on employee performance at Sona Koyo Steering Systems Ltd
- 1. 1 A PROJECT MAJOR ON “IMPACT OF ORGANINIZATIONAL CULTURE ON EMPLOYEE PERFORMANCE AT SONA KOYO STEERING SYSTEMS LTD.” Student Name: ADITI VASHISTHA Enrollment No. (137080585023) PROJECT SUBMITTED IN PARTIAL FULFILLMENT FOR THE AWARD OF THE DEGREE OF INTEGRATED MASTER OF BUSINESS ADMINISTRATION SUBMITTED TO INSTITUTE CODE: 708 INSTITUTE NAME: ‘CHAUDHARI TECHNICAL INSTITUTE’ UNDER THE GUIDANCE OF ASSISTANT PROF. BHUMIKA RAVAL GUJARAT TECHNOLOGICAL UNIVERSITY AHMEDABAD Batch 2016-2017
- 2. 2 ACKNOWLEDGEMENT Every project is a master piece of hard work and sincere efforts of all those who are Involved in the project. Hard work and success are the two sides of the same coin. I am grateful to all of them who were a part of my hard work and definitely been inevitable part of my success. To make a project of this magnitude is impossible without a dedicated effort and perfect guidance. “The Project Major” is one of the Project of I.M.B.A Program. I am much obliged to express our deep gratitude to all the personalities who give their co-operation and guidance for this project. This report is impossible without the cooperation of certain people. Let me first express more thankful to our Gujarat Technological University – Ahmadabad and CHAUDHRI TECHNICAL INSTITUTE (CTI) – Gandhinagar who have been providing us all academic. Any accomplishment requires the efforts of many people and this work is no different. With deep sense of gratitude and humble submission, I owe my heartfelt thanks to my guide Asst. Prof. Bhumika Raval and director of the iM.B.A. department Prof. Amit Patel for providing guidance and constructive suggestions and showing faith in our abilities. My special thanks to Mr. Jaydeep Kumar (Plant Head), Mr. Bimlesh Bibhakar (Head HR) to provide various facilities in the Project Major. I thank all for showing co-operation with me.
- 3. 3 DECLARATION I hereby declare that this project Report titled “Impact of organizational culture on employee performance of Sona Koyo Steering Systems Ltd.” submitted by me to the Chaudhari Technical Institute Gandhinagar is a bonafide work undertaken by me and it is not submitted to any other University or institution for the award of any degree diploma/certificate or published any time before. ADITI VASHISTHA Signature of the Student (137080585023)
- 4. 4 Table of Content Sr. No. CONTENTS PAGE NUMBER 1 INTRODUCTION 1 2 REVIEW OF LITERATURE 9 3 THE COMPANY 21 4 DATA ANALYSIS & PRESENTATION 31 5 FINDINGS & CONCLUSIONS 108 6 BIBLIOGRAPHY 112 7 APPENDICES 113
- 6. 6 RESEARCH PROBLEM Organizational culture affects the performance and productivity of organization in tremendous way. NEED FOR STUDY/ SIGNIFICANCE OF THE PROJECT To identify the wants and needs of its employees OBJECTIVES OF STUDY ∑ To study the relations between organizational culture and their impact on employee performance. ∑ To study how organization culture effect on performance of employee. ∑ To compare inter-industry work culture and impact on employee performance. Hypothesis A hypothesis is an assumption or claim about some characteristic of a population, which we should be able to support or reject on the basis of empirical evidence. In other words hypothesis is a predictive statement, capable of being tested by scientific methods, that relates on independent variables to some dependent variable.
- 7. 7 Hypothesis testing is a process for choosing between different alternatives. The alternatives have to be mutually exclusive and exhaustive. Being mutually exclusive means when one is true the other is false and vice-versa. Being exhaustive means that there should not be any possibility of any other relationship between the parameters. Typically, in hypothesis testing, we have two options to choose from. These are termed as null hypothesis and alternate hypothesis. Null Hypothesis (H0) – It is the presumption that is accepted as correct unless there is strong evidence against it. Alternative Hypothesis (H1) – It is accepted when H0 is rejected. H0 –There is not a positive relation among employee satisfaction, employee correlation, role clarity; employee involvement is positively correlated with employee performance H1 - There is a positive relation among employee satisfaction, employee correlation, role clarity; employee involvement is positively correlated with employee performance H0 –The team work is negatively correlated with the employee satisfaction. H2 - The team work is positively correlated with the employee satisfaction. H0 – Role clarity is negatively related with the employee performance H3 – Role clarity is positively related with the employee performance.
- 8. 8 METHODOLOGY Data collection method: - Data for the present study has been collected from both the sources i.e. Primary Data and Secondary Data. Primary Data: - The main source of the Primary Data has been the questionnaire method, some personal interactions and interviews with the employees and personal observations of the scholar for gaining the data. Secondary Data: - The Secondary Data was obtained from interval available sources of magazines, documentary, books, records, reports, journals and internet etc. Research Design: Selection of research design is purely depends on kind of research design is a specification of methods and procedures for acquiring information needed for solving the problem. It is a master plan or a model to conduct the formal investigations. ÿ Descriptive research design Descriptive research also known as statistical research, describes data and characteristics about the population phenomenon being studied. Descriptive research answers the questions who, what, where, when, and how. For the present study the “Descriptive research design is used, because in this project. ∑ Mostly data is collected through questionnaire.
- 9. 9 ∑ At this stage the researcher build some idea about sampling methods, source of data and method of data collection. In this project the secondary and primary data are used in the research design in my project is appropriate. Sample Size: In this category, 150 workers in all, with 100 drawn from each of the work-places, were used after a stratified random sampling selection Data Analysis: - The research design was a master plan specifying the statistical methods and procedures to find the conclusive results of collected data. Specific instruments was open office and some instruments were utilized with excel sheets as per the requirements of the study. If it was needed some traditional instruments were taken by researcher for this study. SAMPLE DESIGN I am using random design for my project work. SOURCES OF INFORMATION Set of questionnaire, interviews and internet. TOOLS AND TECHNIQUES OF ANALYSIS The following techniques of data collection were used:
- 10. 10 (i) Sample survey or structure self-administered questionnaire. (ii) A case study approach with in-depth interview conducted among the Personnel managers in the three locations (03) and middle managers. (iii) Direct observations of the work places. This helped to document the conditions under which people work. STRUCTURE OF THE STUDY WITH SOUND JUSTIFICATIONS /EXPLANATIONS
- 11. 11 Theoretical Background Introduction of Organizational Culture If you want to provoke a vigorous debate, start a conversation on organizational culture. While there is universal agreement that (1) it exists, and (2) that it plays a crucial role in shaping behavior in organizations, there is little consensus on what organizational culture actually is, never mind how it influences behavior and whether it is something leaders can change. This is a problem, because without a reasonable definition (or definitions) of culture, we cannot hope to understand its connections to other key elements of the organization, such as structure and incentive systems. Nor can we develop good approaches to analyzing, preserving and transforming cultures. If we can define what organizational culture is, it gives us a handle on how to diagnose problems and even to design and develop better cultures. What is organizational culture? The culture of an organization represents certain predefined policies which guide the employees and give them a sense of direction at the workplace. The culture decides the way employees interact at their workplace.
- 12. 12 Implications: I. Culture is a perception II. Culture is shared III. Culture is descriptive How Organizational cultures affect the Organization? It helps to manifests or understands in: ∑ The ways the organization conducts its business, treats its employees, customers, and the wider community. ∑ The extent to which autonomy and freedom is allowed in decision making, developing new ideas, and personal expression. ∑ How power and information flow through its hierarchy. ∑ The strength of employee commitment towards collective objectives. Impact of OC to employee’s performance High Performance when: ß The OC is effective and can be accepted by the employees. This can lead to motivation to the employees to increase their productivity. ß For example, if the organizational culture is Innovative, and the employees like to improve and to do new things, then these can lead to high performance.
- 13. 13 Low Performance when: ß The culture of the organization is not proper and transparent and it is not accepted by the employees. ß For example, if the organizational culture is team oriented and the employee is individualistic who likes to do work in individual, then this can lead to low performance. Impact of OC to employee’s satisfaction Employee satisfaction is the terminology used to describe whether employees are happy and contented and fulfilling their desires and needs at work. ß High satisfaction when the employees are willing to adapt the organizational culture. ß Low satisfaction when the employees are unwilling to adapt the organizational culture.
- 15. 15 According to Brown (1973) the American culture is emphasizing on the individual responsibility, decision and a blending of reason and emotion into a persistently to persuade (someone) to do the act. The philosophy was built on the uneven individualism, a strong work ethic and an impossible to satisfy desire for new life that can be won only by aggressive, ruthless determination to succeed. Gordon and Cummins (1979) are defining the organization culture as the drive that recognizes the efforts and contributions of the organizational members and provides holistic understanding of what and how it is to be achieved, how goals are interrelated, and how each employee could attain goals. Hosftede (1980: 25) is summarizing organizational culture as collective process of the mind that differentiates the members of one group from the other one. Earlier some researchers as Peters and Waterman, 1982; Deal and Kennedy, 1982; and Pascal and Athos, 1981 find the unambiguous links between culture and organizational performance. These cultural values are consistent with organizational chosen strategies that led to successful organizations. Gordon and DiTomso (1992) and Denison (1990) had argued that culture characteristics might affect performance if it fits with changes of environmental factors within the context. Recently, researchers argue that cultural traits cannot be copied and therefore it could be source of organizational sustainability. After viewing the recourses (Barney, 1986 and 1991) suggested that the sustainability depends on the values, rarity and sustainability of the culture concerned.
- 16. 16 Tayeb (1988) studied on culture and work attitudes among Indian and English employees. In this study, Tayeb found that Indian and English workers were workers were similar with regard to honesty, tolerance, friendliness, attitudes to change, attitude to law, self-control and self-confidence, and acceptance of social differentiation. The two samples were similar with respect to trust in their colleagues, individualism, and commitment to their organization. There were also similarities in the relation between certain work-related attitudes and some non-cultural characteristics of the. The findings of Tayeb’s study suggest that, although in modern industrial societies, organizations tend to develop similar structural configurations in response to similar task environments, the means by which they achieve these configurations are different, depending on the particular socio-cultural characteristics of the society in which they operate and which the large percentage of their employees come from. Schein in 1994 clarifies that value which is a set of social norms that define the rules or framework for social interaction and communication behaviors of society’s members, is a reflection of causal cultural assumptions. Individuals who hold similar values may feel and interpret situations and events similarly (Meglino, Ravlin, & Adkins, 1989) which can reduce uncertainty (Schein, 1985), role ambiguity, and conflict (Fisher and Gitelson, 1983), allow for the accurate prediction of other’s behavior (Kluckhohn, 1951), and make successful interpersonal interactions more likely (Meglino et al. 1989). Academics and practitioners argue that the performance
- 17. 17 of an organization is dependent on the degree to which the values of the culture are widely shared (Peters and Waterman, 1982; Deal and Kennedy, 1982; Denison, 1990; Ouchi, 1981; Pascale and Athos, 1981 and Kotter and Heskett, 1992). Similarly, it is widely argued that shared and strongly held values enable management to predict employee reactions to certain strategic options and by reducing these values, the consequences maybe undesirable (Ogbonna, 1993). Druckman in 1994 observed that loyalty and commitment both interpret an emotional bonding between the individual and his or her cultural group and, as such, imply a willingness to put forth exertion and make sacrifices on behalf of that group. However, whether loyalty and commitment are positively correlated with performance craved by the organization or not may depend on what values and norms the target cultural group holds regarding performance. O’Reilly (1989) suggests that employee’s commitment to an organization will be more dedicated because they care about their organization’s fate, and their caring heightens the power of organizational norms to control their behavior. Tuchman and O’Reilly in 1997 observed in the context of creativity and innovation also trigger the performance of employees and facilitated by organizational culture stated that organizational culture lies at the heart of organizational norms that reflects the influence of organizational culture on creativity and innovation. Organizations Culture can play an important role in creating the environment that
- 18. 18 enables learning and innovative response to challenges, competitive threats, or new opportunities. Thus, creating and influencing an adaptive culture is one of a manager’s most important jobs (Daft, 2010). According to researchers Emery & Trist in 1960, the organizational effectiveness depends on both the technical and social structure of the organization. Some social physiological structure may be superior to others for both employee satisfaction and productivity. Organizational effectiveness results when there is congruence between social and technical organizational dimension. Akin and Hopelain (1986) have discussed about the crucial relationship between organizational culture, employee performance and productivity in their research on organizational culture and productivity; and introduced “culture of productivity” where they illustrate the components of a productive culture such as efficient people, job identification, teamwork, trust and support etc are determined by knowledge of job and the performance. Akin and Hopelain (1986) also argue that a culture of productivity is based on three basic structures and they are: legibility (clarity), coherence (integration of the elements of work) and open-endedness (adaptability to change). Martin in 1992 states that organizational culture can be backed up by the abundance of theoretical concepts and perspective provided at current time and according to the researchers Harris and Ogbonna, 1999, organizational disciplines which utilize the concept. Highly collective organizations emphasize group harmony,
- 19. 19 cooperation and reward for enhancing employee performance (Javidan & Dastmalchian 2009). At the more operational level, the higher performing organizations have a management style that includes giving more freedom to their managers to take independent actions rather than simply following orders, to take reasonable risks and to openly discuss conflicts and constructive criticisms. High humane oriented organizations reward people who are fair, altruistic, friendly, generous, kind (Javidan & Dastmalchian 2009). Managers get adequate information and support for decision making (decision-making structure) and they are given rewards and benefits based on performance that compare favorably to similar organizations (compensation). Northouse (2004) asserts that all the leaders have an agenda, a set of beliefs, proposals, issues, ideas and values which they wish to put in the table. These set of organizational culture are promoted by the leader and it has significant impact on the values exhibited by the organization. Competitive advantage which is the unique selling point of companies’ performance is also supported and built up by the leaders and their inputs in organizational culture. Kotler and Keller (2006) define competitive advantage as company’s ability to perform in one or more ways that competitors cannot and these cultural leaders achieve it by creating organizational culture to make employees believe that the substance of the performance is the most crucial (Schein, 2004).
- 20. 20 Feldman and March, 1981; and Daft and Weick, 1984 asserted that precise information and applicable knowledge always assist performance, whereas erroneous information and irrational knowledge are likely to do the opposite. Cultures also provide cognitive frameworks through which people interpret what they observe and experience and provide language and referents to use in communicating with others (Wilkins and Ouchi, 1983). Dutton and Jackson, 1987 researched on strategic decision making which showed that different managers may interpret identical events as opportunities or threats and that these interpretations, in turn, are related to the actions taken. Researchers Siegal and sussman (2003) asserted that social interaction which surrounds knowledge adoption and helps to integrate social construction and social presence can actually explain information sharing process. Their studies interpreted information as a factor which is embedded in a social context that establishes both information interpretation and its sharing process. According to Hofstede, 1990 as culture differs from country to country and organization to organization, proposed theories often become problematic when they attempt to model the actual detail and richness of real organizations because of the complexity of interrelationships between organizational processes. Researchers often fail to isolate and measure many important organizational variables that are needed for theoretical background checking. Clearly, concerns should be raised on quantifying
- 21. 21 and measuring the conceptualization of organization cultures characteristics but it also leads to research possibility as well (Hofstede 1990, Mackenzie 1986, Schein 1990). Venketeshwara and Anantharaman in 1996 studied that there are two groups of employees having differences perceptions of organizational climate. One of the two groups of employees is that group which has come across with one or two accidents at their workplace and another group is that which has never faced any accident and having total clean and safety record. According to the study here are certain dimensions of accidents (i.e. risk, reward, warmth and support, and conflict) less favorably than the accident- free group. Stannack, 1996 stated that performance is often used to describe everything from efficiency and effectiveness to improvement and previous literature studies obviously show evidence of positive relationship between organization culture and its performance. Hitt et al (2001), intangible resources are more likely than tangible resources to produce a competitive advantage. Tecce (2000) supported this theory that a firm’s superior performance depends on its ability to defend and use the intangible assets it creates. Researchers like Mathew, 2007, Trice and Beyer, 1984; Hofstede, Neuijen, Ohayv and Sanders, 1990, researches stroked the link between some phases of organizational culture and their consequences that affect employee performance and as
- 22. 22 a result affect productivity. Peters & Waterman (1982); Sadri & Lees (2001) and Deal & Kennedy (1982) and Thompson (2002) stated that strong organizational culture is a primary determinant in creating better organizational performance and sustained competitive advantage. According to the study by Hewitt Associates (1994), the impact of performance management on organizational success substantiates that performance management system can have a significant impact on financial performance and productivity. The study used the Boston Consulting Group/HOLT financial database to track the financial performance of 437 publically held U.S. companies from 1990 through 1992. The study results showed that: Companies with performance programs have higher profits, better cash flows, stronger stock market performance and a greater stock value than companies without performance management. Productivity in firms without performance management is significantly below the industry average, while productivity in firms with performance management is on par with the industry average. Companies with performance management significantly improved their financial performance and productivity after implementing performance management. Hofstede (1990), Rousseau (1990), Smircich (1983) and Louis (1983) admit that organizational culture is holistic and socially constructed by the members of the organization and some visible features can be measured about the influences on an organization’s employee performance. From numerous “culture surveys” it have been
- 23. 23 claimed that employee performance can be improved by developing and creating certain kinds of organizational cultures (Sackman and Bertelsman, 2006 and Denison, 1990,). It can be inspected that although some aspects of organizational culture have been scrutinized for their productivity, as in-depth analysis of the various aspects of organizational culture is absent in such researches (Mathew, 2007). According to Furnham and Gunter (1993), organizational culture functions as the internal integration and coordination between firms operations and its employees. Internal integration can be described as the societal interaction of new members with the existing ones, creating boundaries of the organization feelings of identity among personals and commitment to the organization. Shared system which forms the basis of communication and mutual understanding in organization is due to its culture and if the organizational culture fails to fulfill these functions at satisfactory level, the culture may have significant negative influence on the efficiency of the employees (Furnhum and Gunter, 1993). Findings of research conducted by Renn and Vandenberd (1995) demonstrate a conceptual linkage between organizational culture and employee performance. Most organizations assert its performance as a dependent variable which seeks to recognize other independent variables that produce variations in its performance (March and Sutton, 1997). Martin and Siehl (1990) argue that organizational culture is theoretically related to performance and do have positive influence on it. Explaining
- 24. 24 the variation in performance of effectiveness, Bowen et al. (1989) in his relevant work highlighted that the role of culture is very vital in nurturing, sustaining and enhancing the performance of organizations. In addition to this, Kopelmal et al. (1990) clarified that cultural system of any organizations adds to the coordination of assignments and minimizes inefficiency employee efforts and firm’s resources. Williams (2002) identifies globalization, increased competition and the increasingly individualistic rather than collective employee relationship as some of the major drivers contributing to the increased visibility of performance management systems (PMS). Faced with fast moving and competitive environments, companies are constantly searching for unique ways in which to differentiate themselves from their competition and are increasingly looking to their “human resources” to provide this differentiation. This has led to much interest in the performance of employees, or more importantly, how to get the most out of employees in order to sustain competitive success. Early studies have indicated that there exist relationship between organizational culture and its performance. Magee (2002) in this very point argued that organizational culture is inherently connected to organizational practices; therefore organizational performance is conditional on organizational culture. According to Hellriegel & Slocum (2009), organizational culture can enhance performance in a large scale if it can be understood that what sustains a culture. According to these
- 25. 25 authors the culture of an organization allows the employees to be acquainted with both the firm’s history as well as current methods of operation and this specific detection endows the employees with guidance about expected and acceptable future organizational behaviors and norms. A strong organizational culture supports adaptation and develops organization’s employee performance by motivating employees toward a shared goal and objective; and finally shaping and channeling employees’ behavior to that specific direction should be at the top of operational and functional strategies (Daft, 2010). A firm’s mission reflects its ultimate long term objective which is accomplished by conducting integrated operational and behavioral activities. A firm’s performance improves if it has a clear sense of purpose and commitment towards its mission. Successful and well performed organization defines its organizational goals as the report card of forthcoming (long term) future (Ohmae, 1982; Mintzberg, 1987; Hamel and Prahalad, 1994).
- 27. 27 VISION Create a company that India is proud of. MISSION To make Sona “a partner of choice” to global customers. An organization of energized and involved employees growing and achieving high profitability. Supplying to major global OEMs directly or indirectly. At least 50% of sales overseas. Be #1 in every business line. MOTTO: THINK Aim To develop the skill of individuals The Sona Group History The Sona Group was founded in 1987 to manufacture components for the automotive industry. Today it is a USD 800 million multi-national – with over 16 plants across India, 3 in Germany and 1 in the USA. Sona has been started with 50 Lakh investments. The group also has a strategic position in Fuji Autotech, Europe - which has subsidiaries in Brazil, France, Sweden and the Czech Republic. Starting out as a “Manufacture to Print” organization, the group today boasts having created its own IPR particularly in the areas of power steering for off highway applications and precision forging.
- 28. 28 The Sona Group has engineering capabilities in the areas of machining and assembly, precision forging, cold & hot forging and heat treatment. The Group’s range of products primarily consists of steering and driveline components for the automotive OEM segment namely passenger cars, utility vehicles, commercial vehicles and specialty vehicles. The Group is committed to expansion of its products range and clientele by continuous investment in research and development. SONA is drawing upon the strength of its joint venture partners which include JTEKT Corporation, Japan and Mitsubishi Materials Co., Japan to upgrade its systems, skills and production values to offer its customers contemporary and high quality products. The Group boasts the world’s largest precision forging enterprise, India’s largest steering systems manufacturer – recognized in 1997, by the World Economic Forum. Sona Koya Steering Systems Ltd, with a Market Share of 50% is the largest manufacturer of Steering gears in India and a leading supplier of Hydraulic Power Steering Systems, Manual Rack & Pinion Steering Systems, Collapsible, Tilt and Rigid Steering Columns for Passenger Vans and MUVs. In addition to this the Companies product also includes Rear Axle Assemblies and Propeller Shafts. The Company is a Technical and financial Joint Venture Company of Koyo Seiko Company, Japan, a global technology leader in Steering Systems. In value terms it is second largest player with over 30% share. This imbalance is mainly due to sonas
- 29. 29 product mix; still the low value manufacturing steering systems contributes more to sales than power steering systems. The company has technical Collaboration from Koyo Seiko Company, Japan and Mando Machinery Corp of Korea. Koyo Seiko Company holds 20.47% Equity Stake of the company. Product Profile ∑ Power Rack and Pinion Steering System ∑ Clutch Driven Plates ∑ Power Re-circulating Ball Screw Steering System ∑ Ball Joints ∑ Electrical Power Steering System ∑ Tie Rod Ends ∑ Manual Rack And Pinion Steering System ∑ Suspension Components ∑ Warm Forged Synchronizer Rings ∑ Tilting and Collapsible Column Assembly ∑ Universal Joints ∑ Cold Forged Steering Studs ∑ Propeller Shafts ∑ Cold Forged Ball Studs ∑ Rear Axle Assemblies
- 30. 30 ∑ Cold Forged Case/Socket ∑ Sub-differential Assemblies ∑ Cold forged Spiders and Yokes ∑ Rigid Type Collapsible Column Assembly POWER RACK AND PINION STEERING Clutch Driven Plates Power Re-circulating Ball Screw Steering System
- 31. 31 Ball Point Electrical Power Steering System
- 32. 32 Tie Rod Ends Manual Rack And Pinion Steering System
- 33. 33 Suspension Components Warm Forged Synchronizer Rings
- 34. 34 Tilting and Collapsible Column Assembly Cold Forged Steering Studs Rear Axle Assemblies
- 35. 35 Cold Forged Case/Socket Sub-differential Assemblies Cold forged Spiders and Yokes
- 36. 36 Rigid Type Collapsible Column Assembly
- 37. 37 SONA KOYO JOURNEY 1985 – Technical Collaboration agreement with koyo Seiko, Japan (now JKEKT Corp.) to manufacture manual steering gear, key supplier to Maruti Udyog Ltd. 1987 – Commencement of production after completion of project for manufacture of Rack & Pinion Steering Gears and Steering columns with a capacity of 125000 Nos. 1988 – Came out with a 2-3 crore public issue to part finance its Rs. 11.62 crore project. 1991 - Came out with a rights issue of PCDs to finance the capacity expansion from 1.25 lac pa to 1.75 lac pa 1992 – Equity Participation (8%) by Koyo. 1992-93, the capacity of Steering Gear Assembly was expanded from 125000 Nos to 315000 Nos. 1994 – ISO 9002 Certification by TUV-CERT Germany. 1995 – Technical collaboration with Koyo for manufacture of power steering gear. 1997 - Implemented the power steering project at a total cost of Rs.11 corers and koyo increased equity stake to 20.5%. 1998 – Company setup a 2nd plant at Chennai and name of Sona Steering Systems Ltd. Changed to Sona Koyo Steering System Ltd. with a total investment of Rs.724.30 Lacs for steering requirements of Hyundai. The capacity was expanded from 315000
- 38. 38 No’s to 550000 No’s, Axle Assemblies from 50000 No’s to 92000 No’s and Propeller Shaft with capacity of 146000 was created during the year. 2000 – QS 9000/ISO 9001 Certification by TUV-CERT Germany 2002 – ISO 14001 Certification by TUV-CERT Germany & set up an R & D Division, where engineers developed a new, lighter weight collapsible steering column 2003 – Deming award by JUSE, JAPAN & ISO/TS 16949:2002 Certification by TUV- CERT Germany 2004 - The company bought 21% stake in Fuji Autotech France S.A.S (FAF). The company also entered into Joint Venture with Fuji Kiko Co Ltd Japan (associated company of Koyo Seiko Ltd Japan) in France. 2005 – Establishes presence in North America through Sona Auto comp Inc. 2006 – Establishing presence in Europe through Sona Auto comp Europe S.A.R.L. 2007 – Recipient of TPM Award and 3 Joint Venture formed JSAI, SFAL, and AAM Sona. Sona Koyo has technical and financial collaboration with JTEKT Corporation, Japan (formally known as Koyo Seiko Co), and the largest producer of passenger vehicles' steering systems in the world. The company also has a technical collaboration with Mando Corporation, Korea. As part of Sona Koyo Steering Systems’ (SKSSL) globalization strategy, the company has acquired a position in Fuji Autotec France,
- 39. 39 SAS, and the 4th largest steering system supplier in Europe. Via Fuji Autotec, the Sona Group's footprint extends to Eastern Europe and South America. Sona Koyo Steering Systems has three plants located in Gurgaon, Chennai and Dharuhera. The Sona Group firmly believes in creating strong partnerships. The Group consists of nine automobile components manufacturing companies and three services companies in the areas of engineering design and mobility. The Sona Group has technical and marketing alliances with many domestic and international majors. The Group today employs over 3500 people, and has revenues a little in excess of $ 760 million. Joint Ventures ß JTEKT Sona Automotive India (JSAI) ß Sona FUJI KIKO Automotive ß Arjan Stampings
- 40. 40 ß AAM Sona Axle Group Companies ß Sona Okegawa Precision Forgings ß Sona BLW Prazisionsschmiede ß Sona Somic Lemforder Components ß Mahindra Sona ß Sona Mobility Services (Sixt India) Milestones: ß January 1985 - Technical Collaboration Agreement with Koyo Seiko Co., Japan, for manufacturing ß October 1987 - Commencement of Production - Manual Steering Gear - Manual Steering Column ß September 1994 - ISO-9002 Certificate by TUV-CERT, Germany ß July 1996 - Production of Hydraulic Power Steering Gear
- 41. 41 ß December 1998 - Established plant in Chennai ß October 2003 - Established Export Oriented Unit (EOU) in Chennai ß November 2003 - 'Deming Award' by JUSE, Japan ß October 2004 - Acquired 21% stake in Fuji Autotech France ß March 2006 - Started production of column-type Electric Power Steering ß February 2007 - Established plant at Dharuhera, Haryana ß July 2007 - JTEKT-Sona Automotive India Ltd. (JSAI) ß Sep 2007 - Sona-Fuji Kiko India Ltd (SFAI) ß 2007- TERI AWARD FOR ENVIRONMENTAL EXCELLENCE ß Jan 2008 - TPM Excellence Award ß Mar 2010 - US Patent for Torque Sensor for EPAM ß Aug 2010 - Arjan Stampings Ltd. renamed as Sona Stampings Ltd. ß Sep 2010 - US Patent for Electric Power Assist Motor (EPAM) ß Feb 2011 - Production starts at SKSSL Sanand, Gujarat plant Perseverance ÿ Sona steering started in - 1985
- 42. 42 ÿ Sona Group 2015 Now - 16 Plants in India 3 Plants in Germany 1 Plant in USA
- 43. 43 CHAPTER 4 & 5 DATA ANALYSIS AND INFERENCES
- 44. 44 SECTION A Table I Designation ASSISTANT GENERAL MANAGER 3% ASSISTANT MANAGER 3% ENGINEER 6% EXECUTIVE 6% DY.MANAGER 3% SECTION ENGINEER 5% SECTION EXECUTIVE 4% ASSOCIATE 19% OPERATORS 51%
- 45. 45 Analysis: The above chart shows, 3% of employees are Assistant General Manager, 3% of employees are Assistant Manager, 6% are Engineer, 6% are Executive, 3% of employees are Dy.Manager, and 5% are Section Engineer, 4% are Section Executive, 19% of employees are Associate and 51% are Operators respectively. Interpretation: - Majority of employee in the organization is operators who are handling the production process. Table II Length of service with the current organization Less than 6 months 15% 6 -12 months 0% 3% 3% 6% 6% 3% 5% 4% 19% 51% Chart Title ASSISTANT GENERAL MANAGER ASSISTANT MANAGER ENGINEER EXECUTIVE DY.MANAGER SECTION ENGINEER SECTION EXECUTIVE ASSOCIATE OPERATORS
- 46. 46 1-2 year’s 17% More than 2 years 68% CHART II Analysis: The above chart shows, 68% of employees are working in the organization for more than 2 years, 17% of employees are in this organization from 1-2 year’s, none of the employee is working in the organization from 6-12 months and only 15% of the employees had worked less than 6 months. Interpretation: - From the above analysis it concludes that the majority of employees are working for more than 2 years in this organization Table III Age Less than 25 years 38 25 – 40 50 15% 0% 17% 68% Less than 6 months 6 -12 months 1-2 year’s More than 2 years LENGTH OF SERVICE Series1
- 47. 47 years More than 40 years 12 Analysis: The above chart shows that 50% of employees are from the age group of 25- 40 years, 12% are from the age group of more than 40 years and 38% of employees belong to the age group of less than 25 years. Interpretation: - From the above analysis it concludes that organization is comprising employees from the age group of 25-40 years. Table IV Gender Gender %age of respondents 38% 50% 12% AGE Less than 25 years 25 – 40 years More than 40 years
- 48. 48 Male 98% Female 2% Analysis: The above chart shows that 98% of employees in the organization are male and 2% of employees are female. Interpretation: - From the above analysis it concludes that the company has less number of female employees. Table V Educational Qualification 98% 2% Male Female Gender Series1 Educational Qualification %age of Respondents Secondary School 3% Degree/ 82%
- 49. 49 Analysis: The above chart shows that the 3% of employees are having qualification of secondary school, 82% of employees having qualification of degree/diploma and 15% of employees are post graduate. Interpretation: - From the above analysis it concludes that the majority of employees are having the qualification of degree/diploma Table VI Department 3% 82% 15% Secondary school Degree/ Diploma Post-Graduation Educational Qualification Percentage Diploma Post- Graduation 15% DEPARTMENT %age of Respondents Production 38%
- 50. 50 Production 38% Sales 5%Quality 16% HR 4% PRC 6% SCM 3% ME 4% PPC 7% Accountant 3% Tool room 5% Maintenances 7% store 2% DEPARTMENT Sales 5% Quality 16% HR 4% PRC 6% SCM 3% ME 4% PPC 7% Accountant 3% Tool room 5% Maintenances 7% Store 2%
- 51. 51 Analysis: The above chart shows that organization comprises of 38% of employees are working in the production department, 5% are from the sales department,16% are from the quality department, 4% are from HR and admin department, 6% are from PRC department, 3% of employees are from SCM department, 4% are from ME department, 7% are from PPC department, 3% are in Account department, 5% are from Tool Room department, 7% are in the Maintenance department and 2% are from the Store department respectively Interpretation: - From the above analysis it concludes that the organization is having maximum number of employees are in the production department. SECTION B A. Organizational Decisions/Communication (Manager)/ Employee’s Involvement Table 1:- The Manager is willing to share Decision-making power with employees Particular No. of Respondents %age SD 0 0 D 0 0 N 13 13%
- 52. 52 A 29 29% SA 58 58% Chart 1 Analysis: As per the chart, 58% employees are strongly agree, 29% employees are agree that their manager is willing to share Decision-making power with employees and 13% employees are neutral. 0% employees are strongly disagreeing and disagree with the topic that only managers are taking decision. Interpretation: - From the above analysis it concludes that the managers are taking decisions with the suggestions made by the employees. Monopoly of mangers in decision making is absent. Table 2:- I have input into Organizational decisions 0 0 13% 29% 58% SD D N A SA Decision Making With Employees Series1
- 53. 53 Particular No. of Respondents %age SD 0 0 D 0 0 N 11 11% A 25 25% SA 64 64% Chart 2 Analysis: - As per the chart, 64% & 25% employees are strongly agree & agree that they have input into organizational decisions, whereas 11% employees are neutral and 0% employees are disagree and strongly disagree to the topic. Interpretation: - From the above analysis it concludes that the mostly employees are agreed that there is contribution of employees in decision making that is related to the organization. 0 0 11% 25% 64% SD D N A SA Employees Input In Decision Making Series1
- 54. 54 Table 3 I have freedom to make important decisions regarding my work Particular No. of Respondents %age SD 3 3% D 5 5% N 12 12% A 19 19% SA 61 61% Chart 3 Analysis: - As per the chart 61% & 19% employees are strongly agree and agree that they can make decision regarding their work, 12% employees are neutral that they 3% 5% 12% 19% 61% SD D N A SA Freedom To The Decision Related To Work Series1
- 55. 55 might be able to take decision regarding their work. Others 3% and 5% employees are strongly disagree and disagree that they can’t take decision regarding their work. Interpretation: - From the above analysis it concludes that employees have freedom to take important decision related to their work. An employee can make effective decision related to their work. Table 4 My Organization communicates effectively and in a timely manner to its employees Chart 4 Particular No. of Respondents %age SD 0 0% D 5 5% N 8 8% A 19 19% SA 68 68%
- 56. 56 Analysis: - From the above chart, 68%, 19% & 8% employees are strongly agree, agree and neutral respectively. 5% employees are not agreeing that organization is communicating with the employee regularly. Some important information or instructions are communicated to its employees effectively and in a timely manner to its employees. Interpretation: - From the above analysis it concludes that the organization is communicating with its employee effectively and in a timely manner. This is important to keep interest of their employees in their company. It is good that company is communicating to its employees timely and effectively. Table 5 My Organization shares information with others who should know it Particular No. of Respondents %age 0% 5% 8% 19% 68% SD D N A SA Organization Communicates To Its Employees Series1
- 57. 57 SD 2 2% D 2 2% N 9 9% A 22 22% SA 65 65% Chart 5 Analysis:- As per the chart, it shows that 65% & 22% employees are Strongly agree & agree that organization is sharing information to the employee’s who should know it. While 9% employees are neutral that the organization shares the information to the person who should know it and 2% employees are strongly disagree and disagree. Interpretation: - From the above analysis it concludes that the organization is sharing information to the person who should know it. Table 6 There is a Two-way communication between employer and employee 2% 2% 9% 22% 65% SD D N A SA Organization Shares Information Series1
- 58. 58 Particular No. of Respondents %age SD 2 2% D 3 3% N 4 4% A 20 20% SA 71 71% Chart 6 Analysis: - From the chart it is found that 71% employees states that there is a two way communication between employer and employee, 20% agree, 4% neutral, 2% and 3% are strongly disagree and disagree respectively. Interpretation: - From the above analysis it concludes that the employer and employee are communicating with each other timely to increase the effectiveness of work. 2% 3% 4% 20% 71% SD D N A SA Two-way Communication Between Employer And Employee Series1
- 59. 59 Table 7 My manager/supervisor gives me regular feedback Particular No. of Respondents %age SD 3 3% D 4 4% N 4 4% A 21 21% SA 68 68% Chart 7 Analysis: - Above chart shows that employees who are strongly agreed that their manager/supervisor gives regular feedback are 68%, while 21% agree, 4% neutral & disagree, and 3% strongly disagree respectively. Interpretation: - From the above analysis it concludes that the manager/supervisor gives employees regular feedback regarding their work. 3% 4% 4% 21% 68% SD D N A SA Manager/Supervisor Gives Regular Feedback Series1
- 60. 60 Table 8. I feel free to ask advice/support from my manager Particular No. of Respondents %age SD 3 3% D 3 3% N 10 10% A 18 18% SA 66 66% Chart 8 Analysis:- Above chart shows 68% & 18% employees are strongly agree and agree that they feel free to ask advice/support from their manager, 10% neutral and 3% are disagree and strongly disagree respectively. Interpretation: - From the above analysis it concludes that the managers/supervisor is giving advice/support to the employees whenever they needed. 3% 3% 10% 18% 66% SD D N A SA Free To Ask Advice/Support From Manager Series1
- 61. 61 Table 9 I feel that my organization values my opinions Particular No. of Respondents %age SD 2 2% D 3 3% N 6 6% A 19 19% SA 70 70% Chart 9 Analysis: - The above chart shows that 70% employees are strongly agree that the organization values their opinions, whereas 19% agree, 6% neutral, 3% & 2% are disagree and strongly disagree respectively. 2% 3% 6% 19% 70% SD D N A SA Organization Values Opinions Series1
- 62. 62 Interpretation: - From the above analysis it concludes that the organization values their employee’s opinion. This result in good performance of employee as well as company’s too. Table 10 Everyone’s contribution is noted and respected by the organization Particular No. of Respondents %age SD 2 2% D 2 2% N 9 9% A 23 23% SA 64 64% Chart 10 2% 2% 9% 23% 64% SD D N A SA Contribution Is Noted And Respected Series1
- 63. 63 Analysis:- As per the chart 64 % employee’s are strongly agree to the topic that everyone’s contribution is noted and respected by the organization, where 23% employee are agree, 9% neutral, 2% are strongly disagree and disagree Interpretation: - From the above analysis it concludes that everyone’s contribution is noted and respected by the organization whether it is from lower level or higher level. Table 11 Management uses the employee feedback for continues growth & development Particular No. of Respondents %age SD 3 3% D 3 3% N 6 6% A 26 26% SA 62 62% Chart 11
- 64. 64 Analysis: - As per the chart 62% employees strongly agree that Management uses the employee feedback for continues growth & development, 26% agree, 6% neutral and 3% are disagreeing and strongly disagree. Interpretation: - From the above analysis it concludes that the management of the company is using employee feedback for continues growth & development of company. Table 12 My personal job performance is important to the success of my organization. Particular No. of Respondents %age SD 1 1% D 1 1% N 4 4% A 21 21% 3% 3% 6% 26% 62% SD D N A SA Uses Employee Feedback For Growth & Development Series1
- 65. 65 SA 73 73% Chart 12 Analysis: - The above chart shows that 73% employees are strongly agree that their personal job performance is important to the success of organization, 21% employees are just agree that their performance is important to the success of their organization, 4% employees are neutral and only 1% employees are strongly disagree and disagree that their job performance is effecting success of their organization. Interpretation: - From the above analysis it concludes that the majority employees strongly agreeing that their job performance is important for the success of organization. It is good for the organization that majority employees are concerned regarding their job performance for the success of organization. Teamwork/ Colleagues/ Peer communication 1% 1% 4% 21% 73% SD D N A SA Job Performance Important For Success Of Organization Series1
- 66. 66 Table 13 There is good team work & cooperation in my organization. Particular No. of Respondents %age SD 2 2% D 3 3% N 12 12% A 21 21% SA 62 62% Chart 13 Analysis:- The above chart shows that 62% employees are strongly agree that in this organization there is good team work and cooperation in their organization, whereas 21% agree, 12% neutral, 2% and 3% are strongly disagree and disagree respectively. 2% 3% 12% 21% 62% SD D N A SA Good Team Work & Cooperation Series1
- 67. 67 Interpretation: - From the above analysis it concludes that the majority employees are happy that there is a good team work and cooperation in their organization. Table 14 Employees in my team cooperate with each other to get the job done Particular No. of Respondents %age SD 2 2% D 3 3% N 6 6% A 22 22% SA 67 67% Chart 14 Analysis:- The above chart shows 67% employees are strongly agree that employees cooperate with each other to get the job done in the team, 22% agree, 6% neutral, while 2% and 3% are strongly disagree and disagree respectively. 2% 3% 6% 22% 67% SD D N A SA Team Cooperate To Get The Job Done Series1
- 68. 68 Interpretation: - From the above analysis it concludes that the employees in their team cooperate with each other to get the job done. There is a good cooperation among employees to get the job done. Table 15 Sufficient encouragement is provided by the teammates at work Particular No. of Respondents %age SD 1 1% D 4 4% N 4 4% A 26 26% SA 65 65% Chart 15 1% 4% 4% 26% 65% SD D N A SA Encouragement Provided By Teammates At Work Series1
- 69. 69 Analysis: - The above chart shows 65% employees strongly agrees that there is enough encouragement provided at work by teammates, 26% employees are agreeing, 4% are neutral and disagree & 1% are strongly disagree. Interpretation: - From the above analysis it concludes that the there is sufficient encouragement is provided by the teammates at work. The coordination is good between the employees while working in team. Table 16 Everyone is encouraged to participate in groups/teams Particular No. of Respondents %age SD 2 2% D 2 2% N 7 7% A 21 21% SA 68 68% Chart 16
- 70. 70 Analysis:-Above chart shows 68% of employees are strongly everyone is encouraged to participate in groups/teams, employees who are just agreeing are 21%, 7% neutral, and 2% are strongly disagree and disagree respectively. Interpretation: - From the above analysis it concludes that the organization is encouraging everyone to participate in groups/teams. The contribution of every employee is mandatory in the team work. Table 17 Team meetings are conducted regularly Particular No. of Respondents %age SD 2 2% D 1 1% N 5 5% A 23 23% 2% 2% 7% 21% 68% SD D N A SA Encouraged To Participate In Groups/Teams Series1
- 71. 71 SA 69 69% Chart 17 Analysis: - As per the chart, 69% employees are strongly agreed regarding the regularity of conducting team meetings, 23% agree that team meetings are conducted regularly, 5% neutral, 1% disagree and 2% strongly disagree respectively. Interpretation: - From the above analysis it concludes that the team meetings are conducted on a regular basis for getting job done. Table 18. Team success is celebrated as a group achievement Particular No. of Respondents %age SD 1 1% D 1 1% N 6 6% 2% 1% 5% 23% 69% SD D N A SA Team Meetings Conducted Regularly Series1
- 72. 72 A 25 25% SA 67 67% Chart 18 Analysis:- The above Chart shows that 67% employees are strongly agrees team success is celebrated as a group achievement, 25% agree, 6% neutral and 1% are strongly disagree and disagree. Interpretation: - From the above analysis it concludes that the teams of the company are celebrating their team success as a group achievement. The celebration is done to maintain the enthusiasm in the team members. 1% 1% 6% 25% 67% SD D N A SA Team Success Celebrated As A Group Achievement Series1
- 73. 73 Table 19 I am recognized & respected [in my team/ by my teammates] Particular No. of Respondents %age SD 1 1% D 3 3% N 4 4% A 31 31% SA 61 61% Chart 19 Analysis:- The above chart shows that 61% employees are strongly agrees as they are well recognized and respected while working in teams, 31% agreeing, 4% are neutral, 3% are disagree and 1% are strongly disagree. Interpretation: - From the above analysis it concludes that the teams in company are respecting each employee and all are recognized while working in team. This is good for the company to work. 1% 3% 4% 31% 61% SD D N A SA Employees Are Recognized & Respected Series1
- 74. 74 Table 20 I am happy to be working in team than alone Particular No. of Respondents %age SD 0 0% D 0 0% N 4 4% A 27 27% SA 69 69% Chart 20 Analysis: - Above chart is showing 69% of employees are strongly agreeing that they are happy to work in teams than alone, 27% of employees agree, 4% are neutral and 0% are strongly disagree and disagree with this. Interpretation: - From the above analysis it concludes that the employees are very likely to perform in team rather than performing alone. None of the employee is interested in working alone. 0% 0% 4% 27% 69% SD D N A SA Happy To Be Working In Team Than Alone Series1
- 75. 75 Table 21 All the staff in my department is friendly and supportive Particular No. of Respondents %age SD 1 1% D 1 1% N 3 3% A 22 22% SA 68 68% Chart 21 Analysis:- The chart shows that employees who saying that they are strongly agree with the supportive and friendly staff in their department are 68%, 22% agree, 5% are just neutral, 2% are strongly disagree and 3% of employees are disagree. 2% 3% 5% 22% 68% SD D N A SA Staff In Department Is Friendly And Supportive Series1
- 76. 76 Interpretation: - From the above analysis it concludes that the mostly employees are strongly agree that the staff of their department is friendly and supportive & minimum employees are neutral, strongly disagree and disagree. Table 22 All the information is shared equally in my department Particular No. of Respondents %age SD 1 1% D 1 1% N 3 3% A 25 25% SA 70 70% Chart 22 1% 1% 3% 25% 70% SD D N A SA Information Shared Equally In Department Series1
- 77. 77 Analysis:- As per the chart, 70% employees strongly agrees with the sharing of information equally in their department while 25% agrees, 3% neutral and employees are strongly disagree and disagree respectively. Interpretation: - From the above analysis it concludes that the information is given/shared equally to the members in the department Table 23 Individual differences are respected [Age, gender, education, caste...] Particular No. of Respondents %age SD 0 0% D 0 0% N 6 6% A 29 29% SA 65 65% Chart 23 0% 0% 6% 29% 65% SD D N A SA Individual Differences Are Respected Series1
- 78. 78 Analysis:- As per the chart, 65% of employees are strongly agrees that the individual difference [Age, gender, education, caste...] is respected, on the other hand 29% employees are agree, 6% neutral and 0% are strongly disagree and disagree with this. Interpretation: - From the above analysis it concludes that the individual differences [age, gender, education, caste...] are respected by each individual of the organization. Job Factors/ Control/ Demands/ Role clarity Table 24 I have clear understanding of the goals and objectives of my organization Chart 24 Particular No. of Respondents %age SD 0 0% D 0 0% N 8 8% A 22 22% SA 70 70%
- 79. 79 Analysis: - From the above chart it is clear that 22% of employees agree that they have the clarity of the organization’s goal and objective, 70% strongly agree, 8% neutral and 0% are strongly disagree and disagree. Interpretation: - From the above analysis it concludes that the each employee has the clarity of goals and objectives. Table 25 I have no doubt that what I do on my job is really important Particular No. of Respondents %age SD 0 0% D 0 0% N 6 6% A 23 23% SA 71 71% 0% 0% 8% 22% 70% SD D N A SA Clarity Of The Goals And Objectives Of Organization Series1
- 80. 80 Chart 25 Analysis:- According to the above chart, 71% employees are strongly agreed that they have clear knowledge of what they do on their job is really important to the company, 23% agree, 6% neutral and 0% are strongly disagree and disagree. Interpretation: - From the above analysis it concludes that the all employees know what they do on their job is important for the company. Table 26 I am encouraged to develop new & more efficient ways to do my work Particular No. of Respondents %age SD 4 4% D 2 2% N 5 5% 0% 0% 6% 23% 71% SD D N A SA No Doubt What Is Done On Their Job Is Really Important Series1
- 81. 81 A 26 20% SA 69 69% Chart 26 Analysis:- As per the above chart 69% strongly agrees with the encouragement is provided to develop new and more efficient ways to do their work, 5% are neutral, 20% are agree, 4% are strongly disagree and 2% are disagree with this. Interpretation: - From the above analysis it concludes that the mostly employees responded that the company is giving encouragement to develop new & more efficient ways to do their work. Table 27 The amount of work I am expected to do is reasonable Particular No. of Respondents %age SD 2 2% 4% 2% 5% 20% 69% SD D N A SA Encouraged To Develop New & More Ways To Do Their Work Series1
- 82. 82 D 6 6% N 6 6% A 21 21% SA 65 65% Chart 27 Analysis:- The above chart shows that employees who are strongly agree with the amount of work given to them is reasonable are 65%, 21% agree, 6% are neutral and disagree, and 2% are strongly disagree with this. Interpretation: - From the above analysis it concludes that the work given to the employees are reasonable and some are not satisfied with the amount of their work. Table 28 The level of work responsibility given to me is appropriate Particular No. of Respondents %age SD 2 2% 2% 6% 6% 21% 65% SD D N A SA Amount Of Work Is Reasonable Series1
- 83. 83 D 4 4% N 8 8% A 22 22% SA 64 64% Chart 28 Analysis:- As per the above chart 64% employees are strongly agrees that their level of work responsibility is appropriate, 8% are neutral to the responsibility of their work, 22% are agree, 4% disagree and 2% are strongly disagree. Interpretation: - From the above analysis it concludes that the responsibilities of work to its employees are reasonable to them. Some of them might have the work responsibility more than the expectations. Table 29 There is possibility to perform multi-tasks in my department Particular No. of Respondents %age 2% 4% 8% 22% 64% SD D N A SA Level Of Work Responsibility Is Appropriate Series1
- 84. 84 SD 0 0% D 0 0% N 10 10% A 27 27% SA 63 63% Chart 29 Analysis:- The above chart represents that 63% are strongly agreed that there is a possibility of performing multi-tasks in their departments, 27% agree, 10% neutral and 0% are strongly disagree and disagree respectively. Interpretation: - From the above analysis it concludes that the sometimes there is a possibility of performing multi-task; some of the employees do not have much possibility of multi-task in their work. Table 30. My job is more challenging and exciting 0% 0% 10% 27% 63% SD D N A SA Possibility To Perform Multi-tasks In Their Department Series1
- 85. 85 Particular No. of Respondents %age SD 3 3% D 2 2% N 6 6% A 29 29% SA 60 60% Chart 30 Analysis: - According to this graph 60% employee strongly agrees that their job is more challenging and exciting while 6% employees are neutral, 29% agree, 2% disagree and 3% employees are strongly disagree respectively. Interpretation: - From the above analysis it concludes that the job of employees is more challenging and exciting. Table 31 I know what is expected of me during my job/work done 3% 2% 6% 29% 60% SD D N A SA Job Is More Challenging And Exciting Series1
- 86. 86 Particular No. of Respondents %age SD 0 0% D 0 0% N 5 5% A 22 22% SA 73 73% Chart 31 Analysis:- As per the above chart 22% employee agrees with that they know what is expected of them during their job/work done, 73% of employees are strongly agree and none of the employee is strongly disagree & disagree. Interpretation: - From the above analysis it concludes that the employee knows everything what is expected during their job/work done. Table 32 I understand day-to-day objectives of my department 0% 0% 5% 22% 73% SD D N A SA Know What Is Expected During Their Job/Work Done Series1
- 87. 87 Particular No. of Respondents %age SD 0 0% D 0 0% N 8 8% A 21 21% SA 71 71% Chart 32 Analysis:- Above chart shows that employees who are agreeing they understands the objectives of their department are 21%, 71% of the employees are strongly agree, 8% are neutral and none of the employees are strongly disagree and disagree respectively. Interpretation: - From the above analysis it concludes that the objectives of all the departments is understood by all of their members Table 33 My Job/responsibility is clearly described 0% 0% 8% 21% 71% SD D N A SA Understands Objectives Of Their Department Series1
- 88. 88 Particular No. of Respondents %age SD 0 0% D 0 0% N 4 4% A 30 30% SA 66 66% Chart 33 Analysis: - The above chart shows 66% of employees are strongly agreeing that their job/responsibility is clearly described to them, 30% are agree, 4% are neutral and 0% are strongly disagree and disagreed. Interpretation: - From the above analysis it concludes that the each employee has been given the clear description of their job/responsibility. D. Physical work conditions/Infrastructure/Resources 0% 0% 4% 30% 66% SD D N A SA Job/Responsibility Clearly Described Series1
- 89. 89 Table 34 The overall infrastructure provided by the organization is satisfying which includes the following factors I. Ventilation Particular No. of Respondents %age SD 0 0% D 0 0% N 12 12% A 24 24% SA 64 64% Analysis: - The above chart shows employees who are strongly agrees that there is a good ventilation system in the company are 64%, 24% of employees are agree, 12% neutral and none of the employees are strongly disagree and disagree. 0% 0% 12% 24% 64% SD D N A SA Ventilation Series1
- 90. 90 Interpretation: - From the above analysis it concludes that the plant has the ventilation system by which each employee do not complaint regarding the suffocation. II. Hygiene Particular No. of Respondents %age SD 0 0% D 0 0% N 12 12% A 24 24% SA 64 64% Analysis: - The above chart shows 64% of employees are strongly agree with the hygiene maintained in the organization, whereas 24% are agree, 12% are neutral and 0% are strongly disagree and disagree respectively. 0% 0% 12% 24% 64% SD D N A SA Hygiene Series1
- 91. 91 Interpretation: - From the above analysis it concludes that the organization is having a good hygiene for the working environment. III. Work-space Particular No. of Respondents %age SD 0 0% D 0 0% N 12 12% A 24 24% SA 64 64% Analysis: - As per the chart the employees who are agree with the work space in the organization are 24%, 12% of employees are neutral, 64% strongly agrees and 0% are disagree and strongly disagree. Interpretation: - From the above analysis it concludes that the employees are getting sufficient work place to work. The space for the work is sufficient as per the need of employees. 0% 0% 12% 24% 64% SD D N A SA Work-space Series1
- 92. 92 IV. Lighting and fans Particular No. of Respondents %age SD 0 0% D 0 0% N 12 12% A 24 24% SA 64 64% Analysis: - As per the chart 64% of employees are strongly agrees that the organization has a good lighting and fans, while 24% of employees are agree, 12% neutral and 0% are strongly disagree and disagree. Interpretation: - From the above analysis it concludes that the organization is having lights and fans by which employees can work comfortably. 0% 0% 12% 24% 64% SD D N A SA Lighting And Fans Series1
- 93. 93 V. Protection against heat/cold Particular No. of Respondents %age SD 0 0% D 0 0% N 12 12% A 24 24% SA 64 64% Analysis: - As per the chart 64% of employees are strongly agree that the organization is having protection against heat/cold, 24% agree, 12% neutral, and 0% are strongly disagree and disagree respectively. Interpretation: - From the above analysis it concludes that the company is having facility to protect its employees from the heat/cold. It is done to protect their employee’s health from the heat/cold. 0% 0% 12% 24% 64% SD D N A SA Protection Against Heat/Cold Series1
- 94. 94 VI. Cleanliness and neatness Particular No. of Respondents %age SD 0 0% D 0 0% N 12 12% A 24 24% SA 64 64% Analysis: - As per the chart the employees who are strongly agrees with the cleanliness and neatness is 64%, 24% agrees, 12% are neutral and none of the employees are strongly disagree and disagree. Interpretation: - From the above analysis it concludes that the organization also focuses on the cleanliness and neatness. It is also necessary to have cleanliness in the plant because small amount of dirt in the machines can affect the dimensions of the product. 0% 0% 12% 24% 64% SD D N A SA Cleanliness And Neatness Series1
- 95. 95 VII. Power-supply Particular No. of Respondents %age SD 0 0% D 0 0% N 12 12% A 24 24% SA 64 64% Analysis: - As per the chart 64% of employees are strongly agrees with the power supply in the organization, 24% agrees, 12% neutral, and none of the employees are strongly disagree and disagree respectively. Interpretation: - From the above analysis it concludes that the power supply is good in the organization. The production never stops due to the absence of power supply. 0% 0% 12% 24% 64% SD D N A SA Power-supply Series1
- 96. 96 VIII. Drinking water Particular No. of Respondents %age SD 0 0% D 0 0% N 12 12% A 24 24% SA 64 64% Analysis: - As per the chart, employees who are agreeing with the good drinking water are 24%, 12% neutral, 64% are strongly agree and 0% are disagree and strongly disagree. Interpretation: - From the above analysis it concludes that the employees are getting sufficient drinking water. The water shortage is not in the company. IX. Safety at work 0% 0% 12% 24% 64% SD D N A SA Drinking Water Series1
- 97. 97 Particular No. of Respondents %age SD 0 0% D 0 0% N 12 12% A 24 24% SA 64 64% Analysis: - As per the chart employees who are strongly agrees that there is a safety at work are 64%, 24% agrees, 12% neutral and 0% are disagree and strongly disagree respectively. Interpretation: - From the above analysis it concludes that the employees feel safety at the work place. Table 35 Adequate resources are provided to get the job done Particular No. of Respondents %age 0% 0% 12% 24% 64% SD D N A SA Safety At Work Series1
- 98. 98 SD 2 2% D 2 2% N 4 4% A 22 22% SA 70 70% Chart 35 Analysis:- Above chart shows 22% employees agreeing that the company is providing adequate recourses to get the job done, 70% employees strongly agree, 4% neutral and none of the employees are disagree and strongly disagree. Interpretation: - From the above analysis it concludes that the employees have adequate recourses to get the job done. They do not have complaint regarding absence of recourses that is required. Table 36. I can arrange my workplace as per my comfort 2% 2% 4% 22% 70% SD D N A SA Adequate Resources Provided To Get The Job Done Series1
- 99. 99 Particular No. of Respondents %age SD 3 3% D 4 4% N 11 11% A 23 23% SA 59 59% Chart 36 Analysis:- The above chart is showing that 59% employees strongly agrees with this they can arrange their workplace as per their comfort, 23% agree, 11% are neutral, 3% are strongly disagree and 4% are disagree respectively. Interpretation: - From the above analysis it concludes that the mostly employees have the work that can be arranged as per their comfort. Some work do not support the comfort of the employees, they can’t make any changes as they require. Table 37 My shift timings are flexible 3% 4% 11% 23% 59% SD D N A SA Arrange Workplace As Per Comfort Series1
- 100. 100 Chart 37 Analysis: - Chart shows 58% of employees are strongly agreed that the shift timing of the organization is flexible, 32% agrees, 5% are neutral, 2% are strongly disagree and 3% are disagree respectively. Interpretation: - From the above analysis it concludes that the timings of the shift is flexible to the employees. All employees are comfortable with the timings of their shift. 2% 3% 5% 32% 58% SD D N A SA Shift Timings Are Flexible Series1 Particular No. of Respondents %age SD 2 2% D 3 3% N 5 5% A 32 32% SA 58 58%
- 101. 101 Table 38 My activity at work involves a. Sitting Light work b. Sitting Moderate/ Heavy work c. Standing Light work d. Standing Moderate/ Heavy work Particular No. of Respondents %age A 29 29% B 26 26% C 21 21% D 22 22% CHART 38
- 102. 102 Analysis: - As per the above chart 29% of employee’s activity at work involves sitting light work, 22% of employees activity at work involves standing moderate/ heavy work, 26% of employee’s activity at work involves sitting moderate/ heavy work and 21% of employees activity at work involves standing light work. Interpretation: - The employees in the organization involves activity at work sitting light work, standing moderate/ heavy work, sitting moderate/ heavy work, standing light work. Table 39 Concern is shown for my health and safety at work place Particular No. of Respondents %age 29% 26% 21% 22% Activity At Work Involves Sitting Light work Sitting Moderate/ Heavy work Standing Light work Standing Moderate/ Heavy work
- 103. 103 SD 0 0% D 0 0% N 4 4% A 16 16% SA 80 80% Chart 39 Analysis:- As per the above chart the organization is having concern for the health and safety at work place of employees, 80% of the employees are strongly agree with this, 16% are agree, 4% are neutral and 0% are strongly disagree and disagree respectively. Interpretation: - From the above analysis it concludes that the company has the concern for its employee’s health and safety at the work place. E. Compensation/ Salary/ Benefits/ Recognition 0% 0% 4% 16% 80% SD D N A SA Concern For Health And Safety At Work Place Series1
- 104. 104 Table 40 My present salary is appropriate to the work I do Particular No. of Respondents %age SD 3 3% D 4 4% N 10 10% A 16 16% SA 67 67% Chart 40 Analysis:- The above chart shows 62% employees are strongly agree that the salary given to them is appropriate to their work, while 10% of employees are neutral, 17% are agree with this, 5% are strongly disagree and 6% of employees are disagree respectively. 3% 4% 10% 16% 67% SD D N A SA Salary Is Appropriate To The Work Series1
- 105. 105 Interpretation: - From the above analysis it concludes that the employees are satisfied with the salary they are getting and the amount of work they are doing in the organization. The present salary is appropriate to the work they do. Table 41 The pay raises at my organization are satisfactory Particular No. of Respondents %age SD 4 4% D 6 6% N 12 12% A 19 19% SA 59 59% Chart 41 4% 6% 12% 19% 59% SD D N A SA Pay Raises At Organization Are Satisfactory Series1
- 106. 106 Analysis:- From the above chart it shows 59% of employees are strongly agree with the pay rise in organization are satisfactory, 19% employees are agree, 12% employees are neutral, 6% disagree and 4% are strongly disagree respectively. Interpretation: - From the above analysis it concludes that the mostly employees are satisfy with the pay rise in their salary, while some of the employees are not satisfied with the pay rise. Table 42 The salary package at meets my needs Particular No. of Respondents %age SD 3 3% D 8 8% N 15 15% A 13 13% SA 61 61% Chart 42
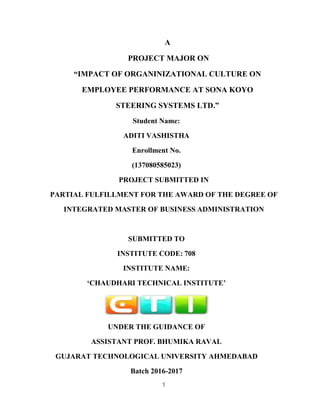
- 107. 107 Analysis: - The above chart shows 61% of employees are strongly agrees that the salary package of the employee meets their needs, 13% agree, 15% neutral, 8% disagree and 3% strongly disagree respectively. Interpretation: - From the above analysis it concludes that the mostly employees agrees that the needs of them is fulfilled by their salary package. Some of them are not satisfied with their salary package, they are saying that the payment is not fulfilling their daily needs. Table 43 Benefit plans such as – Benefit Plans SD D N A SA Retirement Plans 6% 12% 15% 13% 54% Life Insurance 2% 6% 17% 18% 57% 3% 8% 15% 13% 61% SD D N A SA Salary Package Meets Their Needs Series1
- 108. 108 Medical Insurance 4% 8% 12% 11% 65% DA 8% 9% 18% 12% 53% HRA 6% 10% 19% 14% 51% PF, ESI 2% 8% 15% 17% 58% Leave Salary 5% 6% 17% 12% 60% Chart 43 Analysis: - The above chart shows the employees are maximum satisfied with the medical insurance of the company with 65% of employees are strongly agreeing, while employees are least satisfied with 51% of strongly agreeing in HRA facility provided to the employees. 6% 2% 4% 8% 6% 2% 5% 12% 6% 8% 9% 10% 8% 6% 15% 17% 12% 18% 19% 15% 17% 13% 18% 11% 12% 14% 17% 12% 54% 57% 65% 53% 51% 58% 60% Retirement Plans Life Insurance Medical Insurance DA HRA PF, ESI Leave Salary Chart Title SA A N D SD
- 109. 109 Interpretation: - From the above analysis it concludes that the company’s benefit plans are not satisfactory to the employees, only medical insurance policy is satisfying employees. Table 44 I think my performance is evaluated fairly Particular No. of Respondents %age SD 2 2% D 2 2% N 6 6% A 22 22% SA 68 68% Chart 44 Analysis: - The above chart shows 68% of employees are strongly agrees that their performance is evaluated fairly, while 6% are neutral, 22% are agree, and 2% of employees are strongly disagree and disagree. 2% 2% 6% 22% 68% SD D N A SA Performance Is Evaluated Fairly Series1
- 110. 110 Interpretation: - From the above analysis it concludes that the mostly employees says that their performance is evaluated fairly. They are satisfied with the evaluation process of the company. Table 45 Employee recognition programs are regularly followed Particular No. of Respondents %age SD 0 0% D 3 3% N 5 5% A 25 25% SA 67 67% Chart 45 Analysis: - The above chart shows 67% of employees are strongly agrees with the programs regularly followed for the employee recognition by the organization, 25% 0% 3% 5% 25% 67% SD D N A SA Employee Recognition Programs Regularly Followed Series1
- 111. 111 are agree, 5% are neutral, 3% are disagree and none of the employees are strongly disagree. Interpretation: - From the above analysis it concludes that the employees are agreeing with the organization is having a regular programs for the employee recognition. Table 46 If I feel underpaid, I can discuss my feelings with my supervisor/manager Particular No. of Respondents %age SD 2 2% D 2 2% N 9 9% A 31 31% SA 56 56% Chart 46
- 112. 112 Analysis:- As per the above chart employees who are strongly agreed that they can discuss their feelings with their supervisor/manager if feel they are underpaid are 56%, 31% are agree, 9% neutral and 2% employees are strongly disagree and disagree respectively. Interpretation: - From the above analysis it concludes that some of the employees are not so comfortable with their supervisor/manager to ask if they feel are underpaid, whereas majority of the employees are feeling comfortable with their supervisor/manager to ask anything regarding their salary. Table 47 My organization will promote from within before looking for employees externally Particular No. of Respondents %age 2% 2% 9% 31% 56% SD D N A SA If Feel Underpaid, Can Discuss Feelings With Their Supervisor/Manager %age
- 113. 113 SD 2 2% D 4 4% N 6 6% A 37 37% SA 51 51% Chart 47 Analysis:- The above chart shows 51% employees are strongly agrees that the organization is promoting employees from within before looking for employees externally, 37% are agree, 6% neutral, 4% are disagree and 2% employees are strongly disagree respectively. Interpretation: - From the above analysis it concludes that the organization is promoting employees from within the organization before looking for employees externally 2% 4% 6% 37% 51% SD D N A SA Organization Promote From Within Before Looking Employees Externally %age
- 114. 114 Table 48 My job at current position is permanent and secure Particular No. of Respondents %age SD 8 8% D 9 9% N 11 11% A 20 20% SA 52 52% Chart 48 Analysis: - Above chart shows 52% of employees are strongly agrees that their current job is secure and permanent, 20% employees are agree with this, 8% are strongly disagree, 9% are disagree and 11% of employees are neutral respectively. SD 8% D 9% N 11% A 20% SA 52% Job Is Permanent And Secure
- 115. 115 Interpretation: - From the above analysis it concludes that the organization prefers hiring of employees from the references of its existing employees rather than external hiring. Table 49 There is regular supervision from my supervisor regarding my work Particular No. of Respondents %age SD 0 0% D 0 0% N 14 14% A 22 22% SA 64 64% Chart 49 Analysis: - The above chart shows 64% employees are strongly agree that their supervisor is doing regular supervision regarding their work, while 22% are agree, 14% are neutral and none of the employee is strongly disagree and disagree. 0% 0% 14% 22% 64% SD D N A SA Regular Supervision From My Supervisor Regarding My Work %age
- 116. 116 Interpretation: - From the above analysis it concludes that the supervisor is supervising the work of their employees working under them. It is done because of reduction of errors that is occurred by employees. Table 50 There is competition among the team members regarding credit and promotion Particular No. of Respondents %age SD 4 4% D 3 3% N 10 10% A 28 28% SA 58 58% Chart 50 4% 3% 10% 28% 58% SD D N A SA Competition Regarding Credit And Promotion Series1
- 117. 117 Analysis:- According to the above chart 58% of employees are strongly with the competition among employees regarding credit and promotion, while 10% are neutral, 3% are disagree, 4% are strongly disagree and 28% are agree respectively. Interpretation: - From the above analysis it concludes that the organization is having competition regarding credit and promotion. Table 51 Healthy eating facilities Healthy Eating Facilities SD D N A SA Employee canteen 0% 2% 5% 24% 69% Breakfast 0% 4% 8% 37% 51% Lunch 0% 2% 5% 24% 69% Dinner 5% 3% 6% 22% 64% Snack/tea/drinks 0% 3% 7% 21% 68% Drinking water 0% 0% 9% 32% 59% Sufficient seating for all employees at canteen 0% 0% 0% 42% 58% Chart 51
- 118. 118 Analysis:- The above chart shows that employees are mostly satisfied with the canteen and lunch facility provided at the company 69% of employees are strongly agreed with the facilities, while 21% of employees are agree and 51% of employees are strongly agreed with the breakfast facility provided at the company. None of the employees are complaining about the seating facility at the canteen. Interpretation: - Canteen is satisfactory as per the expectations of the employees. Table 52 There is great opportunity to learn from my work at 0% 0% 0% 5% 0% 0% 0% 2% 4% 2% 3% 3% 0% 0% 5% 8% 5% 6% 7% 9% 0% 24% 37% 24% 22% 21% 32% 42% 69% 51% 69% 64% 68% 59% 58% Employee canteen Breakfast Lunch Dinner Snack/tea/drinks Drinking water Sufficient seating for all employees at canteen Healthy Eating Facilities SA A N D SD
- 119. 119 Analysis: - The above chart shows 58% are strongly agree with there is great opportunity to learn from their work at organization, 8% are neutral, 34% are agree and none of the employees are strongly disagree and disagree. Interpretation: - From the above analysis it concludes that the mostly employees are agree with the opportunity to learn from their work. Table 53 There is an opportunity of Career growth at 0% 0% 8% 34% 58% SD D N A SA Opportunity To Learn From Work Series1 Particular No. of Respondents %age SD 0 0% D 0 0% N 8 8% A 34 34% SA 58 58%
- 120. 120 Particular No. of Respondents %age SD 2 2% D 3 3% N 5 5% A 31 31% SA 59 59% Analysis: - The above chart shows employees who strongly agrees with the opportunity of their career growth are 59%, 3% are disagree, 2% strongly agree, 5% are neutral and 31% of employees are agree. Interpretation: - From the above analysis it concludes that the company is giving the opportunity of the career growth to their employees. Table 54 My job gives me professional growth and advancement in future 2% 3% 5% 31% 59% SD D N A SA Opportunity Of Career Growth Series1
- 121. 121 Particular No. of Respondents %age SD 2 2% D 3 3% N 9 9% A 28 28% SA 58 58% Analysis:- As per the chart, 56% of employees are strongly agree with the professional growth & advancement in future in their job, 28% of employees are agree, 9% neutral, 3% disagree and 2% are strongly disagree. Interpretation: - From the above analysis it concludes that the employees are having the professional growth and advancement in future in their current job. Table 55 As a whole, you are satisfied with the work culture 2% 3% 9% 28% 58% SD D N A SA Job Gives Professional Growth & Advancement In Future Series1
- 122. 122 Particular No. of Respondents %age SD 3 3% D 3 3% N 6 6% A 27 27% SA 61 61% Analysis: - From the above chart 61% employees are fully satisfied with the work culture of the organization, 6% are neutral, 3% are strongly disagree and disagree and only 27% of employees are agree. Interpretation: - From the above analysis it concludes that the majority of the employees are satisfied with the work culture. 3% 3% 6% 27% 61% SD D N A SA Fully Satisfied With The Work Culture Series1
- 123. 123 FINDINGS 1. 98% of employees are male working in the organization. 2. The manager is willing to share the decision making and employees have the input in organizational decisions. 3. Organization communicates with its employees in a timely manner and the manager/supervisors are giving regular feedback. 4. Employees have a good opinion about their ‘role in making important decisions’ in the organization 5. The organization is having good team cooperation with each other to get the job done, whereas the encouragement is provided to the employees for the team work. 6. In this organization team meetings are regularly conducted for the planning and for the celebration of the team success. 7. Employees are happy to work in team because of friendly and supportive staff in their department. 8. Employees having the clear understanding of the organization’s goals and objectives, & their job/responsibility are clearly described. 9. The overall infrastructure provided by the organization is highly satisfying.
- 124. 124 10.Recourses are adequate to get the job done and they have the freedom to arrange their workplace according to their comfort. 11. The shift timings are flexible, while working in the organization the concern is shown for their health and safety. 12.Employees have a good opinion about other benefits such as pay raise, performance evaluation, career growth and learning opportunities provided by the organization 13.The salary of the employees is satisfactory as per the work they do in the organization. 14. The employee recognition programs are done regularly, such that they can feel comfortable with their supervisor/manager and can discuss any problem with them. 15. The supervisor is doing supervision of employees on a regular basis and majority of employees feel that their performance is evaluated fairly. 16.The organization is having a great opportunity of career growth and to learn from the work employees are doing. 17.As a whole majority of employees are satisfied with the work culture being followed by the management of the Sona Koyo Steering Systems Limited.
- 125. 125 CONCLUSION From the above analysis it can be concluded that the organization is having good relation with their employees but some of them feel they are not getting importance from their manager/supervisor. Some of the employees are not fully involved in the activities of the organization. The monthly activity that is done for the encouragement of employees is not so effective; suggestions are to be mandatory for each employee to improve the monthly activity. Each employee has different ideas to improve the monthly activity done for the encouragement of employees. Some of the employees do not feel free to ask/discuss their problems with the supervisors/managers. Each employee of the organization should feel free to have a word with their supervisor/managers.
- 126. 126 Bibliography http://shodhganga.inflibnet.ac.in/bitstream/10603/41763/9/09_chapter%204%20objectives.pdf http://shodhganga.inflibnet.ac.in/handle/10603/14776 http://irmbrjournal.com/papers/1364462611.pdf http://www.ccsenet.org/journal/index.php/ijbm/article/viewFile/19826/14964 https://globaljournals.org/GJMBR_Volume14/1-Organizational-Culture-and-Employees- Performance.pdf https://www.google.co.in/url?sa=t&rct=j&q=&esrc=s&source=web&cd=17&cad=rja&uact=8&ved=0a hUKEwin9qb- uqjPAhUIPo8KHXbGCfI4ChAWCE4wBg&url=http%3A%2F%2Fijmr.net.in%2Fdownload.php%3Ffilena me%3DgGi2afBw5jeLjGS.pdf%26new%3DIJCISS5Jan4057.pdf&usg=AFQjCNEGklOdhky1mZZxsCdAn69 TeZrawg&bvm=bv.133700528,d.c2I http://ir.knust.edu.gh/bitstream/123456789/4818/1/Dwirantwi,%20Eric%20Addo.pdf http://www.theijes.com/papers/v4-i5/Version-2/G0452033041.pdf INDEX. (n.d.). Retrieved September 24, 2016, from http://www.sonagroup.com/index.php?option=com_content&view=article&id=132&Itemid=380 Image. (n.d.). Retrieved August 24, 2016, from http://www.sonagroup.com/images/Sonagroup-products.jpg
- 127. 127 Appendices Questionnaire I am the student of “Chaudhari Technical Institute (IMBA), Gandhinagar. Presently I am preparing report on “Impact of organizational culture on employee performance of SONA KOYA STEERING SYSTEMS LIMITED.” I’ll be thankful if you give your valuable you give valuable time for filling up this questionnaire. All the information will be kept confidential and will only be used for academic purpose only. Instructions: Each statement is followed by a choice of responses. Please check the response that corresponds to how you feel about each statement. Please ( ■ )or Tick in the boxes provided. All information provided is strictly confidential. Now on to the survey! Please Fill in the Following Details Department: Date of filling the Questionnaire: I. What is your Designation? _________________________________________________________ II. Length of service with the current organization a. Less than 6 months □ b. 6 -12 months □ c. 1-2 year’s □ d. More than 2 years □ III. Age
- 128. 128 a. Less than 25 years □ b. 25 – 40 years □ c. More than 40 years □ IV. Gender a. Male □ b. Female □ V. Educational Qualification a. Secondary school □ b. Degree/ Diploma □ c. Post-Graduation □ All the five options provided for the next questions below will count as (1) Strongly Disagree (2) Disagree (3) Neutral (4) Agree (5) Strongly Agree A. ORGANIZATIONAL DECISIONS/COMMUNICATION (MANAGER)/ EMPLOYEE’S INVOLVEMENT (1) (2) (3) (4) (5) EMPLOYEE INVOLVEMENT 1. My Manager is willing to share Decision-making □ □ □ □ □ power with employees
- 129. 129 2. I have input into Organizational decisions □ □ □ □ □ 3. I have freedom to make important decisions □ □ □ □ □ regarding my work COMMUNICATION WITHIN ORGANIZATION 4. My Organization communicates in a timely manner □ □ □ □ □ to its employees 5. My Organization shares information with others who □ □ □ □ □ should know it 6. Is there a Two-way communication between employer □ □ □ □ □ and employee WORK SUPERVISION 7. My manager/supervisor gives me regular feedback □ □ □ □ □ 8. I feel free to ask advice/support from my manager □ □ □ □ □ 9. I feel that my organization values my opinions □ □ □ □ □
- 130. 130 10. Everyone’s contribution is noted and respected □ □ □ □ □ by the organization 11. Management uses the employee feedback for □ □ □ □ □ continues growth & development 12. My personal job performance is important to □ □ □ □ □ the success of my organization. B. TEAMWORK/ COLLEAGUES/ PEER COMMUNICATION (1) (2) (3) (4) (5) Extent of Team Work 13. There is good team work in my organization. □ □ □ □ □ 14. Employees in my team cooperate with each other □ □ □ □ □ to get the job done 15. Sufficient encouragement is provided by the □ □ □ □ □ teammates at work 16. Everyone is encouraged to participate in □ □ □ □ □ groups/teams
- 131. 131 (1) (2) (3) (4) (5) Team Preference 17. Team meetings are conducted regularly □ □ □ □ □ 18. Team success is celebrated as a group achievement □ □ □ □ □ 19. I am recognized & respected [in my team/ □ □ □ □ □ by my teammates] 20. I am happy to be working in team than alone. □ □ □ □ □ WROK ENVIRONMENT IN TEAM 21. All the staff in my department is friendly and □ □ □ □ □ supportive 22. All the information is shared equally in my □ □ □ □ □ department 23. Individual differences are respected[Age, gender, □ □ □ □ □ education, caste,..] C. JOB FACTORS/ CONTROL/ DEMANDS/ ROLE CLARITY (1) (2) (3) (4) (5)
- 132. 132 JOB ENRICHMENT 24. I have clear understanding of the goals and □ □ □ □ □ objectives of my organization 25. I have no doubt that what I do on my job is really □ □ □ □ □ important 26. I am encouraged to develop new & more efficient □ □ □ □ □ ways to do my work 27. The amount of work I am expected to do is reasonable □ □ □ □ □ 28. The level of work responsibility given to me is □ □ □ □ □ appropriate 29. There is possibility to perform multi-tasks in □ □ □ □ □ my department 30. My job is more challenging and exciting □ □ □ □ □ ROLE CLARITY 31. I know what is expected of me during my □ □ □ □ □ job/work done
- 133. 133 32. I understand day-to-day objectives of my □ □ □ □ □ department 33. My Job/responsibility is clearly described. □ □ □ □ □ D. PHYSICAL WORK CONDITIONS/ INFRASTRUCTURE/ RESOURCES (1) (2) (3) (4) (5) 34. The overall infrastructure provided by the organization is satisfying v Ventilation □ □ □ □ □ v Hygiene □ □ □ □ □ v Work-space □ □ □ □ □ v Lighting and fans □ □ □ □ □ v Protection against heat/cold □ □ □ □ □ v Cleanliness and neatness □ □ □ □ □ v Power-supply □ □ □ □ □ v Drinking water □ □ □ □ □ v Safety at work □ □ □ □ □ 35. Adequate resources are provided to get the □ □ □ □ □ job done
- 134. 134 36. I can arrange my workplace as per my comfort □ □ □ □ □ 37. My shift timings are flexible □ □ □ □ □ 38. My activity at work involves a. Sitting Light work b. Sitting Moderate/ Heavy work b. Standing Light work d. Standing Moderate/ Heavy work 39. Concern is shown for my health and safety at □ □ □ □ □ work place E. COMPENSATION/ SALARY/ BENEFITS/ RECOGNITION (1) (2) (3) (4) (5) 40. My present salary is appropriate to the work □ □ □ □ □ I do 41. The pay raises at my organization are satisfactory □ □ □ □ □ 42. The salary package at meets my needs □ □ □ □ □ 43. Benefit plans v Retirement Plans □ □ □ □ □ v Life Insurance □ □ □ □ □
- 135. 135 v Medical Insurance □ □ □ □ □ v DA □ □ □ □ □ v HRA □ □ □ □ □ v PF, ESI □ □ □ □ □ v Leave Salary □ □ □ □ □ (1) (2) (3) (4) (5) 44. I think my performance is evaluated fairly □ □ □ □ □ 45. Employee recognition programs are regularly □ □ □ □ □ followed 46. If I feel underpaid, I can discuss my feelings □ □ □ □ □ with my supervisor/manager 47. My organization will promote from within before □ □ □ □ □ looking for employees externally 48. My job at current position is permanent and secure □ □ □ □ □ 49. There is regular supervision from my supervisor □ □ □ □ □ regarding my work 50. There is competition among the team members □ □ □ □ □
- 136. 136 regarding credit and promotion 51. Healthy eating facilities v Employee canteen □ □ □ □ □ v Breakfast □ □ □ □ □ v Lunch □ □ □ □ □ v Dinner □ □ □ □ □ v Snack/tea/drinks □ □ □ □ □ v Drinking water □ □ □ □ □ v Sufficient seating for all employees at canteen □ □ □ □ □ v Following aspects are followed accurately o Cleanliness □ □ □ □ □ o Layout [design of seating and food provisions] □ □ □ □ □ o Lighting and fans □ □ □ □ □ o Ventilation □ □ □ □ □ o Maintenance/ Service □ □ □ □ □ 52. There is great opportunity to learn from my □ □ □ □ □ work at 53. There is an opportunity of Career growth at the □ □ □ □ □ organization
- 137. 137 54. My job gives me professional growth and □ □ □ □ □ advancement in future 55. As a whole, you are satisfied with the work culture □ □ □ □ □ being followed by the management at the organization