SlideShare a Scribd company logo
1 of 57
1. Composition and particle sizes of soils
I. Origin and formation of Soils
II. Composition of soils
III. Determination of particle size
IV. Characterization of soils based on particle size
V. Phase relationships
VI. Determination of the Liquid, plastic, and shrinkage Limits
VII.Classifications and field identification of soils
Origin And Formation Of Soils
• DEFINITION OF SOIL
• Soil is a natural body comprised of solids (minerals and organic matter),
liquid, and gases that occurs on the land surface, occupies space,
• characterized by one or both of the following: horizons, or layers, that are
distinguishable from the initial material as a result of additions, losses,
transfers, and transformations of energy and matter or the ability to support
rooted plants in a natural environment.
• The formation of soil happens over a very long period of time. It can take
1000 years or more.
• Soil is formed from the weathering of rocks and minerals. The surface rocks
break down into smaller pieces through a process of weathering and is then
mixed with moss and organic matter.
Cont.
• Geotechnical engineering is the branch of civil engineering concerned with the
engineering behavior of earth materials.
• includes investigating existing subsurface conditions and materials; assessing risks posed
by site conditions; designing earthworks and structure foundations; and monitoring
site conditions, earthwork and foundation construction.
• A typical geotechnical engineering project begins with a site investigation of soil, rock,
fault distribution and bedrock properties on and below an area of interest to determine their
engineering properties including how they will interact with, on or in a proposed
construction. Site investigations are needed to gain an understanding of the area in or on
which the engineering will take place. Investigations can include the assessment of the risk
to humans, property and the environment from natural hazards such as earthquakes,
landslides, sinkholes, soil liquefaction, debris flows and rock falls.
• According to Terzaghi (1948): “Soil mechanics is the application of the laws of mechanics
and hydraulics to engineering problems dealing with sediments and other unconsolidated
accumulations of solid particles produced by the mechanical and chemical disintegration of
rocks regardless of whether or not they contain an admixture of organic constituents”.
Cont.
• SOIL FORMATION : Weathering is the process of the breaking down rocks. There are two
different types of weathering. Physical weathering and chemical weathering.
• In physical weathering it breaks down the rocks, but what it's made of stays the same.
• Among the physical weathering Temperature Changes, Freezing action of water, Spreading of
roots of plants, and Abrasion.
• In chemical weathering it still breaks down the rocks, but it may change what it's made of. For
instance, a hard material may change to a soft material after chemical weathering.
• Oxidation: Oxidation occurs frequently in rocks containing iron, which decomposes in a
manner similar to the rusting of steel when in contact with moist-air.
• Carbonation: The mineral containing iron, calcium, magnesium, sodium or potassium can be
decomposed by carbonic acid, which is formed by carbon dioxide with water.
• Hydration: Hydration is a common process of rock decay by which water is combined with
some other soil substances thus producing certain new minerals.
• Leaching: Leaching is the process whereby water-soluble parts are dissolved and washed out
from the soil by rainfall, percolating water, subsurface flow or other water.
Cont.
SOIL PROFILE :
Soil Types
Soil Types
• Residual Soil
• Sediment Soil
• Alluvium Soil
• Lacustrine Soil
• Aeolian soils
• Marine Soil
• Particular Soil
• Sand, Gravel, Cobbles
And Boulders
• Silt
• Clay
• Expansive Soil
• Organic Soil
• Collapsible Soil
• Quick Clay
• Alluvial soils are those soils that have been transported by
running water and deposited along a stream.
• Aeolian soils are those soils that have been transported and
deposited by wind.
• Lacustrine soils are those soils that have been deposited from
suspension in quite fresh water lakes.
• Colluvial soils are those soils that have been deposited by
movement of soil by gravity such as landslides.
• Marine soils are those soils that have been deposited from
suspension in seawater.
• Glacial soils are those soils that have been deposited as a result
of glacial activities
• Particle Bonding
The particle bonding is very weak so relatively easy to going to
change and have non-linear behavior and characteristic
• Cohesive Soil
• Non-cohesive Soil (Cohesionless)
Physical Properties Of Soil
• Basic Definition And Phase Relations
Air
Water
Soil
Mass
• Soil mass is generally a three phase system
• The inter-relationships of the weights and
volumes of the different phases are
important since they help to define the
condition or the physical make-up of a soil.
• Thus the total volume V of a given soil
sample can be expressed as
V = Vs + Vv = Vs + Vw +Va
Cont.
• VOID RATIO; e : The ratio of void volume (Vv) to soil volume (Vs)
(given in decimal, 0.65)
0 < e < 
• POROSITY ; n : The ratio of void volume (Vv) to total volume (V)
(given in percent 100%, 65%)
0  n  1
Relationship between void ratio and porosity
or
n
n
e


1 e
e
n


1
s
v
V
V
e 
V
V
n v

• DEGREE OF SATURATION S (given in percent 100%, 65%)
%
100
)
(
)
(


v
w
V
voids
of
volume
Total
V
water
contains
voids
of
volume
Total
S
• WATER CONTENT;  : The ratio of the
amount of water (Ww) in the soil (Ws)
and expressed as a percentage
0% <  < 
%
100
x
W
W
s
w


Completely dry soil S = 0 %
Completely saturated soil S = 100%
Unsaturated soil (partially saturated soil)
0% < S < 100%
Weight Relationships
• Water Content w (100%)
• For some organic soils
w>100%, up to 500 %
• For quick clays, w>100%
• Density of water (slightly varied
with temperatures)
• Density of soil
a. Dry density
b. Total, Wet, or Moist density
(0%<S<100%, Unsaturated)
c. Saturated density (S=100%, Va =0)
d. Submerged density (Buoyant density)
%
100
)
(
)
(


s
w
M
solids
soil
of
Mass
M
water
of
Mass
w
)
V
(
sample
soil
of
volume
Total
)
M
(
solids
soil
of
Mass
t
s
d 

)
V
(
sample
soil
of
volume
Total
)
M
M
(
sample
soil
of
Mass
t
w
s 


)
V
(
sample
soil
of
volume
Total
)
M
M
(
water
solids
soil
of
Mass
t
w
s
sat




w
sat
'





3
3
3
w m
/
Mg
1
m
/
kg
1000
cm
/
g
1 



Cont.
Submerged unit weight:
Consider the buoyant force
acting on the soil solids:
w
sat
' 




w
sat
t
w
t
w
s
t
w
w
t
s
t
w
w
t
s
t
w
s
s
V
V
W
W
V
W
V
W
%)
100
S
(
V
)
V
V
(
W
V
V
W























• Mass is a measure of a body's
inertia, or its "quantity of matter".
Mass is not changed at different
places.
• Weight is force, the force of
gravity acting on a body. The
value is different at various places
(Newton's second law F = ma)
(Giancoli, 1998)
• The unit weight is frequently used
than the density is (e.g. in
calculating the overburden
pressure).
w
s
w
s
w
s
s
3
2
g
g
G
m
kN
8
.
9
,
Water
sec
m
8
.
9
g
gravity
to
due
on
accelerati
:
g
Volume
g
Mass
Volume
Weight
,
weight
Unit
Volume
Mass
,
Density


























• UNIT WEIGHT : The ratio of weight to volume
w
w
w
V
W


s
s
s
V
W


V
W


– RELATIONSHIP OF SOIL PARAMETERS
)
1
( 




d
V
Ws
d 

V
W


W
Ws
d


.
 w
s W
W
W 

s
w
s
s
d
W
W
W
W




)
1
( 




d
(1) Specific gravity
(2)
•Proof:
w
s
w
s
s
G






s
s
w
G
w
e
S
w
e
S









s
w
w
w
s
s
s
w
w
s
s
w
s
s
w
s
v
v
w
s
V
V
V
M
V
M
M
M
M
M
G
w
V
V
V
V
V
V
e
S
G
w
e
S















a means of expressing the
heaviness of material.
Determination of particle size
• In this system soils are split into coarse-grained non-cohesive, fine-
grained cohesive and organic soils. Most systems of soil classification
depend to some extent upon the distribution of various sized particles in
the soil.
• Mechanical analysis can be divided into
1. Sieve analysis
2. Hydrometer analysis
• For coarse-grained material this distribution may be determined by
sieving, and for finer particles a method of measuring the rate of
settlement in water is used.
Sieve Analysis
• The sieve analysis is carried out by sieving a known dry weight of sample
through the set of sieves placed one below the other, so that the openings
decrease in size from the top sieve down, with a pan at the bottom of the
stock.
• By determining the weight of soil sample left on each sieve, the following
calculations can be made.
AASHTO standard sieve
size
Sieve Analysis
• Test Standard
ASTM D422, AASHTO T88
• The testing should be only carried out once for one
sample
• The result will be plotted in the form of graph on semi-
log paper with the percentage finer on the arithmetic
scale and the particle diameter on the log scale
• The shapes of the curves indicate the nature of the soil
tested. On the basis of the shapes one can classify soils
as
1. Uniformly graded or poorly graded
2. Well graded
3. Gap graded
Curve of Particle Size Distribution
• Uniformly graded soils
are represented by
nearly vertical lines as
shown by curve ΙΙ
• A well-graded soil,
represented by curve Ι,
possesses a wide range
of particles sizes
ranging from gravel to
clay size particles.
• A gap-graded soil, as
shown by curve ΙΙΙ
has some of the sizes
of particles missing.
10
60
D
D
CU 
60
10
2
30
.D
D
D
CC 
Hydrometer Analysis
• Soil particle sizes smaller than 0.075 mm (passing 200 mesh sieve) are
determined by the so-called hydrometer method and it is based on the
process of sedimentation of soil particles in water by gravity.
• Used to extend the distribution curve of particle shape and to predict
the particle size less than 200 sieve
• Principle of work : sedimentation of soil particle in water
• Stoke rule is valid :
• or
 





18
D
v
2
w
s
Determination of the Liquid, plastic, and shrinkage Limits
• The Swedish Scientist, Atterberg (1911), developed a method of
describing quantitatively the effect of varying water content on the
consistency of fine-grained soils.
• He established the four states of soil consistency, which are called the
liquid, the plastic, the semi-solid, and the solid states.
• proposed a series of tests for determining the boundaries known as
Atterberg limits between the physical states of soil.
• Each boundary or limit is defined by the water content that produces a
specified consistency.
SL PL LL
Water content
Volume
Solid Plastic Liquid
Plasticity Index
PI
Semi Solid
Determination of Atterberg limits
• CASAGRANDE METHOD (LL)
CASAGRANDE METHOD
CASAGRANDE METHOD
SINGLE-POINT
PLASTIC LIMIT (PL)
Plastic behaviour
The test is done by rolling up the
soil sample to 3.2mm
diameter
Defined as the water content, in
percent, at which the soil
crumbles, when rolled into
threads of 1/8 in (3.2mm) in
diameter.
• Test Standard : ASTM D 427
• After drying the soil sample in
an oven, and determining the
mass and volume of sample
before(i) and after (f) drying:
SHRINKAGE LIMIT (SL)
[ ( ) ] 100
mi mf vi vf
SL w
mf mf

 
  
• Plasticity Index (PI):- Is the range of water
content over which the soil exhibits
plasticity.
• A cohesion less soil has zero plasticity index.
• Such soil as termed as non-plastic
• clays are highly plastic and posses a high
plasticity index.
Assignment one - A
• Write the test procedures and prepare laboratory report formats for the
Atterberg limit tests.
Classifications and field identification of soils
• PURPOSE: To classified the soil into a group according to the soil behavior and
physical shape
• TYPE OF CLASSIFICATION:
• CLASSIFICATION BY VISUAL
• AASHTO (
• UCS
• CLASSIFICATION BY VISUAL
Carried out by direct observation (visual examination) to the sample and
approximate the type of soil by:
– Colour
– Smell
– Sense/Feeling
– endurance
– Swelling
– Sedimentation
AASHTO (American Association of State Highway and Transport Official)
• The soil classified into 7 major categories (A-1 to A-7)
• Based on:
• The result of Sieve Analysis
• Atterberg Limits
Plasticity Index for sub
group A-7-5  LL minus
30. Plasticity Index for
sub group A-7-6 > LL
minus 30
AASHTO
GROUP INDEX
The soil quality based on Group Index Calculation
)
10
)(
15
(
01
.
0
)}
40
(
005
.
0
2
.
0
){
35
( 





 PI
F
LL
F
GI
F = The percentage of soil pass sieve no. 200
Subgrade Group Index Value
Very good Soil Class A-1-a (0)
Good 0 – 1
Medium 2 – 4
Bad 5 – 9
Very Bad 10 - 20
GROUP INDEX
Rules:
• If GI < 0, GI = 0
• GI  Integer Number
• No upper limit of GI
• For coarse grained,
– GI = 0 for A-1-a, A-1-b, A-2-4, A-2-5 and
A-3
– GI =0,01(F-15)(PI-10) for A-2-6 and A-
2-7
Make examination of soil to determine whether it
is granular or silt clay materials
Determine amount passing No. 200 sieve
Granular Materials
35% or less pass No. 200 sieve
Silt-Clay Materials
36% or more pass No. 200 sieve
Less than 25%
pass No. 200 sieve
Run sieve analysis, also LL
and PL on minus No. 40
sieve material
A-1
Less than 50%
pass No. 40 sieve
Less than 15%
pass No. 200 sieve
Less than 30%
pass No. 40 sieve
Less than 50%
pass No. 10 sieve
PI less than 6
Less than 25%
pass No. 200 sieve
Less than 50%
pass No. 40 sieve
PI less than 6
A-1-a A-1-b
Greater than 50%
pass No. 40 sieve
A-2
Less than 35%
pass No. 200 sieve
Less than 10%
pass No. 200 sieve
Nonplastic
A-3
Run LL and PL on minus No.
40 sieve material
Silty
PI less than 10
Clayey
PI greater than 11
LL less
than 40
LL greater
than 41
A-2-4 A-2-5
LL less
than 40
LL greater
than 41
A-2-6 A-2-7
Run LL and PL on minus No.
40 sieve material
Silt
PI less than 10
Clay
PI greater than 11
LL less
than 40
LL greater
than 41
LL less
than 40
A-7
LL greater
than 41
A-4 A-5 A-6
PI equal to or less
than LL minus 30
or
PL equal to or
greater than 30
PI greater than LL
minus 30
or
PL less than 30
A-7-5 A-7-6
USCS
(UNIFIED SOIL CLASSIFICATION SYSTEM)
• originally proposed by A. Casagrande in 1942
• Soil classification determined base on the soil parameter
i.e.:
– Diameter of soil particle
• Gravel : pass sieve no.3 but retained at sieve no. 4
• Sand : pass sieve no. 4 but retained at sieve no.
200
• Silt and Clay : pass sieve no. 200
– Coefficient of soil uniform
– Atterberg Limits
• Notation
– G= Gravel
– M = Inorganic Silt
– C = inorganic Clay
– O = Organic Silt or Clay
– W = Well Graded
– P = Poorly Graded
– L = Low Plasticity
– H = High Plasticity
Soil Type Prefix Sub-group
Suffix
Well Graded
W
Gravel G Poor Graded
P
Sand S Silty M
Clayey C
Silt M
Clay C LL < 50% L
Organic O LL > 50% H
Peat Pt
Make visual examination of soil to determine
whether it is HIGHLY ORGANIC, COARSE
GRAINED, or FINE GRAINED, ini borderline
cases determine amount passing No. 200 sieve
HIGHLY ORGANIC SOIL (Pt)
Fibrous texture, color, odor, very high
moisture content, particle of vegetable
matter (sticks, leaves, etc.)
COARSED GRAINED
50% or less pass No.200 sieve
FINE GRAINED
More than 50% pass No.200 sieve
THE FLOW CHART OF USCS METHOD
COARSED GRAINED
50% or less pass No.200 sieve
Run sieve analysis
GRAVEL (G)
Greater percentage of coarse
fraction retained on No. 4 sieve
SAND (S)
Greater percentage of coarse
fraction pass on No. 4 sieve
Less than 5%
pass No. 200
sieve *
Between 5% and 12%
pass No. 200 sieve
more than 12%
pass No. 200
sieve
Examine grain size
curve
Borderline. to have double
symbol appropriate to grading
and plasticity characteristic,
e.g. GW-GM
Run LL and PL on
minus No. 40
sieve fraction
Well
Graded
Poorly
Graded
GW GP
Below A line and
hatched zone on
plasticity chart
Limits plot in
hatched zone on
plasticity chart
Above A line and
hatched zone on
plasticity chart
GM GM-GC GC
Less than 5%
pass No. 200
sieve *
Between 5% and 12%
pass No. 200 sieve
more than 12%
pass No. 200
sieve
Examine grain size
curve
Borderline. to have double
symbol appropriate to grading
and plasticity characteristic,
e.g. GW-GM
Run LL and PL on
minus No. 40
sieve fraction
Well
Graded
Poorly
Graded
Below A line and
hatched zone on
plasticity chart
Limits plot in
hatched zone on
plasticity chart
Above A line and
hatched zone on
plasticity chart
SW SP SM SM-SC SC
FLOWCHART OF USCS
METHOD (CONTINUED)
FINE GRAINED
More than 50% pass
No.200 sieve
Run LL and PL on minus No.40
sieve material
L
Liquid Limit
less than 50
H
Liquid Limit
more than 50
Below A line and hatched
zone on plasticity chart
Limits plot in hatched
zone on plasticity
chart
Above A line and hatched
zone on plasticity chart
Color, odor, possibly LL
and PL on oven dry soil
Organic Inorganic
Below A line on
plasticity chart
Above A line on
plasticity chart
Color, odor, possibly LL
and PL on oven dry soil
Inorganic Organic
OL ML ML-CL CL MH OH CH
Plasticity Chart
• The plasticity chart is a plot of
plasticity index versus liquid limit.
Fine-grained soils are subdivided into
soils of low, medium and high
plasticity following the criteria cut-
lined below
• The diagonal line drawn in the
plasticity chart is called the “A” line
and is given by the equation PΙ = 0.73
(ωℓ - 20). Clays fall above the A-line
and silts below it.
Grain Size Classification
• It is based on grain size of the soils and is essentially useful for classifying
soils in which single grain properties are of importance.
• A mechanical analysis is all that is required to classify a given sample of soil.
Three of the grain size classifications that are in common use are the
following.
40
SOIL COMPACTION
41
INTRODUCTION
Soil compaction is defined as the method of
mechanically increasing the density of soil. In
construction, this is a significant part of the building
process. If performed improperly, settlement of the soil
could occur and result in unnecessary maintenance costs
or structure failure
42
SOIL COMPACTION
PURPOSE
 Improving the soil quality
by:
– Increasing the shear
strength of soil
– Improving the bearing
capacity of soil
 Reduces the settling of
soil
 Reduces the soil
permeability
 To control the relative
volume change
43
TYPES OF COMPACTION
4 types of compaction effort on soil :
 Vibration
 Impact
 Pressure
44
BASIC THEORY
Developed by R.R. Proctor at 1920-an with 4 variables :
 Compaction efforts (Compaction Energy)
 Soil types
 Water content
 Dry Unit Weight
LABORATORY COMPACTION TEST
 Standard Proctor Test
 Modification Proctor Test
 Dietert Compaction
 Harvard Miniatur Compaction
SOIL COMPACTION
45
STANDARD PROCTOR TEST
The soil is compacted at cylindrical tube
Specification of test and equipments
 Hammer weight = 2,5 kg (5,5 lb)
 Falling height = 1 ft (305 mm)
 Amount of layers = 3
 No. of blows/layer = 25
 Compaction effort = 595 kJ/m3
 Soil type = pass sieve no. 4
The test is carried out several time with different
water content
After compacted, the weight, moisture content and
unit weight of samples are measured
Test Standard :
 AASHTO T 99
 ASTM D698
46
MODIFIED PROCTOR TEST
• The soil is compacted at cylindrical tube
• Specification of test and equipments
– Hammer weight = 4.5 kg (10 lb)
– Falling height = 1.5 ft (457 mm)
– Amount of layers = 5
– No. of blows/layer = 25, 56
– Compaction effort = 2693 kJ/m3
– Soil type = pass sieve no. 4
• The test is carried out several time with different
water content
• After compacted, the weight, moisture content and
unit weight of samples are measured
• Test Standard :
– AASHTO T 180
– ASTM D1557
47
TEST RESULT



.
.
.
GS
S
S
GS
w
d


48
FIELD COMPACTION
Type of Compaction Equipment :
 Smooth Wheel Roller :
compaction equipment which supplies
100% coverage under the wheel, with
ground contact pressures up to 400 kPa
and may be used on all soil types except
rocky soils. Mostly use for subgrades
and compacting asphalt pavements.
49
FIELD COMPACTION
Type of Compaction Equipment :
 Rubber Tire Roller :
A heavily loaded wagon with several rows
of three to six closely spaced tires with
tire pressure may be up to about 700 kPa
and has about 80% coverage (80% of the
total area is covered by tires).
This equipment may be used for both
granular and cohesive highway fills.
50
FIELD COMPACTION
Type of Compaction Equipment :
 Sheepsfoot Roller :
This roller has many round or rectangular
shaped protrusions or “feet” attached to a
steel drum.
The area of these protusions ranges from 30
to 80 cm2.
Area coverage is about 8 – 12% with very
high contact pressures ranging from 1400 to
7000 kPa depending on the drum size and
whether the drum is filled with water.
The sheep foot roller is best suited for
cohesive soils.
51
FIELD COMPACTION
Type of Compaction Equipment :
 Grid Roller :
This roller has about 50% coverage and
pressures from 1400 to 6200 kPa,
ideally suited for compacting rocky
soils, gravels and sand. With high
towing speed, the material is vibrated,
crushed, and impacted.
52
FIELD COMPACTION
Type of Compaction Equipment :
 Baby Roller :
Small type of smooth wheel roller
yang, which has pressure ranges
from 10 to 30 kPa. The performance
base on static weight and vibration
effect.
53
FIELD COMPACTION
Type of Compaction Equipment:
 Vibrating Plate :
Compaction equipment, which has
plate shape. This equipment
sometimes called as “stamper”.
Usually used for narrow area and high
risk when use large compaction
equipment like smooth wheel roller
etc.
54
CONDITIONER FACTORS
Characteristic of compaction equipment
 Weight and size
 Operation frequency and frequency range
Soil Characteristic
 Initial density
 Soil type
 Size and shape of soil particle
 Moisture Content
Compaction Procedure
 No. of passes of the roller
 Layer thickness
 Frequency of operation of vibrator
 Towing speed
55
FIELD COMPACTION CONTROL
Excavate a hole with certain diameter and
depth. Determine the mass of excavated
material.
Determine the moisture content
Measure the volume of excavated material
by:
 Ottawa Sand  Sand cone
 The balloon method
 Pouring water or oil
Compute the total density,  and d,field
Compare d, field with d,max and calculate the
relative compaction
56
SPECIFICATION OF COMPACTION
End Product Specification
Method of Specification
 Minimum soil sample 100 kg
 Need special experience to find out the optimum moisture
content in order to get optimum compaction performance
%
100
(max)
)
(
x
RC
d
field
d



57
Assignment one - B
1. Write the test procedures for standard proctor test and modified
proctor test.
2. What is the difference between standard proctor test and modified
proctor test.
Assignment one – C
. solve all the exercise equations on the handout.

More Related Content

Similar to soil mechanics for COTM.pptx

B.sc. agri sem ii agricultural microbiology unit 3 soil profile
B.sc. agri sem ii agricultural microbiology unit 3 soil profileB.sc. agri sem ii agricultural microbiology unit 3 soil profile
B.sc. agri sem ii agricultural microbiology unit 3 soil profileRai University
 
Soil Science Simplified.ppt #soil science #fundamentals of sail
Soil Science Simplified.ppt #soil science #fundamentals of sailSoil Science Simplified.ppt #soil science #fundamentals of sail
Soil Science Simplified.ppt #soil science #fundamentals of sailajaysaini99283371
 
Chapter 4 soil composition &amp; engineering properties
Chapter 4   soil composition &amp; engineering propertiesChapter 4   soil composition &amp; engineering properties
Chapter 4 soil composition &amp; engineering propertiesStan Vitton
 
erosion.pptxsefwakjsdmmxmslkkkmmjjss,ddk
erosion.pptxsefwakjsdmmxmslkkkmmjjss,ddkerosion.pptxsefwakjsdmmxmslkkkmmjjss,ddk
erosion.pptxsefwakjsdmmxmslkkkmmjjss,ddkRegieTBenigno
 
Lecture 2. edaphic factors
Lecture 2. edaphic factorsLecture 2. edaphic factors
Lecture 2. edaphic factorsReysie Ann Faura
 
3.4. soil systempptx Ajay Sharma IB DP/IGCSE ESS/Geo
3.4. soil systempptx Ajay Sharma IB DP/IGCSE ESS/Geo3.4. soil systempptx Ajay Sharma IB DP/IGCSE ESS/Geo
3.4. soil systempptx Ajay Sharma IB DP/IGCSE ESS/GeoDivya Sharma
 
Unit 1 INTRODUCTION AND SOIL PHYSICS.pptx
Unit 1 INTRODUCTION AND SOIL PHYSICS.pptxUnit 1 INTRODUCTION AND SOIL PHYSICS.pptx
Unit 1 INTRODUCTION AND SOIL PHYSICS.pptxsatheeshkumarcivil
 
Soil SP characrerisationc of different type
Soil SP characrerisationc of different typeSoil SP characrerisationc of different type
Soil SP characrerisationc of different typeKanadKumarGhosh1
 
Soil mech. lec. ppt
Soil mech. lec. pptSoil mech. lec. ppt
Soil mech. lec. pptShobbbe
 
Origin and nature of soil
Origin and nature of soilOrigin and nature of soil
Origin and nature of soilNikunj Hindocha
 
Clay Minerology & Plasticity Characteristics of Soil
Clay Minerology & Plasticity Characteristics of SoilClay Minerology & Plasticity Characteristics of Soil
Clay Minerology & Plasticity Characteristics of SoilArbaz Kazi
 

Similar to soil mechanics for COTM.pptx (20)

Soil
SoilSoil
Soil
 
B.sc. agri sem ii agricultural microbiology unit 3 soil profile
B.sc. agri sem ii agricultural microbiology unit 3 soil profileB.sc. agri sem ii agricultural microbiology unit 3 soil profile
B.sc. agri sem ii agricultural microbiology unit 3 soil profile
 
Sed petrolgy[1]
Sed petrolgy[1]Sed petrolgy[1]
Sed petrolgy[1]
 
Soil Science Simplified.ppt #soil science #fundamentals of sail
Soil Science Simplified.ppt #soil science #fundamentals of sailSoil Science Simplified.ppt #soil science #fundamentals of sail
Soil Science Simplified.ppt #soil science #fundamentals of sail
 
UNIT 1.B.M..pptx
UNIT 1.B.M..pptxUNIT 1.B.M..pptx
UNIT 1.B.M..pptx
 
Chapter 4 soil composition &amp; engineering properties
Chapter 4   soil composition &amp; engineering propertiesChapter 4   soil composition &amp; engineering properties
Chapter 4 soil composition &amp; engineering properties
 
Soil water relationship
Soil water relationshipSoil water relationship
Soil water relationship
 
erosion.pptxsefwakjsdmmxmslkkkmmjjss,ddk
erosion.pptxsefwakjsdmmxmslkkkmmjjss,ddkerosion.pptxsefwakjsdmmxmslkkkmmjjss,ddk
erosion.pptxsefwakjsdmmxmslkkkmmjjss,ddk
 
Soil
SoilSoil
Soil
 
Soils_2012.ppt
Soils_2012.pptSoils_2012.ppt
Soils_2012.ppt
 
Lecture 2. edaphic factors
Lecture 2. edaphic factorsLecture 2. edaphic factors
Lecture 2. edaphic factors
 
soil ppt.pdf
soil ppt.pdfsoil ppt.pdf
soil ppt.pdf
 
Soils_2012.ppt
Soils_2012.pptSoils_2012.ppt
Soils_2012.ppt
 
3.4. soil systempptx Ajay Sharma IB DP/IGCSE ESS/Geo
3.4. soil systempptx Ajay Sharma IB DP/IGCSE ESS/Geo3.4. soil systempptx Ajay Sharma IB DP/IGCSE ESS/Geo
3.4. soil systempptx Ajay Sharma IB DP/IGCSE ESS/Geo
 
Unit 1 INTRODUCTION AND SOIL PHYSICS.pptx
Unit 1 INTRODUCTION AND SOIL PHYSICS.pptxUnit 1 INTRODUCTION AND SOIL PHYSICS.pptx
Unit 1 INTRODUCTION AND SOIL PHYSICS.pptx
 
Soil SP characrerisationc of different type
Soil SP characrerisationc of different typeSoil SP characrerisationc of different type
Soil SP characrerisationc of different type
 
Geotech Problems.ppt
Geotech Problems.pptGeotech Problems.ppt
Geotech Problems.ppt
 
Soil mech. lec. ppt
Soil mech. lec. pptSoil mech. lec. ppt
Soil mech. lec. ppt
 
Origin and nature of soil
Origin and nature of soilOrigin and nature of soil
Origin and nature of soil
 
Clay Minerology & Plasticity Characteristics of Soil
Clay Minerology & Plasticity Characteristics of SoilClay Minerology & Plasticity Characteristics of Soil
Clay Minerology & Plasticity Characteristics of Soil
 

Recently uploaded

Application of Residue Theorem to evaluate real integrations.pptx
Application of Residue Theorem to evaluate real integrations.pptxApplication of Residue Theorem to evaluate real integrations.pptx
Application of Residue Theorem to evaluate real integrations.pptx959SahilShah
 
Comparative Analysis of Text Summarization Techniques
Comparative Analysis of Text Summarization TechniquesComparative Analysis of Text Summarization Techniques
Comparative Analysis of Text Summarization Techniquesugginaramesh
 
CCS355 Neural Network & Deep Learning Unit II Notes with Question bank .pdf
CCS355 Neural Network & Deep Learning Unit II Notes with Question bank .pdfCCS355 Neural Network & Deep Learning Unit II Notes with Question bank .pdf
CCS355 Neural Network & Deep Learning Unit II Notes with Question bank .pdfAsst.prof M.Gokilavani
 
Correctly Loading Incremental Data at Scale
Correctly Loading Incremental Data at ScaleCorrectly Loading Incremental Data at Scale
Correctly Loading Incremental Data at ScaleAlluxio, Inc.
 
Decoding Kotlin - Your guide to solving the mysterious in Kotlin.pptx
Decoding Kotlin - Your guide to solving the mysterious in Kotlin.pptxDecoding Kotlin - Your guide to solving the mysterious in Kotlin.pptx
Decoding Kotlin - Your guide to solving the mysterious in Kotlin.pptxJoão Esperancinha
 
Churning of Butter, Factors affecting .
Churning of Butter, Factors affecting  .Churning of Butter, Factors affecting  .
Churning of Butter, Factors affecting .Satyam Kumar
 
8251 universal synchronous asynchronous receiver transmitter
8251 universal synchronous asynchronous receiver transmitter8251 universal synchronous asynchronous receiver transmitter
8251 universal synchronous asynchronous receiver transmitterShivangiSharma879191
 
computer application and construction management
computer application and construction managementcomputer application and construction management
computer application and construction managementMariconPadriquez1
 
Study on Air-Water & Water-Water Heat Exchange in a Finned Tube Exchanger
Study on Air-Water & Water-Water Heat Exchange in a Finned Tube ExchangerStudy on Air-Water & Water-Water Heat Exchange in a Finned Tube Exchanger
Study on Air-Water & Water-Water Heat Exchange in a Finned Tube ExchangerAnamika Sarkar
 
Architect Hassan Khalil Portfolio for 2024
Architect Hassan Khalil Portfolio for 2024Architect Hassan Khalil Portfolio for 2024
Architect Hassan Khalil Portfolio for 2024hassan khalil
 
UNIT III ANALOG ELECTRONICS (BASIC ELECTRONICS)
UNIT III ANALOG ELECTRONICS (BASIC ELECTRONICS)UNIT III ANALOG ELECTRONICS (BASIC ELECTRONICS)
UNIT III ANALOG ELECTRONICS (BASIC ELECTRONICS)Dr SOUNDIRARAJ N
 
Call Girls Delhi {Jodhpur} 9711199012 high profile service
Call Girls Delhi {Jodhpur} 9711199012 high profile serviceCall Girls Delhi {Jodhpur} 9711199012 high profile service
Call Girls Delhi {Jodhpur} 9711199012 high profile servicerehmti665
 
Past, Present and Future of Generative AI
Past, Present and Future of Generative AIPast, Present and Future of Generative AI
Past, Present and Future of Generative AIabhishek36461
 
Gfe Mayur Vihar Call Girls Service WhatsApp -> 9999965857 Available 24x7 ^ De...
Gfe Mayur Vihar Call Girls Service WhatsApp -> 9999965857 Available 24x7 ^ De...Gfe Mayur Vihar Call Girls Service WhatsApp -> 9999965857 Available 24x7 ^ De...
Gfe Mayur Vihar Call Girls Service WhatsApp -> 9999965857 Available 24x7 ^ De...srsj9000
 
Oxy acetylene welding presentation note.
Oxy acetylene welding presentation note.Oxy acetylene welding presentation note.
Oxy acetylene welding presentation note.eptoze12
 
Risk Assessment For Installation of Drainage Pipes.pdf
Risk Assessment For Installation of Drainage Pipes.pdfRisk Assessment For Installation of Drainage Pipes.pdf
Risk Assessment For Installation of Drainage Pipes.pdfROCENODodongVILLACER
 

Recently uploaded (20)

Application of Residue Theorem to evaluate real integrations.pptx
Application of Residue Theorem to evaluate real integrations.pptxApplication of Residue Theorem to evaluate real integrations.pptx
Application of Residue Theorem to evaluate real integrations.pptx
 
Comparative Analysis of Text Summarization Techniques
Comparative Analysis of Text Summarization TechniquesComparative Analysis of Text Summarization Techniques
Comparative Analysis of Text Summarization Techniques
 
Call Us -/9953056974- Call Girls In Vikaspuri-/- Delhi NCR
Call Us -/9953056974- Call Girls In Vikaspuri-/- Delhi NCRCall Us -/9953056974- Call Girls In Vikaspuri-/- Delhi NCR
Call Us -/9953056974- Call Girls In Vikaspuri-/- Delhi NCR
 
CCS355 Neural Network & Deep Learning Unit II Notes with Question bank .pdf
CCS355 Neural Network & Deep Learning Unit II Notes with Question bank .pdfCCS355 Neural Network & Deep Learning Unit II Notes with Question bank .pdf
CCS355 Neural Network & Deep Learning Unit II Notes with Question bank .pdf
 
Correctly Loading Incremental Data at Scale
Correctly Loading Incremental Data at ScaleCorrectly Loading Incremental Data at Scale
Correctly Loading Incremental Data at Scale
 
Decoding Kotlin - Your guide to solving the mysterious in Kotlin.pptx
Decoding Kotlin - Your guide to solving the mysterious in Kotlin.pptxDecoding Kotlin - Your guide to solving the mysterious in Kotlin.pptx
Decoding Kotlin - Your guide to solving the mysterious in Kotlin.pptx
 
POWER SYSTEMS-1 Complete notes examples
POWER SYSTEMS-1 Complete notes  examplesPOWER SYSTEMS-1 Complete notes  examples
POWER SYSTEMS-1 Complete notes examples
 
Churning of Butter, Factors affecting .
Churning of Butter, Factors affecting  .Churning of Butter, Factors affecting  .
Churning of Butter, Factors affecting .
 
8251 universal synchronous asynchronous receiver transmitter
8251 universal synchronous asynchronous receiver transmitter8251 universal synchronous asynchronous receiver transmitter
8251 universal synchronous asynchronous receiver transmitter
 
computer application and construction management
computer application and construction managementcomputer application and construction management
computer application and construction management
 
young call girls in Green Park🔝 9953056974 🔝 escort Service
young call girls in Green Park🔝 9953056974 🔝 escort Serviceyoung call girls in Green Park🔝 9953056974 🔝 escort Service
young call girls in Green Park🔝 9953056974 🔝 escort Service
 
Study on Air-Water & Water-Water Heat Exchange in a Finned Tube Exchanger
Study on Air-Water & Water-Water Heat Exchange in a Finned Tube ExchangerStudy on Air-Water & Water-Water Heat Exchange in a Finned Tube Exchanger
Study on Air-Water & Water-Water Heat Exchange in a Finned Tube Exchanger
 
Architect Hassan Khalil Portfolio for 2024
Architect Hassan Khalil Portfolio for 2024Architect Hassan Khalil Portfolio for 2024
Architect Hassan Khalil Portfolio for 2024
 
UNIT III ANALOG ELECTRONICS (BASIC ELECTRONICS)
UNIT III ANALOG ELECTRONICS (BASIC ELECTRONICS)UNIT III ANALOG ELECTRONICS (BASIC ELECTRONICS)
UNIT III ANALOG ELECTRONICS (BASIC ELECTRONICS)
 
Call Girls Delhi {Jodhpur} 9711199012 high profile service
Call Girls Delhi {Jodhpur} 9711199012 high profile serviceCall Girls Delhi {Jodhpur} 9711199012 high profile service
Call Girls Delhi {Jodhpur} 9711199012 high profile service
 
Past, Present and Future of Generative AI
Past, Present and Future of Generative AIPast, Present and Future of Generative AI
Past, Present and Future of Generative AI
 
Exploring_Network_Security_with_JA3_by_Rakesh Seal.pptx
Exploring_Network_Security_with_JA3_by_Rakesh Seal.pptxExploring_Network_Security_with_JA3_by_Rakesh Seal.pptx
Exploring_Network_Security_with_JA3_by_Rakesh Seal.pptx
 
Gfe Mayur Vihar Call Girls Service WhatsApp -> 9999965857 Available 24x7 ^ De...
Gfe Mayur Vihar Call Girls Service WhatsApp -> 9999965857 Available 24x7 ^ De...Gfe Mayur Vihar Call Girls Service WhatsApp -> 9999965857 Available 24x7 ^ De...
Gfe Mayur Vihar Call Girls Service WhatsApp -> 9999965857 Available 24x7 ^ De...
 
Oxy acetylene welding presentation note.
Oxy acetylene welding presentation note.Oxy acetylene welding presentation note.
Oxy acetylene welding presentation note.
 
Risk Assessment For Installation of Drainage Pipes.pdf
Risk Assessment For Installation of Drainage Pipes.pdfRisk Assessment For Installation of Drainage Pipes.pdf
Risk Assessment For Installation of Drainage Pipes.pdf
 

soil mechanics for COTM.pptx

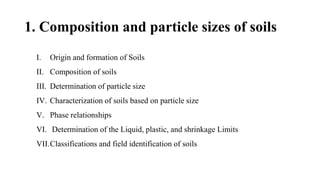
  • 1. 1. Composition and particle sizes of soils I. Origin and formation of Soils II. Composition of soils III. Determination of particle size IV. Characterization of soils based on particle size V. Phase relationships VI. Determination of the Liquid, plastic, and shrinkage Limits VII.Classifications and field identification of soils
  • 2. Origin And Formation Of Soils • DEFINITION OF SOIL • Soil is a natural body comprised of solids (minerals and organic matter), liquid, and gases that occurs on the land surface, occupies space, • characterized by one or both of the following: horizons, or layers, that are distinguishable from the initial material as a result of additions, losses, transfers, and transformations of energy and matter or the ability to support rooted plants in a natural environment. • The formation of soil happens over a very long period of time. It can take 1000 years or more. • Soil is formed from the weathering of rocks and minerals. The surface rocks break down into smaller pieces through a process of weathering and is then mixed with moss and organic matter.
  • 3. Cont. • Geotechnical engineering is the branch of civil engineering concerned with the engineering behavior of earth materials. • includes investigating existing subsurface conditions and materials; assessing risks posed by site conditions; designing earthworks and structure foundations; and monitoring site conditions, earthwork and foundation construction. • A typical geotechnical engineering project begins with a site investigation of soil, rock, fault distribution and bedrock properties on and below an area of interest to determine their engineering properties including how they will interact with, on or in a proposed construction. Site investigations are needed to gain an understanding of the area in or on which the engineering will take place. Investigations can include the assessment of the risk to humans, property and the environment from natural hazards such as earthquakes, landslides, sinkholes, soil liquefaction, debris flows and rock falls. • According to Terzaghi (1948): “Soil mechanics is the application of the laws of mechanics and hydraulics to engineering problems dealing with sediments and other unconsolidated accumulations of solid particles produced by the mechanical and chemical disintegration of rocks regardless of whether or not they contain an admixture of organic constituents”.
  • 4. Cont. • SOIL FORMATION : Weathering is the process of the breaking down rocks. There are two different types of weathering. Physical weathering and chemical weathering. • In physical weathering it breaks down the rocks, but what it's made of stays the same. • Among the physical weathering Temperature Changes, Freezing action of water, Spreading of roots of plants, and Abrasion. • In chemical weathering it still breaks down the rocks, but it may change what it's made of. For instance, a hard material may change to a soft material after chemical weathering. • Oxidation: Oxidation occurs frequently in rocks containing iron, which decomposes in a manner similar to the rusting of steel when in contact with moist-air. • Carbonation: The mineral containing iron, calcium, magnesium, sodium or potassium can be decomposed by carbonic acid, which is formed by carbon dioxide with water. • Hydration: Hydration is a common process of rock decay by which water is combined with some other soil substances thus producing certain new minerals. • Leaching: Leaching is the process whereby water-soluble parts are dissolved and washed out from the soil by rainfall, percolating water, subsurface flow or other water.
  • 6.
  • 7. Soil Types Soil Types • Residual Soil • Sediment Soil • Alluvium Soil • Lacustrine Soil • Aeolian soils • Marine Soil • Particular Soil • Sand, Gravel, Cobbles And Boulders • Silt • Clay • Expansive Soil • Organic Soil • Collapsible Soil • Quick Clay • Alluvial soils are those soils that have been transported by running water and deposited along a stream. • Aeolian soils are those soils that have been transported and deposited by wind. • Lacustrine soils are those soils that have been deposited from suspension in quite fresh water lakes. • Colluvial soils are those soils that have been deposited by movement of soil by gravity such as landslides. • Marine soils are those soils that have been deposited from suspension in seawater. • Glacial soils are those soils that have been deposited as a result of glacial activities • Particle Bonding The particle bonding is very weak so relatively easy to going to change and have non-linear behavior and characteristic • Cohesive Soil • Non-cohesive Soil (Cohesionless)
  • 8. Physical Properties Of Soil • Basic Definition And Phase Relations Air Water Soil Mass • Soil mass is generally a three phase system • The inter-relationships of the weights and volumes of the different phases are important since they help to define the condition or the physical make-up of a soil. • Thus the total volume V of a given soil sample can be expressed as V = Vs + Vv = Vs + Vw +Va
  • 9. Cont. • VOID RATIO; e : The ratio of void volume (Vv) to soil volume (Vs) (given in decimal, 0.65) 0 < e <  • POROSITY ; n : The ratio of void volume (Vv) to total volume (V) (given in percent 100%, 65%) 0  n  1 Relationship between void ratio and porosity or n n e   1 e e n   1 s v V V e  V V n v  • DEGREE OF SATURATION S (given in percent 100%, 65%) % 100 ) ( ) (   v w V voids of volume Total V water contains voids of volume Total S • WATER CONTENT;  : The ratio of the amount of water (Ww) in the soil (Ws) and expressed as a percentage 0% <  <  % 100 x W W s w   Completely dry soil S = 0 % Completely saturated soil S = 100% Unsaturated soil (partially saturated soil) 0% < S < 100%
  • 10. Weight Relationships • Water Content w (100%) • For some organic soils w>100%, up to 500 % • For quick clays, w>100% • Density of water (slightly varied with temperatures) • Density of soil a. Dry density b. Total, Wet, or Moist density (0%<S<100%, Unsaturated) c. Saturated density (S=100%, Va =0) d. Submerged density (Buoyant density) % 100 ) ( ) (   s w M solids soil of Mass M water of Mass w ) V ( sample soil of volume Total ) M ( solids soil of Mass t s d   ) V ( sample soil of volume Total ) M M ( sample soil of Mass t w s    ) V ( sample soil of volume Total ) M M ( water solids soil of Mass t w s sat     w sat '      3 3 3 w m / Mg 1 m / kg 1000 cm / g 1    
  • 11. Cont. Submerged unit weight: Consider the buoyant force acting on the soil solids: w sat '      w sat t w t w s t w w t s t w w t s t w s s V V W W V W V W %) 100 S ( V ) V V ( W V V W                       
  • 12. • Mass is a measure of a body's inertia, or its "quantity of matter". Mass is not changed at different places. • Weight is force, the force of gravity acting on a body. The value is different at various places (Newton's second law F = ma) (Giancoli, 1998) • The unit weight is frequently used than the density is (e.g. in calculating the overburden pressure). w s w s w s s 3 2 g g G m kN 8 . 9 , Water sec m 8 . 9 g gravity to due on accelerati : g Volume g Mass Volume Weight , weight Unit Volume Mass , Density                           • UNIT WEIGHT : The ratio of weight to volume w w w V W   s s s V W   V W  
  • 13. – RELATIONSHIP OF SOIL PARAMETERS ) 1 (      d V Ws d   V W   W Ws d   .  w s W W W   s w s s d W W W W     ) 1 (      d
  • 15.
  • 16. Determination of particle size • In this system soils are split into coarse-grained non-cohesive, fine- grained cohesive and organic soils. Most systems of soil classification depend to some extent upon the distribution of various sized particles in the soil. • Mechanical analysis can be divided into 1. Sieve analysis 2. Hydrometer analysis • For coarse-grained material this distribution may be determined by sieving, and for finer particles a method of measuring the rate of settlement in water is used.
  • 17. Sieve Analysis • The sieve analysis is carried out by sieving a known dry weight of sample through the set of sieves placed one below the other, so that the openings decrease in size from the top sieve down, with a pan at the bottom of the stock. • By determining the weight of soil sample left on each sieve, the following calculations can be made.
  • 19. Sieve Analysis • Test Standard ASTM D422, AASHTO T88 • The testing should be only carried out once for one sample • The result will be plotted in the form of graph on semi- log paper with the percentage finer on the arithmetic scale and the particle diameter on the log scale • The shapes of the curves indicate the nature of the soil tested. On the basis of the shapes one can classify soils as 1. Uniformly graded or poorly graded 2. Well graded 3. Gap graded
  • 20. Curve of Particle Size Distribution • Uniformly graded soils are represented by nearly vertical lines as shown by curve ΙΙ • A well-graded soil, represented by curve Ι, possesses a wide range of particles sizes ranging from gravel to clay size particles. • A gap-graded soil, as shown by curve ΙΙΙ has some of the sizes of particles missing. 10 60 D D CU  60 10 2 30 .D D D CC 
  • 21. Hydrometer Analysis • Soil particle sizes smaller than 0.075 mm (passing 200 mesh sieve) are determined by the so-called hydrometer method and it is based on the process of sedimentation of soil particles in water by gravity. • Used to extend the distribution curve of particle shape and to predict the particle size less than 200 sieve • Principle of work : sedimentation of soil particle in water • Stoke rule is valid : • or        18 D v 2 w s
  • 22. Determination of the Liquid, plastic, and shrinkage Limits • The Swedish Scientist, Atterberg (1911), developed a method of describing quantitatively the effect of varying water content on the consistency of fine-grained soils. • He established the four states of soil consistency, which are called the liquid, the plastic, the semi-solid, and the solid states. • proposed a series of tests for determining the boundaries known as Atterberg limits between the physical states of soil. • Each boundary or limit is defined by the water content that produces a specified consistency.
  • 23. SL PL LL Water content Volume Solid Plastic Liquid Plasticity Index PI Semi Solid
  • 24. Determination of Atterberg limits • CASAGRANDE METHOD (LL)
  • 27. PLASTIC LIMIT (PL) Plastic behaviour The test is done by rolling up the soil sample to 3.2mm diameter Defined as the water content, in percent, at which the soil crumbles, when rolled into threads of 1/8 in (3.2mm) in diameter.
  • 28. • Test Standard : ASTM D 427 • After drying the soil sample in an oven, and determining the mass and volume of sample before(i) and after (f) drying: SHRINKAGE LIMIT (SL) [ ( ) ] 100 mi mf vi vf SL w mf mf       • Plasticity Index (PI):- Is the range of water content over which the soil exhibits plasticity. • A cohesion less soil has zero plasticity index. • Such soil as termed as non-plastic • clays are highly plastic and posses a high plasticity index.
  • 29. Assignment one - A • Write the test procedures and prepare laboratory report formats for the Atterberg limit tests.
  • 30. Classifications and field identification of soils • PURPOSE: To classified the soil into a group according to the soil behavior and physical shape • TYPE OF CLASSIFICATION: • CLASSIFICATION BY VISUAL • AASHTO ( • UCS • CLASSIFICATION BY VISUAL Carried out by direct observation (visual examination) to the sample and approximate the type of soil by: – Colour – Smell – Sense/Feeling – endurance – Swelling – Sedimentation
  • 31. AASHTO (American Association of State Highway and Transport Official) • The soil classified into 7 major categories (A-1 to A-7) • Based on: • The result of Sieve Analysis • Atterberg Limits Plasticity Index for sub group A-7-5  LL minus 30. Plasticity Index for sub group A-7-6 > LL minus 30
  • 32. AASHTO GROUP INDEX The soil quality based on Group Index Calculation ) 10 )( 15 ( 01 . 0 )} 40 ( 005 . 0 2 . 0 ){ 35 (        PI F LL F GI F = The percentage of soil pass sieve no. 200 Subgrade Group Index Value Very good Soil Class A-1-a (0) Good 0 – 1 Medium 2 – 4 Bad 5 – 9 Very Bad 10 - 20 GROUP INDEX Rules: • If GI < 0, GI = 0 • GI  Integer Number • No upper limit of GI • For coarse grained, – GI = 0 for A-1-a, A-1-b, A-2-4, A-2-5 and A-3 – GI =0,01(F-15)(PI-10) for A-2-6 and A- 2-7
  • 33. Make examination of soil to determine whether it is granular or silt clay materials Determine amount passing No. 200 sieve Granular Materials 35% or less pass No. 200 sieve Silt-Clay Materials 36% or more pass No. 200 sieve Less than 25% pass No. 200 sieve Run sieve analysis, also LL and PL on minus No. 40 sieve material A-1 Less than 50% pass No. 40 sieve Less than 15% pass No. 200 sieve Less than 30% pass No. 40 sieve Less than 50% pass No. 10 sieve PI less than 6 Less than 25% pass No. 200 sieve Less than 50% pass No. 40 sieve PI less than 6 A-1-a A-1-b Greater than 50% pass No. 40 sieve A-2 Less than 35% pass No. 200 sieve Less than 10% pass No. 200 sieve Nonplastic A-3 Run LL and PL on minus No. 40 sieve material Silty PI less than 10 Clayey PI greater than 11 LL less than 40 LL greater than 41 A-2-4 A-2-5 LL less than 40 LL greater than 41 A-2-6 A-2-7 Run LL and PL on minus No. 40 sieve material Silt PI less than 10 Clay PI greater than 11 LL less than 40 LL greater than 41 LL less than 40 A-7 LL greater than 41 A-4 A-5 A-6 PI equal to or less than LL minus 30 or PL equal to or greater than 30 PI greater than LL minus 30 or PL less than 30 A-7-5 A-7-6
  • 34. USCS (UNIFIED SOIL CLASSIFICATION SYSTEM) • originally proposed by A. Casagrande in 1942 • Soil classification determined base on the soil parameter i.e.: – Diameter of soil particle • Gravel : pass sieve no.3 but retained at sieve no. 4 • Sand : pass sieve no. 4 but retained at sieve no. 200 • Silt and Clay : pass sieve no. 200 – Coefficient of soil uniform – Atterberg Limits • Notation – G= Gravel – M = Inorganic Silt – C = inorganic Clay – O = Organic Silt or Clay – W = Well Graded – P = Poorly Graded – L = Low Plasticity – H = High Plasticity Soil Type Prefix Sub-group Suffix Well Graded W Gravel G Poor Graded P Sand S Silty M Clayey C Silt M Clay C LL < 50% L Organic O LL > 50% H Peat Pt
  • 35. Make visual examination of soil to determine whether it is HIGHLY ORGANIC, COARSE GRAINED, or FINE GRAINED, ini borderline cases determine amount passing No. 200 sieve HIGHLY ORGANIC SOIL (Pt) Fibrous texture, color, odor, very high moisture content, particle of vegetable matter (sticks, leaves, etc.) COARSED GRAINED 50% or less pass No.200 sieve FINE GRAINED More than 50% pass No.200 sieve THE FLOW CHART OF USCS METHOD
  • 36. COARSED GRAINED 50% or less pass No.200 sieve Run sieve analysis GRAVEL (G) Greater percentage of coarse fraction retained on No. 4 sieve SAND (S) Greater percentage of coarse fraction pass on No. 4 sieve Less than 5% pass No. 200 sieve * Between 5% and 12% pass No. 200 sieve more than 12% pass No. 200 sieve Examine grain size curve Borderline. to have double symbol appropriate to grading and plasticity characteristic, e.g. GW-GM Run LL and PL on minus No. 40 sieve fraction Well Graded Poorly Graded GW GP Below A line and hatched zone on plasticity chart Limits plot in hatched zone on plasticity chart Above A line and hatched zone on plasticity chart GM GM-GC GC Less than 5% pass No. 200 sieve * Between 5% and 12% pass No. 200 sieve more than 12% pass No. 200 sieve Examine grain size curve Borderline. to have double symbol appropriate to grading and plasticity characteristic, e.g. GW-GM Run LL and PL on minus No. 40 sieve fraction Well Graded Poorly Graded Below A line and hatched zone on plasticity chart Limits plot in hatched zone on plasticity chart Above A line and hatched zone on plasticity chart SW SP SM SM-SC SC FLOWCHART OF USCS METHOD (CONTINUED)
  • 37. FINE GRAINED More than 50% pass No.200 sieve Run LL and PL on minus No.40 sieve material L Liquid Limit less than 50 H Liquid Limit more than 50 Below A line and hatched zone on plasticity chart Limits plot in hatched zone on plasticity chart Above A line and hatched zone on plasticity chart Color, odor, possibly LL and PL on oven dry soil Organic Inorganic Below A line on plasticity chart Above A line on plasticity chart Color, odor, possibly LL and PL on oven dry soil Inorganic Organic OL ML ML-CL CL MH OH CH
  • 38. Plasticity Chart • The plasticity chart is a plot of plasticity index versus liquid limit. Fine-grained soils are subdivided into soils of low, medium and high plasticity following the criteria cut- lined below • The diagonal line drawn in the plasticity chart is called the “A” line and is given by the equation PΙ = 0.73 (ωℓ - 20). Clays fall above the A-line and silts below it.
  • 39. Grain Size Classification • It is based on grain size of the soils and is essentially useful for classifying soils in which single grain properties are of importance. • A mechanical analysis is all that is required to classify a given sample of soil. Three of the grain size classifications that are in common use are the following.
  • 41. 41 INTRODUCTION Soil compaction is defined as the method of mechanically increasing the density of soil. In construction, this is a significant part of the building process. If performed improperly, settlement of the soil could occur and result in unnecessary maintenance costs or structure failure
  • 42. 42 SOIL COMPACTION PURPOSE  Improving the soil quality by: – Increasing the shear strength of soil – Improving the bearing capacity of soil  Reduces the settling of soil  Reduces the soil permeability  To control the relative volume change
  • 43. 43 TYPES OF COMPACTION 4 types of compaction effort on soil :  Vibration  Impact  Pressure
  • 44. 44 BASIC THEORY Developed by R.R. Proctor at 1920-an with 4 variables :  Compaction efforts (Compaction Energy)  Soil types  Water content  Dry Unit Weight LABORATORY COMPACTION TEST  Standard Proctor Test  Modification Proctor Test  Dietert Compaction  Harvard Miniatur Compaction SOIL COMPACTION
  • 45. 45 STANDARD PROCTOR TEST The soil is compacted at cylindrical tube Specification of test and equipments  Hammer weight = 2,5 kg (5,5 lb)  Falling height = 1 ft (305 mm)  Amount of layers = 3  No. of blows/layer = 25  Compaction effort = 595 kJ/m3  Soil type = pass sieve no. 4 The test is carried out several time with different water content After compacted, the weight, moisture content and unit weight of samples are measured Test Standard :  AASHTO T 99  ASTM D698
  • 46. 46 MODIFIED PROCTOR TEST • The soil is compacted at cylindrical tube • Specification of test and equipments – Hammer weight = 4.5 kg (10 lb) – Falling height = 1.5 ft (457 mm) – Amount of layers = 5 – No. of blows/layer = 25, 56 – Compaction effort = 2693 kJ/m3 – Soil type = pass sieve no. 4 • The test is carried out several time with different water content • After compacted, the weight, moisture content and unit weight of samples are measured • Test Standard : – AASHTO T 180 – ASTM D1557
  • 48. 48 FIELD COMPACTION Type of Compaction Equipment :  Smooth Wheel Roller : compaction equipment which supplies 100% coverage under the wheel, with ground contact pressures up to 400 kPa and may be used on all soil types except rocky soils. Mostly use for subgrades and compacting asphalt pavements.
  • 49. 49 FIELD COMPACTION Type of Compaction Equipment :  Rubber Tire Roller : A heavily loaded wagon with several rows of three to six closely spaced tires with tire pressure may be up to about 700 kPa and has about 80% coverage (80% of the total area is covered by tires). This equipment may be used for both granular and cohesive highway fills.
  • 50. 50 FIELD COMPACTION Type of Compaction Equipment :  Sheepsfoot Roller : This roller has many round or rectangular shaped protrusions or “feet” attached to a steel drum. The area of these protusions ranges from 30 to 80 cm2. Area coverage is about 8 – 12% with very high contact pressures ranging from 1400 to 7000 kPa depending on the drum size and whether the drum is filled with water. The sheep foot roller is best suited for cohesive soils.
  • 51. 51 FIELD COMPACTION Type of Compaction Equipment :  Grid Roller : This roller has about 50% coverage and pressures from 1400 to 6200 kPa, ideally suited for compacting rocky soils, gravels and sand. With high towing speed, the material is vibrated, crushed, and impacted.
  • 52. 52 FIELD COMPACTION Type of Compaction Equipment :  Baby Roller : Small type of smooth wheel roller yang, which has pressure ranges from 10 to 30 kPa. The performance base on static weight and vibration effect.
  • 53. 53 FIELD COMPACTION Type of Compaction Equipment:  Vibrating Plate : Compaction equipment, which has plate shape. This equipment sometimes called as “stamper”. Usually used for narrow area and high risk when use large compaction equipment like smooth wheel roller etc.
  • 54. 54 CONDITIONER FACTORS Characteristic of compaction equipment  Weight and size  Operation frequency and frequency range Soil Characteristic  Initial density  Soil type  Size and shape of soil particle  Moisture Content Compaction Procedure  No. of passes of the roller  Layer thickness  Frequency of operation of vibrator  Towing speed
  • 55. 55 FIELD COMPACTION CONTROL Excavate a hole with certain diameter and depth. Determine the mass of excavated material. Determine the moisture content Measure the volume of excavated material by:  Ottawa Sand  Sand cone  The balloon method  Pouring water or oil Compute the total density,  and d,field Compare d, field with d,max and calculate the relative compaction
  • 56. 56 SPECIFICATION OF COMPACTION End Product Specification Method of Specification  Minimum soil sample 100 kg  Need special experience to find out the optimum moisture content in order to get optimum compaction performance % 100 (max) ) ( x RC d field d   
  • 57. 57 Assignment one - B 1. Write the test procedures for standard proctor test and modified proctor test. 2. What is the difference between standard proctor test and modified proctor test. Assignment one – C . solve all the exercise equations on the handout.

Editor's Notes

  1. Igneous Rocks Sedimentary Rocks: Metamorphic Rocks
  2. Residual soils are soils, which are still located in the place of their origin deposited in an area different from their place of origin. Residual soils are usually homogeneous and stiff while transported soils are loose, soft and non-homogeneous.
  3. The fluid (water) can flow more easily through the soil with higher hydraulic conductivity
  4. To determine whether a material is uniformly graded or well graded, Hazen proposed the following equation Cu = Uniformity coefficient D60 = 60% size D10 = Effective size, or 10% size The uniformity coefficient Cu, is about one, usually indicates a soil in which the grains are practically of the same size (uniform soil). A large coefficient represents a well-graded soil.
  5. The liquid state is produced when a fine grained soil is mixed with a large quantity of water. In such state the soil behaves like a liquid. That is, it flows freely like a liquid and has no resistance to deformation. If, however, its water content is gradually reduced, it will begin to show a small shearing strength. The limit at which soil suspension passes from no strength to a very small strength is the liquid limit.