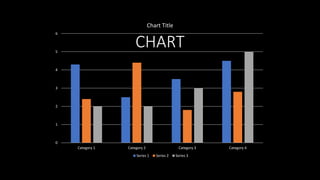
This chart compares 4 categories across 6 data points. It contains 3 data series that provide measurements for Categories 1 through 4 over the range from 0 to 5 on the y-axis. In summary, the chart presents comparative data across 4 categories using 3 data series to show measurements at 6 different data points.