MGI MarketLens™: Billing Complexity vs. Volume – BluLogix Spotlight
•
0 likes•11 views

MGI Research’s MarketLens™ Reports map a select group of billing software products against a set of coordinates that combines Billing Volume (BV) and Billing Complexity (BC) and Billing Complexity (BC) and Billing Agility (BA).

Recommended
Recommended
More Related Content
Similar to MGI MarketLens™: Billing Complexity vs. Volume – BluLogix Spotlight
Similar to MGI MarketLens™: Billing Complexity vs. Volume – BluLogix Spotlight (20)
More from BluLogix
More from BluLogix (13)
Recently uploaded
Recently uploaded (20)
MGI MarketLens™: Billing Complexity vs. Volume – BluLogix Spotlight
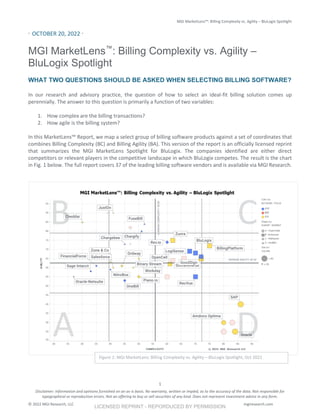
- 1. MGI MarketLens™: Billing Complexity vs. Agility – BluLogix Spotlight Disclaimer: Information and opinions furnished on an as-is basis. No warranty, written or impled, as to the accuracy of the data. Not responsible for typographical or reproduction errors. Not an offering to buy or sell securities of any kind. Does not represent investment advice in any form. © 2022 MGI Research, LLC mgiresearch.com 1 · OCTOBER 20, 2022 · MGI MarketLens™ : Billing Complexity vs. Agility – BluLogix Spotlight WHAT TWO QUESTIONS SHOULD BE ASKED WHEN SELECTING BILLING SOFTWARE? In our research and advisory practice, the question of how to select an ideal-fit billing solution comes up perennially. The answer to this question is primarily a function of two variables: 1. How complex are the billing transactions? 2. How agile is the billing system? In this MarketLens™ Report, we map a select group of billing software products against a set of coordinates that combines Billing Complexity (BC) and Billing Agility (BA). This version of the report is an officially licensed reprint that summarizes the MGI MarketLens Spotlight for BluLogix. The companies identified are either direct competitors or relevant players in the competitive landscape in which BluLogix competes. The result is the chart in Fig. 1 below. The full report covers 37 of the leading billing software vendors and is available via MGI Research. Figure 1: MGI MarketLens: Billing Complexity vs. Agility – BluLogix Spotlight, Oct 2022 LICENSED REPRINT - REPORDUCED BY PERMISSION
- 2. MGI MarketLens™: Billing Complexity vs. Agility – BluLogix Spotlight Disclaimer: Information and opinions furnished on an as-is basis. No warranty, written or impled, as to the accuracy of the data. Not responsible for typographical or reproduction errors. Not an offering to buy or sell securities of any kind. Does not represent investment advice in any form. © 2022 MGI Research, LLC mgiresearch.com 2 HOW TO READ THE MGI MARKETLENS An MGI MarketLens Report dissects a given universe of suppliers and plots how a select group of suppliers compare using a pair of key coordinates. It sheds light on the variations among solutions in a given market, and helps prospective buyers, investors, and partners see where products align relative to core requirements. The MarketLens Report is one of several types of research that MGI produces – for more information on 360 Ratings™, Use Case Notes™, and MarketLens Reports, see Appendix B. The companies selected for the MarketLens are a cross-section of vendors covered in our Agile Monetization practice and not meant to be an exhaustive catalog of every possible billing solution on the market. Placement of companies represents typical use case sweet spot, not the absolute maximum performance – which is typically more of a range. We aimed for selecting what in our view would represent the best use case with the least amount of friction. In the chart above, we further segment companies based on the market segment of their core focus: • HyperScale – solutions that deal with high complexity and very high volumes, especially in real-time billing contexts; e.g., SAP, Oracle • Enterprise – mainstream enterprise billing solutions that can handle a relatively high combination of complexity and volume in scenarios that require up to quick-time but not real-time processing; e.g., Zuora, BillingPlatform, Gotransverse, LogiSense, et al. • MidMarket – solutions aimed at the needs of a larger number of midsize organizations with a variety of use cases and a strong balance of agility, out-of-the-box ERP and FP&A interfaces, and modest implementation complexity; e.g., Oracle NetSuite, Salesforce, et al. • SmallBiz – billing solutions aimed specifically at the needs of small, often rapidly growing organizations that typically emphasize low initial investment, a pay-as-you-go pricing model to support scaling, rapid deployment, and maintenance agility without having to rely on expensive IT resources either internally or through systems integrators; e.g., JustOn, ChargeOver, ChargeBee, FuseBill, et al. We see strong demand across all segments of the Billing market, but especially strong activity in the SmallBiz and MidMarket areas. The MarketLens chart is divided into four quadrants by the lines representing average volume and average complexity. The quadrants map suppliers into: • Quadrant A: those that can support modest volume and modest complexity (these are also often the suppliers that demonstrate high agility); • Quadrant B: those that can support modest volumes and higher complexity; • Quadrant C: those that can support high volumes and high complexity; and • Quadrant D: those that can support higher volumes with modest complexity. The focus of the MarketLens placement of vendors is to identify the best use case for each supplier, not to assign a value judgement. The MarketLens above uses color to highlight the most likely business model of target customers: B2C, B2B or both – B2X. LICENSED REPRINT - REPORDUCED BY PERMISSION
- 3. MGI MarketLens™: Billing Complexity vs. Agility – BluLogix Spotlight Disclaimer: Information and opinions furnished on an as-is basis. No warranty, written or impled, as to the accuracy of the data. Not responsible for typographical or reproduction errors. Not an offering to buy or sell securities of any kind. Does not represent investment advice in any form. © 2022 MGI Research, LLC mgiresearch.com 3 The size of the shape of each company corresponds to a rating of solution volume, a metric that describes the typical number of invoices generated per month. Companies represented by larger shapes can handle a greater number of monthly invoices than companies represented by smaller shapes. HOW TO MEASURE BILLING COMPLEXITY (BC) We assign a relative score of Billing Complexity (BC) on a scale of 0 to 100 to what is the most likely (not the most complex) use case a supplier can tackle with ease. BC measurement should be synthesized based on numerous factors that reflect both the current and potential complexity of a business. Examples of such factors include: (The following is not intended as an exhaustive list.) • Product Complexity: describes the various capabilities of a standalone product, fixed subscription, or complex suite of interdependent components, software, and services. The sale of kitchen knives through an e-commerce portal might represent the low end of the product complexity spectrum, while the high end of the spectrum might include a programmatic relationship to deliver and manage a fleet of commercial aircraft over many years. • Pricing Complexity: the number of different pricing models and attributes that require support now and in the near-to-midterm future; e.g., simple subscriptions, usage and other metered approaches, outcome- based pricing, etc. • Billing Attributes Complexity: how many billing and metering attributes need to be supported; e.g., pre- paid vs post-paid, volume purchasing agreements and commitments, peak-vs-off-peak pricing, etc. • Channel Complexity: how product catalog, pricing, and discounting discipline can be maintained when a product is sold through a channel. • Payment Complexity: how many different payment methods are required; e.g., credit/debit cards, Purchase Orders, Buy-Now-Pay-Later (BNPL), bank transfers, alternative payment methods and wallets, cash-on-delivery, etc. Does the solution need to support both pay-in as well as pay-out – a capability critical to supporting marketplaces? • Regulatory Compliance Complexity: describes the payment, tax, privacy, and security mandates that need to be supported; e.g., PCI, etc. • Geographic Complexity: how billing differs depending on the country of purchase, delivery, etc. What payment methods need to be supported locally to minimize revenue leakage? • Business Rate of Change (BRC) Complexity: how rapid is the rate of change in the business? Companies that deal with everchanging competitive and/or regulatory issues are often forced to optimize for speed rather than absolute functionality in their billing solutions. • Timing Complexity: deadlines, accessibility of data, timing of inputs, outputs, and calculations. How rapidly should transaction outcomes be translated into billing transactions and invoices? There is a vast difference in complexity needs between organizations that can simply aggregate all of their transactions for one monthly run vs companies that need to update account status in real-time, or at least in quick- time. • Data Complexity: billing accuracy and customer satisfaction can be severly impacted when source data for billing is contained in multiple incongruent data sets, or when data is un-normalized, poorly classified, erroneous, or incomplete; e.g., a price point based on consumption contained in two different data sets, with one measuring everything in liters and the other in Imperial gallons. • Integration Complexity: what are the necessary points of connectivity and integration between billing and other internal and external systems and business processes? LICENSED REPRINT - REPORDUCED BY PERMISSION
- 4. MGI MarketLens™: Billing Complexity vs. Agility – BluLogix Spotlight Disclaimer: Information and opinions furnished on an as-is basis. No warranty, written or impled, as to the accuracy of the data. Not responsible for typographical or reproduction errors. Not an offering to buy or sell securities of any kind. Does not represent investment advice in any form. © 2022 MGI Research, LLC mgiresearch.com 4 • Implementation Complexity: can the selected billing product handle the level of complexity required to implement the billing solution in a typical customer environment? This often involves an assessment of the given customer’s internal ecosystem. • Organizational Complexity: describes the impact of complex organizational structures on Billing; e.g., complex divisional hierarchies with intersecting economic relationships, intercompany balance of trade accounting, eliminations, payment splits, and payment responsibilities. • Invoice Complexity: describes the format of the invoice (e.g., paper, digital/EDI vs. interactive), the level of detail required in terms of both inclusion and suppression of information, the invoice distribution rules, how many languages need to be supported, etc., as well as how these rules are affected by billing attributes such as location of purchase vs. location of installation, product, customer, invoice value, etc. • Data Velocity Complexity: how fast the source data for billing needs to be processed; e.g., real-time vs. quick-time vs. scheduled billing run. HOW TO MEASURE BILLING AGILITY (BA) Billing Agility (BA) describes the flexibility to quickly configure and test new pricing mechanisms and introduce changes as dictated by market conditions. Lack of agility results in long launch cycles, difficulty or inability to introduce new pricing mechanisms within a window of opportunity, and often translates into loss of market share and significant competitive disadvantage. BA can be measured as a composite of its three primary dimensions: Business, IT, and Product Agility. Business Agility: describes factors such as abstraction of pricing models and business rules, corporate hierarchies, multi-tier discounting models, multi-bucket pricing models, and ability to mix and match subscription, volume, and usage pricing. The most agile systems tend to have a well-defined, object- oriented infrastructure, an extensible data model, and configurable user interfaces that facilitate change. IT Agility: can be measured by evaluating the time, cost, and resources needed to enable IT activities such as installation, customization, configuration, testing, deployment, monitoring, ongoing maintenance and/or upgrades, and market rollout. Product Agility: refers to the speed with which a given solution can respond to technology changes – such as user experience, mobility, cloud, big data, and protection from expensive upgrade cycles and unforeseen costs. Product agility can be measured by evaluating factors such as frequency of product enhancements, percent of users on the latest release, product spread, customization percentage, integration capabilities, development tools, and deployment model. BOTTOM LINE/ACTION ITEMS When selecting a billing solution, the key rule to remember is that one size does not fit all. Users need to understand their own context in terms of billing complexity and volume. Highly specific use case scenarios need to be developed in order to assess potential shortlist suppliers, as well as the results of any field evaluation. Different classes of problems may require different tool sets. There remains a great diversity in the Billing software market. The concept of a single product that can handle a very broad spectrum of use cases is unrealistic in most situations. On average, enterprise companies have more than 30 different billing solutions in use. As previously mentioned, scripted use case scenarios should play a dominant role in the selection process. Generally, just because a potential Billing software supplier states that they are an Enterprise or HyperScale player, this does not mean they can handle each specific use case – simply because the definitions of scale and complexity LICENSED REPRINT - REPORDUCED BY PERMISSION
- 5. MGI MarketLens™: Billing Complexity vs. Agility – BluLogix Spotlight Disclaimer: Information and opinions furnished on an as-is basis. No warranty, written or impled, as to the accuracy of the data. Not responsible for typographical or reproduction errors. Not an offering to buy or sell securities of any kind. Does not represent investment advice in any form. © 2022 MGI Research, LLC mgiresearch.com 5 vary widely. Having an early discussion with potential suppliers about complexity and volume can save a lot of time for all parties. Companies in the market for a new Billing solution should validate volume, speed, and complexity metrics by contacting references. APPENDIX A: About MGI Research MGI Research is a vendor agnostic research and advisory firm serving business, finance, and IT executives, technology leaders, and institutional investors. Recognized for its depth, fierce independence, and industry insights, MGI utilizes a quantitative research methodology to produce vendor ratings, benchmarks, market size estimates, and use case notes. MGI Research pioneered the concept of an Agile Monetization Platform (AMP) and hosts the Monetize events. MGI also leads Best Practices groups for finance, business, and IT executives. MGI Verified is an independent entity digitizing the reference check process (mgiverified.com). APPENDIX B: How To Use MGI MarketLens™, MGI Use Case Notes™, and MGI 360 Ratings™ A MGI MarketLens™ Report dissects a given universe of suppliers and plots how a select group of suppliers compare using a pair of key coordinates. It sheds light on the variations among solutions in a given market, and helps prospective buyers, investors, and partners see where products align relative to core requirements. MGI 360 Ratings™ are a comprehensive quantitative analysis of a vendor/solution. Using a scale of 0-100, suppliers and solutions are assessed in five areas: Product, Finance, Channels, Management, and Strategy/Marketing. The MGI 360 Ratings are on a scale from 0 to 100 and reflect the research and analysis of MGI analysts. PRODUCT: How strong is the product competitive position? MANAGEMENT: How competent and experienced is management and overall company talent? CHANNELS: Does the company have the sales capability and channels needed to bring products to market? STRATEGY: Does the company have a realistic view of the opportunity and a compelling strategy for success? FINANCE: Is the company growing and profitable? In total, over 140 criteria are combined to generate an MGI 360 Rating in each specific market space. MGI 360 Ratings are revised as important developments occur. Company scores are not meant to be a predictor of company solvency, liquidity, absence of accounting fraud, or future stock performance. The MGI Use Case Note™ describes the ideal customer profile for a given solution. It helps prospective buyers understand the "best fit" for a product or service. The aim is to help prospective buyers quickly and confidently narrow the list of suppliers that could meet a particular use case. It is not intended to describe the entire range of possible use cases, nor is it an in-depth analysis of the supplier or solution. For an-depth analysis of a solution, see MGI Research 360 RatingsTM . APPENDIX C: All Companies Mentioned in This MarketLens Amdocs Optima FinancialForce OneBill Rev.io BillingPlatform FuseBill OpenCell Sage Intacct BinaryStream GoodSign Oracle Salesforce BluLogix Gotransverse Oracle NetSuite SAP Chargebee JustOn Ordway Workday Chargify LogiSense Piano.io Zone & Co. Cheddar NitroBox RecVue Zuora LICENSED REPRINT - REPORDUCED BY PERMISSION