1. Online flooding monitoring in packed towers using EDPCA method
WANG Wenwen, CAO Zewen, GAO Zengliang, LIU Yi*
Engineering Research Center of Process Equipment and Remanufacturing, Ministry of Education,
Institute of Process Equipment and Control Engineering, Zhejiang University of Technology, Hangzhou, 310014, PR China
Abstract: Traditional flooding monitoring methods have been found insufficient to monitor various types of industrial
packed towers. In this work, an enhanced data-driven monitoring method, i.e., enhanced dynamic principal component
analysis (EDPCA), is proposed for online flooding monitoring in packed towers. The operation data samples are first
clustered into several classes using the fuzzy c-means clustering approach. Then, several single DPCA models are trained
with each subset. Furthermore, the Bayesian inference is adopted to integrate these single DPCA models. The obtained
results for online flooding monitoring of an air-water packed tower demonstrate that EDPCA can obtain better and more
reliable performance, compared with the DPCA method.
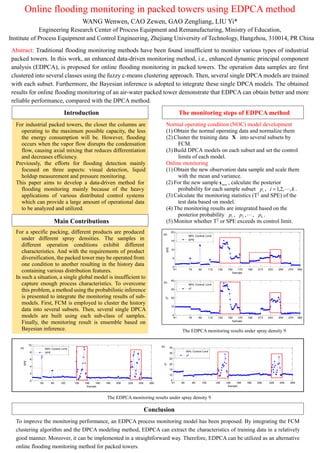
The EDPCA monitoring results under spray density 9
The EDPCA monitoring results under spray density 9
For industrial packed towers, the closer the columns are
operating to the maximum possible capacity, the less
the energy consumption will be. However, flooding
occurs when the vapor flow disrupts the condensation
flow, causing axial mixing that reduces differentiation
and decreases efficiency.
Previously, the efforts for flooding detection mainly
focused on three aspects: visual detection, liquid
holdup measurement and pressure monitoring.
This paper aims to develop a data-driven method for
flooding monitoring mainly because of the heavy
applications of various distributed control systems
which can provide a large amount of operational data
to be analyzed and utilized.
For a specific packing, different products are produced
under different spray densities. The samples in
different operation conditions exhibit different
characteristics. And with the requirements of product
diversification, the packed tower may be operated from
one condition to another resulting in the history data
containing various distribution features.
In such a situation, a single global model is insufficient to
capture enough process characteristics. To overcome
this problem, a method using the probabilistic inference
is presented to integrate the monitoring results of sub-
models. First, FCM is employed to cluster the history
data into several subsets. Then, several single DPCA
models are built using each sub-class of samples.
Finally, the monitoring result is ensemble based on
Bayesian inference.
To improve the monitoring performance, an EDPCA process monitoring model has been proposed. By integrating the FCM
clustering algorithm and the DPCA modeling method, EDPCA can extract the characteristics of training data in a relatively
good manner. Moreover, it can be implemented in a straightforward way. Therefore, EDPCA can be utilized as an alternative
online flooding monitoring method for packed towers.
Normal operating condition (NOC) model development
(1) Obtain the normal operating data and normalize them
(2) Cluster the training data X into several subsets by
FCM.
(3) Build DPCA models on each subset and set the control
limits of each model.
Online monitoring
(1) Obtain the new observation data sample and scale them
with the mean and variance.
(2) For the new sample newx , calculate the posterior
probability for each sample subset ip , ki ,,2,1 .
(3) Calculate the monitoring statistics (T2
and SPE) of the
test data based on model.
(4) The monitoring results are integrated based on the
posterior probability 1p , 2p , , kp .
(5) Monitor whether T2
or SPE exceeds its control limit.
41 72 92 112 132 152 172 192 213 233 254 274 292
0
5
10
15
20
Sample
SPE
99% Control Limit
SPE
41 72 92 112 132 152 172 192 213 233 254 274 292
0
10
20
30
40
Sample
T2
99% Control Limit
T2
(b)
(a)
60 80 100 126 146 166 186 206 229 249 269
0
2
4
6
8
10
Sample
SPE
99% Control Limit
SPE
41 60 80 100 126 146 166 186 206 229 249 269
5
10
15
20
25
30
35
Sample
T2
99% Control Limit
T2
(b)
(a)
60 80 100 126 146 166 186 206 229 249 269
0
2
4
6
8
10
Sample
SPE
99% Control Limit
SPE
41 60 80 100 126 146 166 186 206 229 249 269
5
10
15
20
25
30
35
Sample
T2
99% Control Limit
T2
(b)
(a)
Introduction The monitoring steps of EDPCA method
Conclusion
Main Contributions