Journal of Environmental & Earth Sciences | Vol.4, Iss.2 October 2022
2012Jang&Straus
1. The Indian Monsoon Circulation Response to El Nin˜o Diabatic Heating
YOUKYOUNG JANG
Center for Ocean–Land–Atmosphere Studies, Calverton, Maryland
DAVID M. STRAUS
Department of Atmospheric, Oceanic, and Earth Sciences, George Mason University, Fairfax, and Center for
Ocean–Land–Atmosphere Studies, Calverton, Maryland
(Manuscript received 31 October 2011, in final form 23 April 2012)
ABSTRACT
The response of the boreal summer mean tropical circulation to anomalies in diabatic heating during the
strong El Nin˜o events of 1972, 1987, and 1997 is studied, with particular focus on the Indian region. In ex-
periments with the atmospheric general circulation model of the National Center for Atmospheric Research,
anomalous diabatic heating fields are added to the full temperature tendency of the Community Atmosphere
Model, version 3 (CAM3). The boundary conditions are specified climatological sea surface temperatures
everywhere but over the Indian and western Pacific Oceans, where a slab-ocean model is used. The vertical
structure of the added heating is idealized with a single maximum at 600 hPa. The added heating in the
experiments was chosen on the basis of the 1972, 1987, and 1997 diabatic heating anomalies in the Pacific and
Indian Oceans diagnosed from reanalyses. Integrations extended from May to August with 20 different initial
conditions. The 1972 and 1987 experiments produced an anomalous anticyclonic circulation extending
westward toward the Indian region, accompanied by negative total (added plus CAM3 produced) diabatic
heating anomalies over India. A similar result was obtained for 1997 when only the Pacific Ocean diabatic
heating was added. The heating over the central Pacific is shown to be more important than the western Pacific
cooling. When the added heating also took into account anomalies over the Indian Ocean, the anomalous
anticyclonic circulation weakens, while the total Indian heating anomaly is quite small. These results suggest
the importance of the Indian Ocean heating for the 1997 monsoon circulation, but do not constitute a com-
plete explanation since the Indian Ocean heating was given a priori.
1. Introduction
The El Nin˜o–Southern Oscillation (ENSO) phenom-
enon is known to exert the single most important external
forcing for the Indian summer monsoon (ISM) rainfall
(Kumar et al. 1999; Lau and Nath 2000; Wang et al. 2003).
The configuration of anomalously high pressure over the
western Pacific–eastern Indian Ocean, and anomalously
low pressure over the eastern/central Pacific associated
with a El Nin˜o event changes the tropical circulation
significantly (Kumar et al. 1999; Palmer et al. 1992). In
particular, ENSO changes both the rotational and di-
vergent components of the seasonal mean flow; the ac-
companying changes in the vertical motion field affect
rainfall over the Indian region. This anomalous circula-
tion mediates a negative relationship between eastern
Pacific sea surface temperature (SST) associated with
ENSO and the ISM. This relationship has led to ENSO
being used as an important predictor in the statistical
seasonal prediction of the Indian summer monsoon by
Shukla and Paolino (1983) and Sahai et al. (2003). How-
ever, in recent years ENSO has seemingly lost its impact
on the Indian summer monsoon (Kumar et al. 1999;
Kripalani and Kulkarni 1997; Kirtman and Shukla 2000).
For example, the strong El Nin˜o in 1997 was accompa-
nied by a normal monsoon, not a drought as expected.
In this paper, we focus on the monsoon circulation
rather than the monsoon rainfall. Such an emphasis is
motivated by the work of Straus and Krishnamurthy
(2007), who found a higher interannual correlation
between atmospheric circulation and ENSO-related
SST than that between ISM rainfall and SST. The pur-
pose of this study is to understand the ENSO–monsoon
Corresponding author address: Youkyoung Jang, Center for
Ocean–Land–Atmosphere Studies, 4041 Powder Mill Rd., Suite
302, Calverton, MD 20705.
E-mail: yjang@cola.iges.org
1 NOVEMBER 2012 J A N G A N D S T R A U S 7487
DOI: 10.1175/JCLI-D-11-00637.1
Ó 2012 American Meteorological Society
2. relationship in terms of the rotational and divergent
components and accompanying vertical motion, and also
to focus on the circulation response to ENSO induced
diabatic anomalies. Past studies of the ENSO–monsoon
relationship have generally followed one of two ap-
proaches. In one approach, anomalous tropical SST is
used as a boundary forcing (Charney and Shukla 1981)
in a full atmosphere general circulation model (GCM;
Wang et al. 2000; Lau and Nath 2000; Ju and Slingo 1995).
Ashok et al. (2004), Kucharski et al. (2007), and Su et al.
(2001) distinguished the atmosphere GCM response to
the SST pattern in the 1997 event from the response to
SST patterns for past El Nin˜os, which were associated
with a dry monsoon. However, in a full atmospheric
GCM, the diabatic heating in the tropics may not respond
realistically to the prescribed SST anomalies. Evidence
for this is the generally poor mean monsoon simulation in
many atmospheric GCMs (Palmer et al. 1992; Wu and
Kirtman 2005). This difficulty is presumably related to the
properties of the convective parameterization. A second
approach has been to use an idealized atmospheric GCM
(AGCM) with specified diabatic heating as the forcing
(Lin 2009; Jin and Hoskins 1995). In this method, one has
complete control over the diabatic heating, but cannot
include any feedbacks associated with secondary con-
vective responses to the forced circulation.
We use anomalous diabatic heating to force a full
AGCM in order to incorporate the effect of ENSO,
rather than relying on the SST. This approach (similar to
that of Meehl et al. 2008) circumvents the model un-
certainty in diabatic heating response to SST. We modify
an existing GCM by adding a relatively small diabatic
heating with a vertically idealized structure. The idea is to
specify changes in the diabatic heating, yet retain the full
feedback of the dynamics on the heating in the context of
the full model. For example, the rising motion induced by
added heating will influence the model’s circulation,
which in turn can further change the moist and radiative
heating fields produced by the models parameterizations.
These second-order, or induced, changes are referred to
as the ‘‘GCM effect’’ (or coupled dynamical convective
response). In reality, cumulus convection (diabatic heat-
ing in the model) is coupled with the circulation and can
interact with the large-scale dynamics (Watanabe and Jin
2003; Annamalai 2010). Because of the interaction of the
diabatic heating with the atmospheric circulation, the
specified diabatic heating in this study may not lead to
a full understanding of the complexity of the system, but
specifying the forced diabatic heating in the model is a
first step to understand the relationship between diabatic
heating and the monsoon circulation.
To understand under what conditions diabatic heating
related to El Nin˜os leads to a dry monsoon, we perform
experiments in which heating/cooling with realistic geo-
graphical structure is inserted. The inserted heating is
designed so that the total heating, consisting of the in-
serted heating and the GCM response, matches observed
estimates for several ENSO warm events. We include
additional heating over the Pacific and Indian Oceans,
both together in a full experiment, and separately in
sensitivity experiments.
Data used in this study are described in section 2. The
characteristics of the observed diabatic heating and wind
during strong El Nin˜os are shown in section 3. The ex-
periments of this study are explained in section 4. The
responses to the observed forcing for the three strongest
El Nin˜o events based on the Nin˜o-3.4 index (1997, 1987,
and 1972, see Table 1) are shown in section 5 and 6,
respectively.
2. Data
We use several observational and diagnosed quantities
including precipitation, winds, streamfunction, velocity
potential, and diabatic heating at levels extending from
the surface to 100 hPa. The precipitation product is from
the National Oceanic and Atmospheric Administration
(NOAA) Climate Prediction Center (CPC) Merged
Analysis of precipitation (CMAP; Xie and Arkin 1997).
The wind data come from the 40-yr European Centre
for Medium-Range Weather Forecasts (ECMWF) Re-
Analysis (ERA-40) data. The streamfunction, velocity
potential, rotational wind, and divergent wind are cal-
culated from the wind data. The diabatic heating data
are diagnosed from the ERA-40 data (Chan and Nigam
2009). All datasets are monthly and for analysis we use
a summer mean from May through August. This summer
mean aligns with the summer simulations (May–August)
of this study. The ERA-40 data extend from 1957 to mid-
2002 and the Indian Monsoon Rainfall (IMR) data ex-
tend from 1871 to 2007. The period that we use here is
from 1957 to 2001. The SST data are NOAA optimum
interpolation (OI) sea surface temperature (Reynolds
TABLE 1. El Nin˜o year and monsoon strength in order of its
strength.
Year Nin˜o-3.4 index (JJA) IMR (JJA)
1997 1.7 Normal
1987 1.5 Dry monsoon
1972 1.1 Dry monsoon
1965 1.0 Dry monsoon
1991 1.0 Weak dry monsoon
1982 0.8 Dry monsoon
1963 0.7 Normal
1994 0.5 Wet monsoon
7488 J O U R N A L O F C L I M A T E VOLUME 25
3. et al. 2002) and the monthly OI SST data cover from 1854
to 2005.
The three-dimensional diabatic heating (Chan and
Nigam 2009; Nigam et al. 2000) is diagnosed as a residual
in the thermodynamic equation using the analyzed ver-
tical velocity [quasi-diabatic heating (QDB)]. In this
study, this diagnosed diabatic heating (Chan and Nigam
data), particularly for ENSO, is used to guide our choice
of patterns for the inserted forcing in our experiments.
3. Diabatic heating and wind during El Nin˜o
The characteristics of observed mean SST, QDB, and
wind anomalies during El Nin˜os are shown as a composite
in Fig. 1. [The years chosen for the composite—1963,
1965, 1972, 1982, 1987, 1991, 1994, and 1997—were the
years with the largest values of the Nin˜o-3.4 index for
summer May–August (MJJA) during the period of 1957–
2001. See Table 1.] Both SST and diabatic heating show
positive anomalies over the central Pacific (Figs. 1a,b).
Weak negative SST anomalies appear over the western
Pacific (Fig. 1a), although the negative anomalies of the
diabatic heating over the western Pacific (Fig. 1b) have
comparable magnitudes to the positive anomalies over
the central Pacific.
The anomalous divergent circulation related to ENSO
is shown in terms of the velocity potential (x) and di-
vergent wind at 200 hPa in Fig. 1c. Anomalous upper-
level convergent wind and positive velocity potential
anomalies over the western Pacific and eastern Indian
Ocean imply downward motion, while divergent wind
and negative velocity potential anomalies over the cen-
tral Pacific imply upward motion. The local circulation
signal over India itself consisting of positive upper-level
velocity potential anomalies and lower-level easterlies
over the Arabian Sea is quite weak, although consistent
with suppressed convection. This is consistent with the
fact that four of the eight years in the composite had near-
or above-normal IMR (see Fig. 2), and the average IMR
anomaly, while negative, is weak (see Table 2).
Although the anomalous streamfunction and rota-
tional wind at 850 hPa show significant anomalies over
the southern Indian Ocean and Pacific in the El Nin˜o
composite (in Fig. 1d), weak anomalous anticyclonic
circulations extend from the western Pacific to the Indian
region. A pair of anomalous cyclonic circulations appears
over the central Pacific. These anomalous circulations
correspond to the Rossby and Kelvin wave responses in
the simple model of Gill (1980). In the composite maps
shown here, the influence of El Nin˜o on India does not
seem significant, as noted above. However, for those El
Nin˜o years in which a significantly weak monsoon (low
IMR) occurs, the anomalous atmospheric circulation
becomes important. During the northern summer at
850 hPa, strong climatological southwesterlies over the
Arabian Sea provide moisture to India (Fig. 3b). The
anomalous anticyclonic circulation near India during
El Nin˜o shown in Fig. 1d weakens the southern part
of the southwesterly circulation, but strengthens the
northern part of the southwesterly. As a consequence,
the anomalous anticyclonic circulation influences the
Indian monsoon.
For individual warm events Slingo and Annamalai
(2000) suggested that a small shift in the locations of
sinking motion during ENSO might lead to a modifica-
tion of the Indian monsoon response. The El Nin˜o
composites include both dry and normal (or wet) mon-
soon years and show only a weak influence on the cir-
culation over India. However, as Slingo and Annamalai
(2000) mentioned, among the strongest three events in
terms of the Nin˜o-3.4 index (1972, 1987, and 1997), two
events (1972 and 1987) show a very distinct velocity
potential and convergent wind from the composite and
also show a strong negative IMR value (see Fig. 2). The
strongest event in terms of Nin˜o-3.4 value is 1997, but
the corresponding value of IMR is weak and positive.
During the 1972 and 1987 events positive velocity po-
tential and convergent wind anomalies appear over both
the western Pacific and the Indian region (Figs. 4a,b).
These anomalies imply the extension of the anomalous
downward motion over India, consistent with a sup-
pression of monsoon convection and the observed weak
monsoon rainfall for both 1972 and 1987. During the
1997 event, while there is strong convergence center
over the eastern Indian Ocean and western Pacific, over
the Indian region there is relatively weak convergence
without the center of convergence (Fig. 4c). So the weak
convergence over India in 1997 is more similar to the
composite than anomalous convergence in the 1972 and
1987 cases.
The streamfunction and rotational wind fields also
show differences in the 1972 and 1987 El Nin˜o events
(Fig. 5) compared to the composite (Fig. 1d). The 1987
event has strong anomalous easterlies over the Indian
region and Arabian Sea (Fig. 5b), opposing the climato-
logical monsoon flow (Fig. 3b). These anomalies are
consistent with the weak monsoon during the 1987 event.
During the 1997 case (Fig. 5c), the anomalous anticy-
clonic circulation is relatively small compared to the 1987
case and the anomalous easterlies over Indian are rela-
tively weak, which is close to the composite (Fig. 1d).
In the 1972 case (Fig. 5a), the anomalous anticyclonic
circulation is located slightly off the Indian region. Al-
though the mean velocity potential and divergent winds
in Fig. 1c are weak over the Indian region, in 1972 the
anomalous velocity potential and divergent winds imply
1 NOVEMBER 2012 J A N G A N D S T R A U S 7489
4. downward motion over the Indian region. It is possible
that for the 1972 case the downward motions play a
major role in weakening the monsoon without accom-
panying anomalous easterlies opposing the monsoon
flow.
The SST anomalies for the three events are shown in
Fig. 6. Over the western (eastern) Pacific negative (pos-
itive) anomalies appear in all cases. It is possible that the
negative SST anomalies in the western Pacific may be an
important direct cause of the anomalous anticyclonic
FIG. 1. Observed El Nin˜o composite during its development (May–August seasonal means)
see text for explanation of composite. (a) SST anomalies (K). (b) Diabatic heating anomalies
vertically integrated from the surface to 100 hPa (W m22
). Shading is 5% significant in (a) and
(b). (c) Velocity potential (shading and contour, x 3 106
m2
s21
) and divergent wind (vector,
m s21
) anomalies at 200 hPa. (d) Streamfunction (shading and contour, C 3 106
s21
) and
rotational wind (vector, m s21
) anomalies at 850 hPa. In (c) and (d), only 5% significant values
are plotted.
7490 J O U R N A L O F C L I M A T E VOLUME 25
5. circulations over the Indian region. In the following sec-
tion, the response to anomalous diabatic heating over
only the western Pacific is examined.
Wide regions of positive SST anomalies over 0.58C are
seen in the Indian Ocean during 1987 and to some extent
during 1972, but not during 1997. Yet the corresponding
diabatic heating (shown in Fig. 7) indicates substantial
and widespread positive anomalies only for 1997. There
does not seem to be a direct correspondence between
SST and heating anomalies over the Indian Ocean during
the period used in this paper. Gadgil et al. (2004) suggest
that enhanced convection (negative outgoing longwave
radiation anomalies) representing the Indian Ocean di-
pole (IOD) is closely related to the Indian monsoon and
its atmospheric circulation during the 1997/98 event.
Ashok et al. (2004) present AGCM experiments in which
IOD-related Indian Ocean SST anomalies reduce the
influence of ENSO-related SST on the Indian monsoon.
However, the IOD-composite SSTs they used are based
on months that do not include any of the months shown in
Fig. 6. The presence of an Indian Ocean heating anomaly
in the absence of an underlying SST anomaly suggests
a remote cause. In this paper, the remote cause is not
studied but the Indian Ocean warming is emphasized in
the experiment section.
The precipitation over India (IMR) for the eight years
is listed in Table 2, and three strongest years (1972, 1987,
and 1997) are consistent with the maps of anomalous
diabatic heating (Fig. 7). The dry monsoon years of 1972
and 1987 have rainfall well below one standard de-
viation below the mean, whereas the 1997 IMR is slighly
above normal but within one standard deviation.
4. Experiments
a. Model
The National Center for Atmospheric Research
(NCAR) Community Atmosphere Model, version 3
(CAM3) will be used for the AGCM. The standard
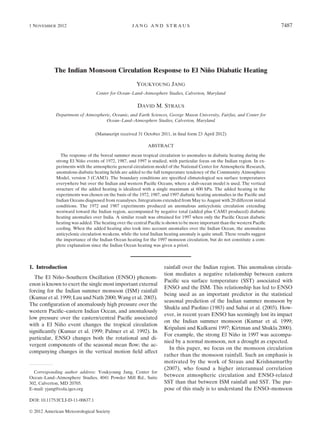
FIG. 2. A scatterplot of the anomalies of the Nin˜o-3.4 index (ordinate) vs the IMR anomalies
(abscissa) for 8 El Nin˜o years during summer. The years are 1963, 1965, 1972, 1982, 1987, 1991,
1994, and 1997. The two gray lines indicate 61 standard deviation of the IMR.
TABLE 2. Seasonal mean (JJAS) of Indian Monsoon Rainfall
(mm day21
) (1871–2010).
Mean 7.0
Std dev 0.68
El Nin˜o mean 6.42
Dry monsoon Normal or wet monsoon
1965 5.81 1963 7.03
1972 5.35 1991 6.44
1982 6.03 1994 7.80 (wet)
1987 5.71 1997 7.14
1 NOVEMBER 2012 J A N G A N D S T R A U S 7491
6. version, used here, has 26 vertical levels and a 42-
wave triangular spectral truncation. The formulation
of the physics and dynamics of CAM3 is detailed by
Collins et al. (2006). A spectral Eulerian formulation is
used to resolve dynamical motions along with a semi-
Lagrangian transport scheme for dealing with large-
scale transport of water and chemical species. CAM3
also includes the Community Land Model (CLM) version
3.0 for the treatment of land surface energy exchanges.
CLM3 is integrated on the same horizontal grid as
CAM3.
A slab-ocean model (SOM) will be used for regional
air–sea coupling. The ocean model coupled to the
AGCM will be a simple thermodynamic slab mixed layer
model, which is a part of the NCAR CAM3 modeling
system. The depth of the mixed layer is fixed to a clima-
tological annual cycle with a 200-m cap. At each grid
point, the AGCM supplies heat flux to the ocean model,
and the ocean model returns SST to the AGCM. The
SST evolves according to the heat flux given by the
AGCM. The coupling will be allowed in only the Indian
Ocean and western Pacific (308S–208N, 608–1508E). In
the other ocean basins, prescribed climatologically vary-
ing monthly SST were used as a boundary condition of
the AGCM.
In the tropical central and eastern Pacific, the SST
forcing is very strong and we expect that SSTs mainly
influence the atmosphere (Lau and Nath 2000, 2003). On
the other hand, for the Indian monsoon region, the ex-
periments of Wu and Kirtman (2005) and Fu and Wang
(2002) showed that inclusion of regional air–sea coupling
over the Asian monsoon region improved the simulation
of the variability of the Asian monsoon rainfall. Wang
et al. (2003) and Wang et al. (2005) also stressed the
importance of air–sea interaction, particularly of the heat
flux exchange for the monsoon region. These studies
motivated the inclusion of the regional air–sea interaction
in the western Pacific and Indian Ocean. In the extra-
tropics where SSTs are relatively cold, the atmosphere
forces the ocean (Lau and Nath 1994). However, in this
study, the main interest is the impact of tropical heating
on the Indian region, so in order to avoid a complexity in
the extratropics the prescribed SST is used.
b. Control run
A control simulation of 21-yr length is run. The con-
trol simulation uses prescribed, climatologically varying
SSTs outside the Indian and western Pacific oceans, but
is coupled to the SOM in the Indian and western Pacific
Oceans (308S–208N, 608–1508E); this simulation is called
the SOM control run. The prescribed SST has only a
climatological annual cycle, so that the effect of inter-
annual variability of the Pacific SST field is not in-
troduced. The SOM control runs will be compared with
the forcing experiments in which ENSO-related effects
will be introduced through the structure of the added
FIG. 3. Climatological summer mean (May–August). (a) Velocity potential (shading and
contour, x 3 106
m2
s21
) and divergent wind (vector, m s21
) at 200 hPa. (b) Streamfunction
(shading and contour, C 3 106
s21
) and rotational wind (vector, m s21
) at 850 hPa.
7492 J O U R N A L O F C L I M A T E VOLUME 25
7. heating. These forced experiments also incorporate the
regional SOM.
c. Forced run
We modified CAM3.0 by adding relatively small dia-
batic heating fields with an idealized vertical structure.
In this method, heating with an idealized vertical profile
is added to the temperature tendencies in the GCM.
(The heating profile is discussed in the appendix.) The
horizontal structure of the added heating was guided by
the diagnosed heating anomalies of Chan and Nigam
(2009) shown in Fig. 7. In particular, the added heating
(shown in Fig. 8) was designed so that the total diabatic
heating anomalies (sum of added heating and the CAM
generated heating) agrees with Fig. 7. (This involved
some trial and error.) For the 1997 case first, three types
of forcing are used: 1) forcing A: cooling over the
tropical western Pacific and heating over the tropical
central/eastern Pacific (Fig. 8c), 2) forcing B: heating
over the tropical Indian Ocean (Fig. 8d), and 3) forcing
A plus forcing B (Fig. 8e). In addition, experiments for
separating diabatic heating over the central/eastern
and western Pacific (from forcing A) are done.
The effect of ENSO-related diabatic heating in the
Pacific Ocean is modeled in this paper by adding the
diagnosed heating anomalies in this region rather than
by specifying the observed SST field for El Nin˜o events
in order that the difficulties with the GCM convective
parameterizations (incorrect response to SST) may be
avoided. However, the case of the 1997 monsoon presents
a challenge. The diabatic heating anomaly diagnosed for
that year shows substantial heating in the western equa-
torial Indian Ocean (from 108–808E, as shown in Fig. 7),
heating that is larger than in the other two strong El Nin˜o
events, and not related in any obvious way to the SST
anomaly. Yet that heating anomaly cannot be reproduced
either by running the GCM with observed SSTs or by
adding the observed Pacific Ocean heating as in this
FIG. 4. Anomalous seasonal mean (May–August) velocity potential (shading and contour,
x 3 106
m2
s21
) and divergent wind (vectors, m s21
) at 200 hPa from ERA-40 reanalysis:
(a) 1972 warm event, (b) 1987 warm event, and (c) 1997 warm event.
1 NOVEMBER 2012 J A N G A N D S T R A U S 7493
8. paper. To understand if this Indian Ocean is relevant to
the unusual character of the 1997 Indian monsoon, we
have run experiments with the Indian Ocean heating
specified (forcing B in Fig. 8d and forcing C in Fig. 8e).
While this procedure does not shed light on the cause of
the Indian Ocean heating anomaly, it will at least deter-
mine whether the anomaly played a role in determining
the IMR in 1997.
For each of forced experiments (Fig. 8), 20 seasonal
integrations (May–August) were performed using the 20
initial conditions from 1 May from each year of the
control simulations. The runs are initialized in May and
run through August only because of computer time
constraints. Our MJJA average includes the full onset of
the monsoon (which can be as early as late May in Sri
Lanka), but not the monsoon withdrawal (which occurs
in September and even October). We have computed
the sensitivity to removing the month of May from the
average and it is not large. The 20-run ensemble average
of the May–August seasonal means is compared to the
corresponding ensemble seasonal mean from the con-
trol simulation. In the analysis, the response to each
forcing is calculated as the ensemble time mean differ-
ence (forced experiments minus control). In particular,
this ensemble procedure is expected to reduce the effect
of midlatitude disturbances and in general, internal
variability; and we can expect the ensemble mean model
response to be dominated by forced waves from tropical
heating or cooling. However, there is one caveat to this
interpretation of the model results: while the added
heating is the same in each of the 20 integrations, the
changes in the AGCM’s own diabatic heating induced
by the additional forcing (called the GCM effect, as
explained before), will not necessarily be the same in
each of the 20 integrations. The role of internal variability
is taken into account in a simple way through the use of
the t statistic to assess the difference in all ensemble
seasonal means shown.
FIG. 5. Anomalous seasonal mean (May–August) streamfunction (shading and contour, C 3
106
s21
) and rotational wind (vector, m s21
) at 850 hPa from ERA-40 reanalysis: (a) 1972 warm
event, (b) 1987 warm event, and (c) 1997 warm event.
7494 J O U R N A L O F C L I M A T E VOLUME 25
9. 5. 1987/1972 forced experiment
The responses of diabatic heating, the total heating,
and precipitation in Figs. 9a–c to the 1987 forcing in
Fig. 8a show modest but statistically significant nega-
tive anomalies over the Indian region. The experiment
with the diagnosed diabatic heating for 1972 summer
shows responses (Fig. 10) that are very similar to the
1987 experiment. Recall that the response of the dia-
batic heating (shown in Fig. 9a) is the additional dia-
batic heating in the model generated by the coupled
dynamical convective response. Over the forcing re-
gion in the western Pacific, negative anomalies in the
heating response are seen while over the central and
eastern Pacific positive heating response anomalies are
seen. These anomalies strengthen the total diabatic
heating in the model shown in Fig. 9b (cf. Fig. 7b). One
manifest thing in terms of this strengthening is the strong
negative anomalies near the Sumatra coast. In Fig. 7b, the
diagnosed diabatic heating is about 50–100 W m22
, and
while relatively weak forcing is inserted in the model, the
model responds strongly near the Sumatra coast.
The responses of the streamfunction and rotational
wind at 850 hPa are shown in Figs. 9d and 10d. One pair
of anomalous anticyclonic circulations (Rossby response)
appears to the west of the negative diabatic heating over
the western Pacific. The anticyclonic circulation in the
Northern Hemisphere extends toward the Indian re-
gion; anomalous easterlies over the Arabian Sea (a part
of this anticyclonic circulation) oppose the monsoon flow.
However, in Fig. 5a, the observed anticyclonic circulation
in 1972 is not strong and does not cover all of India. So the
1972 forced experiment does not simulate the proper
anticyclonic circulation, but in terms of velocity potential
and convergent winds at 200 hPa (Figs. 9e and 10e) it is
consistent with observed convergences in 1972 and 1987
in Figs. 4a,b that show a convergence center over the
Indian region. These anomalous easterlies and upper-
level convergence implying descending motion both tend
to weaken the monsoon. Therefore, anomalous diabatic
FIG. 6. Anomalous seasonal mean (May–August) SST (8C) from observations (see text for
details): (a) 1972 warm event, (b) 1987 warm event, and (c) 1997 warm event.
1 NOVEMBER 2012 J A N G A N D S T R A U S 7495
10. heating related to ENSO (1987 and 1972 forcing) is
seen to generate anomalous atmospheric circulation
extending toward the Indian region and weakening the
Indian monsoon. Because of its weak anticyclonic cir-
culation in 1972, the anomalous downward motion over
India may have the dominant impact on weakening the
monsoon.
6. 1997 forced experiment
In this section, the forcings in Figs. 8c–e are used to
understand the monsoon response to the strong 1997 El
Nin˜o. We first consider the experiment in which the
added heating consisted of cooling over the western
Pacific and heating over the central/eastern Pacific (forc-
ing A in Fig. 8c). The response of the diabatic heating
(GCM effect) to this forcing (forcing A) is shown in
Fig. 11a. The response is strong over the western Pacific
and central/eastern Pacific, which we consider to be the
direct response to the forcing. There are also additional
responses such as anomalous cooling in the eastern
Pacific, which is also seen in the observed diabatic heating
(Fig. 11, top). The forcing and response are combined to
form the total diabatic heating in the model. Although
the positive response over the equatorial eastern Pacific
is relatively weak in Fig. 11a, the total diabatic heating
(Fig. 11e) has comparable magnitude to the observed
diabatic heating (Fig. 11, top) because the inserted
heating has almost the same magnitude as the observed
heating. In terms of the Indian monsoon, the Pacific
forcing (forcing A) simulates negative anomalies of the
diabatic heating (Fig. 11a) and negative precipitation
(Fig. 12a) over India. This result is consistent with that
of the 1987 experiment.
The anomalous diabatic heating in Fig. 11 (top) is
strong and well developed over the central Pacific, but the
observations in 1997 show no diabatic heating anomalies
and normal precipitation over India [Fig. 11 (top) and
FIG. 7. Vertically integrated anomalous seasonal mean (May–August) diabatic heating (W m22
) estimated from reanalysis (see text for
details): (a) 1972 warm event, (b) 1987 warm event, and (c) 1997 warm event. (a-1),(b-1),(c-1) As in (a),(b),(c), but with a smaller contour
interval (shown only over the Indian region).
7496 J O U R N A L O F C L I M A T E VOLUME 25
11. Table 2]. In the model, heating over the Indian Ocean is
added to the Pacific heating fields in the second experi-
ment of the 1997/98 event (Forcing C in Fig. 8e). [A
similar 1997 experiment with the Indian Ocean warming
has also been carried out by Ashok et al. (2004) and Su
et al. (2001), but in an AGCM with SST forcing.] The
inclusion of the Indian Ocean added heating leads to the
absence of any significant anomalies of diabatic heating
over India (Fig. 11d), and the response of precipitation
also does not show significant anomalies over India
(Fig. 12c). This is consistent with the observed diabatic
heating (Fig. 11, top) and the modest value of the Indian
Monsoon Rainfall (Table 2), which imply a normal
monsoon. The total diabatic heating over the equatorial
Indian Ocean, western Pacific, and central/eastern Pacific
in the model (Fig. 11h) also have comparable magni-
tudes with the observed ones. Therefore, the Indian
Ocean heating seems to be one crucial factor contributing
FIG. 8. Idealized heating (forcing) added for each experiment: (a) 1987 forcing, (b) Pacific
forcing only for 1997 experiment (forcing A), (c) the Indian Ocean forcing only (forcing B), and
(d) Pacific and Indian Ocean forcing (forcing C). Each forcing is vertically integrated; units are
(W m22
).
1 NOVEMBER 2012 J A N G A N D S T R A U S 7497
12. to the lack of the Indian monsoon drought in 1997.
However, this is only a first step; since we have not been
able to reproduce the Indian Ocean heating as a remote
response to Pacific SSTs, its origin is not clear. But we
have established that it seems to be relevant in explaining
the 1997 monsoon. Su et al. (2001) also found in their
simplified AGCM that warm SST over the Indian Ocean
contributes to the local enhanced rainfall, more so even
than the strong El Nin˜o warming in the eastern equatorial
Pacific. In addition, Annamalai and Liu (2005) argued
that the Indian Ocean should be included to understand
the ENSO–monsoon linkage in terms of prediction of
rainfall.
In this study, the focus is forced responses by anom-
alous diabatic heating and the anomalous Indian Ocean
heating is used as forcing. However, the cause of the
Indian Ocean heating (precipitation anomalies) is also
an important issue because it is possible that the mon-
soon circulation induced by external forcing can modify
the diabatic heating substantially. Experiments B and C
FIG. 9. Results of 1987 experiment (seasonal mean, May–August): (a) anomalous GCM
heating response (vertically integrated, W m22
), (b) total heating (GCM response plus forcing,
W m22
), (c) precipitation (mm day21
), (d) streamfunction (shading and contour, C 3 106
s21
)
and rotational wind (vector, m s21
) at 850 hPa, and (e) velocity potential (shading and contour,
x 3 106
m2
s21
) and divergent wind (vectors, m s21
) at 200 hPa. Only 5% significant values are
plotted.
7498 J O U R N A L O F C L I M A T E VOLUME 25
13. show only that there is a connection between Indian
Ocean heating and the monsoon rainfall.
It is also of interest to examine the response of the
atmospheric circulation to the Pacific and Indian Ocean
forcings. The Pacific forcing without the Indian Ocean
warming simulates a large anticyclonic circulation ex-
tending toward India and the western Indian Ocean as
shown in Fig. 13a. The response of rotational wind shows
strong easterlies extending from the equatorial western
Pacific across the western Indian Ocean, thus weakening
the climatological monsoon flow in Fig. 3b. On the other
hand, when the Indian Ocean warming is added to the
Pacific forcing, the easterlies to the south of India do
not extend to the western Indian Ocean (Fig. 13d). The
weakened and limited easterly anomalies and anticy-
clonic circulation are similar to the observed stream-
function and wind anomalies shown in Fig. 5c.
To further understand the role of the Indian Ocean
(IO) warming, the IO warming alone (forcing B in Fig. 8d)
is inserted in the model. In terms of rotational wind,
weak westerlies to the west of the heating (over the
equatorial Indian Ocean to the west of India) are shown
in Fig. 13b and the streamfunction at 1000 hPa shows one
weak cyclonic center of circulation to the west of India
(Fig. 13b-1). The westerlies to the west of India (Fig. 13b)
oppose the easterly anomalies forced by the Pacific forc-
ing over the equatorial Indian Ocean (a part of the anti-
cyclonic circulation seen in Fig. 13a).
FIG. 10. As in Fig. 9, but for 1972.
1 NOVEMBER 2012 J A N G A N D S T R A U S 7499
14. We also investigate the linear combination of the re-
sponse to the Pacific and IO forcing. The diabatic heating
response to forcings A and B are linearly added is shown
in Fig. 11c, with the corresponding total in Fig. 11g. The
sum of the streamfunction and rotational wind at 850 hPa
to the two forcings (Fig. 13c) shows weakened anticy-
clonic circulation over the Indian region compared to the
Pacific-only forcing case (Fig. 13a), but the magnitude of
FIG. 11. (top) Anomalous vertically integrated diabatic heating (W m22
; May–August mean) for 1997 estimated from ERA-40. The
vertically integrated diabatic heating response (W m22
) to each forcing: (a) Pacific forcing (forcing A), (b) IO warming (forcing B), (c)
linear combination of the two responses (forcing A and forcing B), and (d) Pacific forcing with IO forcing (forcing C). The sum of diabatic
heating response and forcing (vertically integrated) for each forcing: (e) Pacific forcing (forcing A), (f) IO warming (forcing B), (g) linear
combination of the two responses (forcing A and forcing B), and (h) Pacific forcing with IO forcing (forcing C). Only 5% significant values
are plotted in (a)–(h).
7500 J O U R N A L O F C L I M A T E VOLUME 25
15. streamfunction over the Indian Ocean (Fig. 13c) is
stronger than in the response to both Pacific and IO
forcings (Fig. 13d). There is clearly some nonlinear
compensation taking a place between the responses to
IO and Pacific added heating.
The velocity potential and divergent winds at 200 hPa
also show the changes in the anomalous divergent cir-
culation due to adding the IO warming (Fig. 14). When
the forcing is over only the Pacific, convergent wind with
positive velocity potential appears over the western
Pacific and Indian region, which weakens the monsoon
convection by anomalous downward motion (Fig. 14a).
However, when the IO warming is added, this conver-
gent wind and positive velocity potential (Fig. 14d) are
not centered in the Indian region; instead divergent wind
and negative velocity potential appear over the western
Indian Ocean implying anomalous ascending motion.
When only the IO warming is inserted (Fig. 14b), strong
divergent wind and negative velocity potential appear
over the western Indian Ocean. The linear combination
of the Pacific and IO warming (Fig. 14c) shows features
that are similar to the response of the Pacific forcing with
the IO warming (Fig. 14d). The observed velocity po-
tential and divergent wind during the 1997 event (Fig. 4c)
show similar features as well. Therefore, the anomalous
ascending motion by the IO warming weakens the anom-
alous descending motion over the Indian region, leading
to a lack of strong monsoon anomalies.
Additional experiments are done in order to measure
the effects of the heating over the western and eastern
Pacific separately (see forcing A in Fig. 8c). Figures 15
and 16 show the results of the western Pacific (WP) and
the central Pacific (CP) forcing, respectively. The WP
forcing alone induces the negative anomalies of diabatic
heating and precipitation near the Indian region and
anomalous anticyclonic circulation at 850 hPa in Fig. 15,
which is related to a weak Indian monsoon. However,
anomalous diabatic heating and precipitation are not
FIG. 12. Anomalous seasonal mean (May–August) precipitation response (mm day21
) in the three 1997 experiments: (a) Pacific forcing
(forcing A), (b) IO warming (forcing B), and (c) Pacific forcing with IO forcing (forcing C). Only 5% significant values are plotted. (a-1),
(b-1),(c-1) As in (a),(b),(c), but with a smaller contour interval (shown only over the Indian region).
1 NOVEMBER 2012 J A N G A N D S T R A U S 7501
16. strong as the results of the combined Pacific forcing
(forcing A) in Figs. 11a and 12a. At 200 hPa the anom-
alous divergent field related to downward motion also
does not appear in this experiment (Fig. 15e). On the
other hand, the CP forcing alone is more similar to the
results of the combined Pacific forcing. The anomalously
negative diabatic heating and precipitation over the In-
dian region in Figs. 16a,c show comparable strengths
compared with the results of the combined Pacific forc-
ing. The divergent field at 200 hPa and streamfunction at
850 hPa are also more similar to the results of the com-
bined Pacific forcing than the WP forcing alone. Thus,
considering only the Pacific forcing for 1997 case, the CP
forcing has a stronger influence on the Indian monsoon
than the WP forcing.
In this section, the 1997 experiment with the Pacific-
only forcing shows results similar to those of the 1987 and
1972 experiments seen in the previous section. However,
in the diabatic heating diagnosed from ERA-40, 1997
has a strong IO warm component comparable to the
FIG. 13. Seasonal mean (May–August) anomalies of streamfunction (shading and contour,
C 3 106
s21
) and rotational wind response (vector, m s21
) at 850 hPa to three 1997 experiments:
(a) Pacific forcing (forcing A), (b) IO warming (forcing B), (b-1) IO warming [streamfunction
and rotational wind at 1000 hPa only for (b-1)], (c) linear combination of two response (forcing
A and forcing B), and (d) Pacific forcing with IO forcing (forcing C). Only 5% significant values
are plotted.
7502 J O U R N A L O F C L I M A T E VOLUME 25
17. anomalous diabatic heating over the western Pacific
and eastern Pacific. By adding the IO warming to the
Pacific additional heating we find that the GCM response
of diabatic heating indicates a normal monsoon. The
streamfunction and velocity potential also show circula-
tion consistent with the normal monsoon. In terms of the
atmospheric response, therefore, it is concluded that the
Indian Ocean warming plays a role in modifying the in-
fluence of ENSO on the Indian monsoon.
7. Conclusions
To understand the relationship between ENSO and
the Indian summer monsoon, the atmospheric response
to the tropical diabatic heating is studied in a GCM.
Instead of traditional approaches, such as inserting SST
forcing in an AGCM, or specifying diabatic heating in
a simple idealized GCM, we modify an existing GCM
by adding a relatively small diabatic heating with an
FIG. 14. Seasonal mean (May–August) anomalies of velocity potential (shading and contour,
x 3 106 m2
s21
) and divergent wind response (vector, m s21
) to three 1997 experiments: (a)
Pacific forcing (forcing A), (b) IO warming (forcing B), (c) linear combination of two response
(forcing A and forcing B), and (d) Pacific forcing with IO forcing (forcing C). Only 5% sig-
nificant values are plotted.
1 NOVEMBER 2012 J A N G A N D S T R A U S 7503
18. idealized vertical structure. In this method, the anom-
alous circulation by added heating/cooling will in-
fluence the model’s circulation, which in turn further
changes diabatic heating fields (additional diabatic
heating) as the coupled dynamical-convective response
(GCM effect).
Although warm ENSO events lead to a characteristic
change in the tropical circulation, each ENSO event has
a different detailed spatial pattern. Diagnosed diabatic
heating data show that the 1997 event was accompanied
by a relatively strong heating anomaly over the Indian
Ocean. This anomaly is not manifest during other very
strong El Nin˜o events such as 1972 and 1987. The anom-
alous Indian Ocean heating cannot be reproduced either
by running the GCM with observed SSTs, or by adding
the observed Pacific Ocean heating as in this paper. So in
this study, the experiments were designed to understand
how those two distinct diabatic heatings produce as forc-
ing, the atmospheric circulation differently and how they
influence the Indian monsoon differently.
FIG. 15. Results of WP experiment (seasonal mean, May–August): (a) anomalous GCM
heating response (vertically integrated, W m22
), (b) total heating (GCM response plus forcing,
W m22
), (c) precipitation (mm day21
), (d) streamfunction (shading and contour, C 3 106
s21
)
and rotational wind (vector, m s21
) at 850 hPa, and (e) velocity potential (shading and contour,
x 3 106
m2
s21
) and divergent wind (vectors, m s21
) at 200 hPa. In (d) and (e), only 5% sig-
nificant values are plotted.
7504 J O U R N A L O F C L I M A T E VOLUME 25
19. The Pacific diabatic heating is used in the 1987, 1972,
and 1997 experiments. Negative diabatic heating over
the western Pacific and positive diabatic heating over
the central/eastern Pacific (consistent with estimates
from reanalysis for those years) induces a downward
motion branch over the extended Indian region and
this implies weakening of monsoon convection. More-
over, an anticyclonic circulation (Rossby response) to
the west of the western Pacific cooling is also manifest.
Anomalous easterlies as a part of this anticyclonic
circulation are opposed to the climatological monsoon
flow and tend to weaken the monsoon. Pillai and
Annamalai (2012) identified anticyclonic circulation re-
lated to these easterlies as the precursor signal over South
Asia that advects dry air to South Asia and leads to a dry
monsoon.
For the experiments for the 1997 case show that the
effect of the central Pacific heating dominates that of
the western Pacific cooling. In the 1997 experiment,
the additional Indian Ocean heating leads to a com-
pensation of this anticyclonic circulation. The Indian
Ocean heating, thus, tends to suppress the response
to the Pacific heating, leading to a normal monsoon
circulation.
In this study, the anomalous large-scale atmospheric
circulation induced by tropical heating is shown to be
a reasonable explanation of the relationship between El
Nin˜o and the Indian monsoon. However, for the 1972
FIG. 16. As in Fig. 15, but for the CP experiment.
1 NOVEMBER 2012 J A N G A N D S T R A U S 7505
20. warm event the anomalous anticyclonic circulation was
not strong enough to explain the observed weakening of
the monsoon. Only the downward branch induced by the
anomalous divergent circulation extending westward
into India was consistent with a dry monsoon. It is
possible that other important factors such as the boreal
summer intraseasonal oscillation (Krishnamurthy and
Shukla 2000) or land–atmospheric interaction could
have been important during 1972.
It should be pointed out that while our results suggest
the importance of the Indian Ocean heating for the 1997
monsoon circulation, they do not constitute a complete
explanation, since the Indian Ocean heating was given
a priori. In reality, this heating is also a product of the
large-scale circulation as well as possibly remote SSTs.
Acknowledgments. We are grateful for discussions
with Dr. J. Shukla. This work was supported by the
National Science Foundation (Grants ATM-0830062
and ATM-0830068), the National Oceanic and Atmo-
spheric Administration (Grant NA09 OAR4310058), the
National Aeronautics and Space Administration (Grant
NNX09AN50G) and the Office of Science (BER) of
the U.S. Department of Energy (Grant DE-FG02-
07ER64473). Computing support from the Climate
Simulation Laboratory of the National Center of Atmo-
spheric Research is also acknowledged.
TABLE A1. Standard values (hk) of midlevel pressure (Pa) for
hybrid coordinate system for CAM3.
Level K Pressure Level K Pressure
1 354.5 14 22 651.3
2 739.9 15 26 648.1
3 1396.7 16 31 350.1
4 2394.5 17 36 881.8
5 3723.0 18 43 389.5
6 5311.5 19 51 045.5
7 7005.9 20 60 052.4
8 8543.9 21 69 679.6
9 10 051.5 22 78 770.2
10 11 825.0 23 86 716.1
11 13 911.5 24 92 964.9
12 16 366.2 25 97 055.5
13 19 254.0 26 99 255.6
TABLE A2. Coefficients of Am and Bm, M 5 2; harmonic
coefficients correspond to heating of Eq. (A2).
m 5 1 m 5 2
Am 20.0418 20.0392
Bm 20.6917 20.3230
FIG. A1. Heating profiles derived by harmonic approximation. See the appendix for details.
Blue dots are from Eq. (A1) and red dots are from Eq. (A2).
7506 J O U R N A L O F C L I M A T E VOLUME 25
21. APPENDIX
Vertical Profile
Two types of idealized vertical structure are approxi-
mated and then they are compared with the observed
vertical structure to decide which one gives a better ap-
proximation to the observed structure. The vertical
structure of the perturbation is generated as follows. The
hybrid vertical coordinates are specified as input and the
corresponding midlayer pressures are calculated from
these assuming a fixed surface pressure of p0 5 1000 hPa.
We use a standard set of K 5 26 levels, with midlayer
pressure values hk as given in the Table A1.
For a profile to become very small at the bottom and
top of the model, we use this approximation:
^Fk ’ å
M
m51
Am cos
2p
mk
K
1 Bm sin
2p
mk
K
.
(A1)
The values of Am and Bm are given in Table A2 using
m 5 2. Equation (A1) is implemented in the CAM3
subroutine (dynamics and physics coupling module), in
which the full temperature tendency is available in
gridpoint configuration. The resulting profile is given by
the blue dots in Fig. A1.
To achieve a somewhat shallower profile, we modify
the formula in Eq. (1):
Fk 5 sin
p
hk
p0
2 0:3 sin
2p
hk
p0
2 0:1 sin
4p
hk
p0
.
(A2)
An extended heating is defined as above, and Fig. A1
shows this heating profile as the red dots.
To compare the two profiles with observed diabatic
heating, the vertical structure of anomalous diabatic
heating fields obtained from ERA-40 data by Chan and
Nigam (2009) is shown for El Nin˜o and La Nin˜a events in
Fig. A2. Two types of the vertical structures are shown:
those for a single grid point (2.58S, 1328E, solid lines with
closed circles for El Nin˜o) and one for spatially averaged
values (58S–28N, 1208–1408E, dashed lines for El Nin˜o).
In Fig. A1, the shallow vertical profiles show a maximum
at 600 mb and the deep profiles show the maximum at
about 450 mb. ERA-40 diabatic heating for both El Nin˜o
and La Nin˜a shows the maximum below 500 mb, al-
though each event has a somewhat different vertical
structure. In all the experiments in this paper, the shal-
lower profile (red dots in Fig. A1) is used for the vertical
structure.
Note that since we have assumed the surface pressure
equal to p0. The coordinate in Fig. A1 should really be
the model coordinate; the correspondence with pressure
is only valid if the true surface pressure is close to p0,
typically over the ocean.
REFERENCES
Annamalai, H., 2010: Moist dynamical linkage between the equa-
torial Indian Ocean and the South Asian monsoon trough.
J. Atmos. Sci., 67, 589–610.
——, and P. Liu, 2005: Response of the Asian monsoon to changes
in El Nin˜o properties. Quart. J. Roy. Meteor. Soc., 131, 805–831.
Ashok, K., Z. Guan, N. H. Saji, and T. Yamagata, 2004: Individual
and combined influences of ENSO and the Indian Ocean di-
pole on the Indian summer monsoon. J. Climate, 17, 3141–
3155.
Chan, S. C., and S. Nigam, 2009: Residual diagnosis of diabatic
heating from ERA-40 and NCEP reanalyses: Intercom-
parisons with TRMM. J. Climate, 22, 414–428.
Charney, J. G., and J. Shukla, 1981: Predictability of monsoons.
Monsoon Dynamics, J. Lighthill and R. P. Pearce, Eds.,
Cambridge University Press, 99–110.
FIG. A2. The vertical structure of ERA-40 diabatic heating rate
(K s21
). (a) For El Nin˜o events (1982, 1987, 1991, 1994, and 1997).
The solid lines with closed circles are at 2.58S, 1328E. The dashed
lines are averaged from 58S–28N to 1208–1408E. (b) For La Nin˜a
events (1988, 1998, and 1999). The solid lines with closed circles are
at 2.58S, 1378E for 1988 and at 2.58S, 1008E for 1998 and 1999. For
1988 the dashed lines are averaged from 58S–28N to 1308–1408E and
for 1998 and 1999 they are averaged from 58S–28N to 958–1058E.
1 NOVEMBER 2012 J A N G A N D S T R A U S 7507
22. Collins, W. D., and Coauthors, 2006: The formulation and atmo-
spheric simulation of the Community Atmosphere Model
version 3 (CAM3). J. Climate, 19, 2144–2161.
Fu, X., and B. Wang, 2002: Impacts of air–sea coupling on the
simulation of mean Asian summer monsoon in the ECHAM4
model. Mon. Wea. Rev., 130, 2889–2904.
Gadgil, S., P. N. Vinayachandra, P. A. Francis, and S. Gadgil, 2004:
Extremes of the Indian summer monsoon rainfall, ENSO and
equatorial Indian Ocean oscillation. Geophys. Res. Lett., 31,
L12213, doi:10.1029/2004GL019733.
Gill, A. E., 1980: Some simple solutions for heat-induced tropical
circulation. Quart. J. Roy. Meteor. Soc., 106, 447–462.
Jin, F., and B. J. Hoskins, 1995: The direct response to tropical
heating a baroclinic atmosphere. J. Atmos. Sci., 52, 307–319.
Ju, J., and J. M. Slingo, 1995: The Asian summer monsoon and
ENSO. Quart. J. Roy. Meteor. Soc., 121, 1133–1168.
Kirtman, B. P., and J. Shukla, 2000: Influence of the Indian
summer monsoon on ENSO. Quart. J. Roy. Meteor. Soc., 126,
213–239.
Kripalani, R. H., and A. Kulkarni, 1997: Climate impacts of El
Nin˜o/La Nin˜a on the Indian monsoon: A new perspective.
Weather, 52, 39–46.
Krishnamurthy, V., and J. Shukla, 2000: Intraseaonal and in-
terannual variability of rainfall over India. J. Climate, 13,
4366–4377.
Kucharski, F., A. Baracco, J. H. Yoo, and F. Molteni, 2007: Low-
frequency variability of the Indian monsoon–ENSO relation-
ship and the tropical Atlantic: The ‘‘weakening’’ of the 1980s
and 1990s. J. Climate, 20, 4255–4266.
Kumar, K. K., B. Rajagopalan, and M. A. Cane, 1999: On the
weakening relationship between the Indian monsoon and
ENSO. Science, 284, 2156–2159.
Lau, N. C., and M. J. Nath, 1994: A modeling study of the relative
roles of tropical and extratropical SST anomalies in the vari-
ability of the global atmosphere–ocean system. J. Climate, 7,
1184–1207.
——, and ——, 2000: Impact of ENSO on the variability of the
Asian–Australian monsoons as simulated in GCM experi-
ments. J. Climate, 13, 4287–4309.
——, and ——, 2003: Atmosphere–ocean variations in the Indo-
Pacific sector during ENSO episodes. J. Climate, 16, 3–20.
Lin, H., 2009: Global extratropical response to diabatic heating
variability of the Asian summer monsoon. J. Atmos. Sci., 66,
2697–2713.
Meehl, G. A., J. M. Arblaster, and G. Branstator, 2008: A coupled
air–sea response mechanism to solar forcing in the Pacific
region. J. Climate, 21, 2883–2897.
Nigam, S., C. Chung, and E. DeWeaver, 2000: ENSO diabatic
heating in ECMWF and NCEP reanalyses, and NCAR CCM3
simulation. J. Climate, 13, 3152–3171.
Palmer, T. N., C. Brankovic, P. Viterbo, and M. J. Miller, 1992:
Modeling interannual variations of summer monsoons.
J. Climate, 5, 399–417.
Pillai, P. A., and H. Annamalai, 2012: Moist dynamics of severe
monsoons over South Asia: Role of the tropical SST. J. Atmos.
Sci., 69, 97–115.
Reynolds, R. W., N. A. Rayner, T. M. Smith, D. C. Stokes, and
W. Wang, 2002: An improved in situ and satellite SST analysis
for climate. J. Climate, 15, 1609–1625.
Sahai, A. K., A. M. Grimm, V. Satyan, and G. B. Pant, 2003: Long-
lead prediction of Indian summer monsoon rainfall from
global SST evolution. Climate Dyn., 20, 855–863.
Shukla, J., and D. A. Paolino, 1983: The Southern Oscillation and
long-range forecasting of the summer monsoon rainfall over
India. Mon. Wea. Rev., 111, 1830–1837.
Slingo, J. M., and H. Annamalai, 2000: 1997: The El Nin˜o of the
century and the response of the Indian summer monsoon.
Mon. Wea. Rev., 128, 1778–1797.
Straus, M. D., and V. Krishnamurthy, 2007: The preferred structure
of the interannual Indian monsoon variability. Pure Appl.
Geophys., 164, 1717–1732.
Su, H., J. D. Neelin, and C. Chou, 2001: Tropical teleconnection
and local response to SST anomalies during 1997–1998 El
Nin˜o. J. Geophys. Res., 106 (D17), 20 025–20 044.
Wang, B., R. Wu, and X. Fu, 2000: Pacific–East Asian tele-
connection: How does ENSO affect East Asian climate?
J. Climate, 13, 1517–1536.
——, ——, and T. Li, 2003: Atmosphere–warm ocean interaction
and its impacts on Asian–Australian monsoon variation.
J. Climate, 16, 1195–1211.
——, Q. Ding, X. Fu, I.-S. Kang, K. Jin, and J. Shukla, 2005:
Fundamental challenge in simulation and prediction of sum-
mer monsoon rainfall. Geophys. Res. Lett., 32, L15711,
doi:10.1029/2005GL022734.
Watanabe, M., and F. Jin, 2003: A moist linear baroclinic model:
Coupled dynamical–convective response to El Nin˜o. J. Cli-
mate, 16, 1121–1139.
Wu, R., and B. Kirtman, 2005: Roles of Indian and Pacific Ocean
air-sea coupling in tropical atmospheric variability. Climate
Dyn., 25, 155–170.
Xie, P., and P. A. Arkin, 1997: Global precipitation: A 17-year
monthly analysis based on gauge observations, satellite esti-
mates, and numerical model outputs. Bull. Amer. Meteor. Soc.,
78, 2539–2558.
7508 J O U R N A L O F C L I M A T E VOLUME 25